
A new high above 1,191.71 invalidated two hourly Elliott wave counts confirming the prior downwards wave as complete.
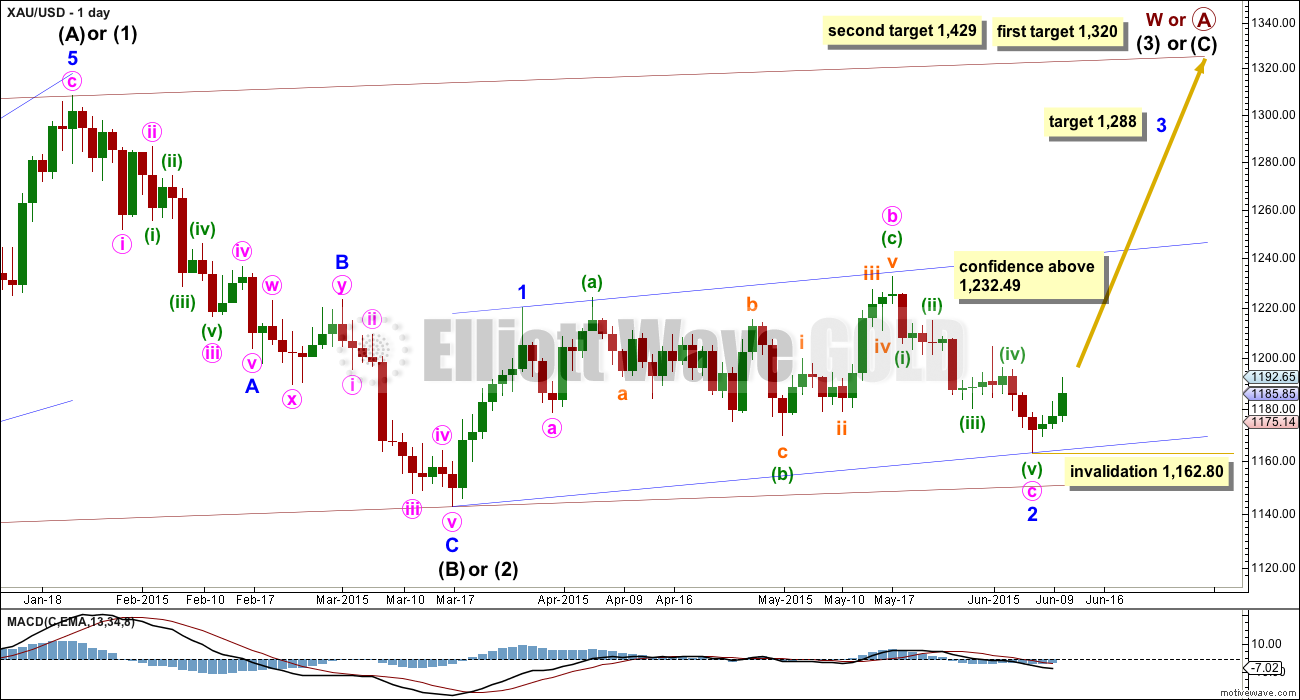
Summary: The bull wave count now expects a third wave up has begun, and the target is the same at 1,288. The bear wave count now expects a second wave correction is either over as a rare triple zigzag, or may continue sideways as a flat correction for a few days. A new low below 1,162.80 at any time would be a strong bearish indicator. To the upside, a new high above 1,232.49 would invalidate the bear wave count and confirm the bull wave count.
To see the bigger picture and weekly charts go here.
Changes to last analysis are italicised.
Bull Wave Count
Click chart to enlarge.
The bull wave count sees primary wave 5 and so cycle wave a a complete five wave impulse on the weekly chart.
Pros:
1. The size of the upwards move labelled here intermediate wave (A) looks right for a new bull trend at the weekly chart level.
2. The downwards wave labelled intermediate wave (B) looks best as a three.
3. The small breach of the channel about cycle wave a on the weekly chart would be the first indication that cycle wave a is over and cycle wave b has begun.
Cons:
1. Within intermediate wave (3) of primary wave 5 (now off to the left of this chart), to see this as a five wave impulse requires either gross disproportion and lack of alternation between minor waves 2 and 4 or a very rare running flat which does not subdivide well. I have tried to see a solution for this movement, and no matter what variation I try it always has a major problem.
2. Intermediate wave (5) of primary wave 5 (now off to the left of the chart) has a count of seven which means either minor wave 3 or 5 looks like a three on the daily chart.
3. Expanding leading diagonals (of which intermediate wave (A) or (1) is) are are not very common (the contracting variety is more common).
4. Volume does not support this bull wave count.
For volume to clearly support the bull wave count it needs to show an increase beyond 187.34 (30th April) and preferably beyond 230.3 (9th April) for an up day. Only then would volume more clearly indicate a bullish breakout is more likely than a bearish breakout.
Within cycle wave b, primary wave A may be either a three or a five wave structure. So far within cycle wave b there is a 5-3 and an incomplete 5 up. This may be intermediate waves (A)-(B)-(C) for a zigzag for primary wave A, or may also be intermediate waves (1)-(2)-(3) for an impulse for primary wave A. At 1,320 intermediate wave (C) would reach equality in length with intermediate wave (A) and primary wave A would most likely be a zigzag. At 1,429 intermediate wave (3) would reach 1.618 the length of intermediate wave (1) and primary wave A would most likely be an incomplete impulse.
Intermediate wave (A) subdivides only as a five. I cannot see a solution where this movement subdivides as a three and meets all Elliott wave rules (with the sole exception of a very rare triple zigzag which does not look right). This means that intermediate wave (B) may not move beyond the start of intermediate wave (A) below 1,131.09. That is why 1,131.09 is final confirmation for the bear wave count at the daily and weekly chart level.
Intermediate wave (C) is likely to subdivide as an impulse to exhibit structural alternation with the leading diagonal of intermediate wave (A). This intermediate wave up may be intermediate wave (3) which may only subdivide as an impulse.
Minor wave 2 is over here. Minute wave c is just 2.7 longer than 1.618 the length of minute wave a. At 1,288 minor wave 3 would reach 1.618 the length of minor wave 1.
Within minor wave 3, no second wave correction may move beyond its start below 1,162.80.
A new high above 1,232.49 would eliminate the bear wave count and provide full confidence in the targets.
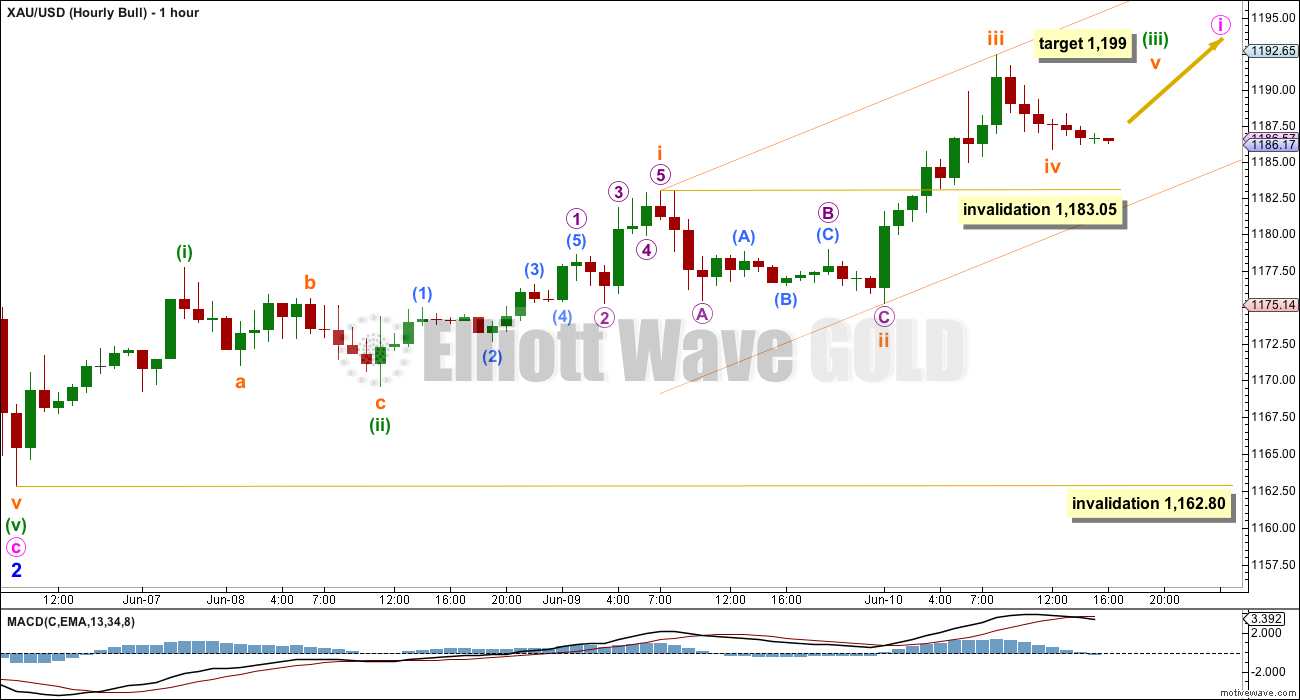
Hourly Bull Wave Count
Click chart to enlarge.
The leading diagonal was invalidated. The length of the final fifth wave was longer than the third, leaving the third wave the shortest and violating a core Elliott wave rule.
If minor wave 3 has begun, then it must be starting with a more common impulse for the first wave and it must be incomplete.
Momentum indicates that the last wave up labelled subminuette wave iii is the middle of a third wave. There is no Fibonacci ratio between subminuette waves i and iii so it would be likely that subminuette wave v exhibits a Fibonacci ratio to either of subminuette waves i or iii. At 1,199 subminuette wave v would reach equality in length with subminuette wave i.
Subminuette wave iv may not move into subminuette wave i price territory below 1,183.05. If this price point is breached, then for the bull wave count it may be another second wave correction and the invalidation point for that would be at 1,175.27. That would see subminuette wave iii incomplete.
The bull wave count does not yet expect a second wave correction to begin, because it is not possible to see a complete five up either as an impulse or a diagonal.
When the second wave correction does arrive it may not move beyond the start of minute wave i below 1,162.80.
Draw a channel about the middle of this third wave using Elliott’s first technique as shown. The fourth wave should find support at the lower edge of the channel, if it moves sideways and takes up more time. The final fifth wave up may find resistance at the upper edge of the channel.
Bear Wave Count
Click chart to enlarge.
This wave count follows the bear weekly count which sees primary wave 5 within cycle wave a as incomplete. At 957 primary wave 5 would reach equality in length with primary wave 1.
Pros:
1. Intermediate wave (1) (to the left of this chart) subdivides perfectly as a five wave impulse with good Fibonacci ratios in price and time. There is perfect alternation and proportion between minor waves 2 and 4. For this piece of movement, the bear wave count has a much better fit than the bull wave count.
2. Intermediate wave (2) is a very common expanded flat correction. This sees minor wave C an ending expanding diagonal which is more common than a leading expanding diagonal.
3. Minor wave B within the expanded flat subdivides perfectly as a zigzag.
4. Volume at the weekly and daily chart continues to favour the bear wave count. Since price entered the sideways movement on 27th March it is a downwards week which has strongest volume, and it is downwards days which have strongest volume.
5. On Balance Volume on the weekly chart recently breached a trend line from back to December 2013. This is another bearish indicator.
Cons:
1. Intermediate wave (2) looks too big on the weekly chart.
2. Intermediate wave (2) has breached the channel from the weekly chart which contains cycle wave a.
3. Minor wave 2 is much longer in duration than a minor degree correction within an intermediate impulse normally is for Gold. Normally a minor degree second wave within a third wave should last only about 20 days maximum. This one is 44 days long.
4. Within minor wave 1 down, there is gross disproportion between minute waves iv and ii: minute wave iv is more than 13 times the duration of minute wave i, giving this downwards wave a three wave look.
Minor waves 1 and 2 are complete. Minute wave i within minor wave 3 may be incomplete on the hourly chart.
Minute wave ii may not move beyond the start of minute wave i above 1,232.49.
The bull and bear wave counts both see a five wave impulse down either incomplete and requiring a final fifth wave, or complete at Friday’s low.
If this impulse takes price below 1,142.82, then the bull wave count would be invalidated. But only a new low below 1,131.09 would invalidate any variation of a bull wave count and provide full and final confirmation for a bear wave count.
When this five wave impulse is complete, then the bull wave count will expect a third wave up and this bear wave count will expect a second wave correction. At that stage, the bear wave count would be invalidated with a new high above 1,232.49 and the bull wave count would be confirmed.
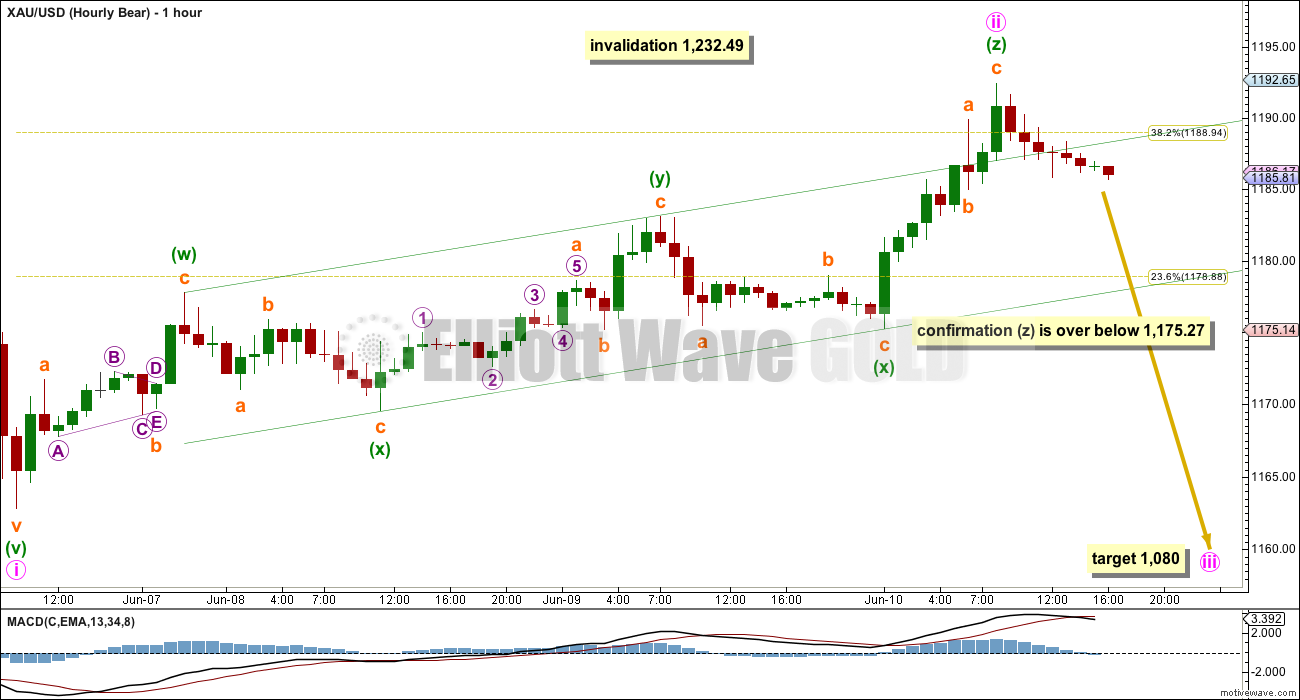
Main Hourly Bear Wave Count
Click chart to enlarge.
Minute wave i is confirmed now as over. The question now is whether or not minute wave ii is complete.
Minute wave ii is a lower degree second wave within a third wave one and two degrees higher. The strong downwards pull of intermediate wave (3) and minor wave 3 may force minute wave ii to be more brief and shallow than a second wave correction normally is. It is reasonably likely that minute wave ii is over already, lasting just three days and ending just above the 0.382 Fibonacci ratio.
My only concern for minute wave ii at this stage is whether or not the third zigzag is over or not. It is possible that minuette wave (z) may yet continue higher as a more obvious three wave structure. A new low below its start at 1,175.27 would confirm that it is over, because subminuette wave b within it may not move beyond the start of subminuette wave a.
At that stage, I would have confidence that the upwards wave is over for now and the next movement down has begun. At 1,080 minute wave iii would reach 1.618 the length of minute wave i.
Triple zigzags are reasonably rare structures, but I have seen at least two previously on Gold.
Alternate Hourly Bear Wave Count
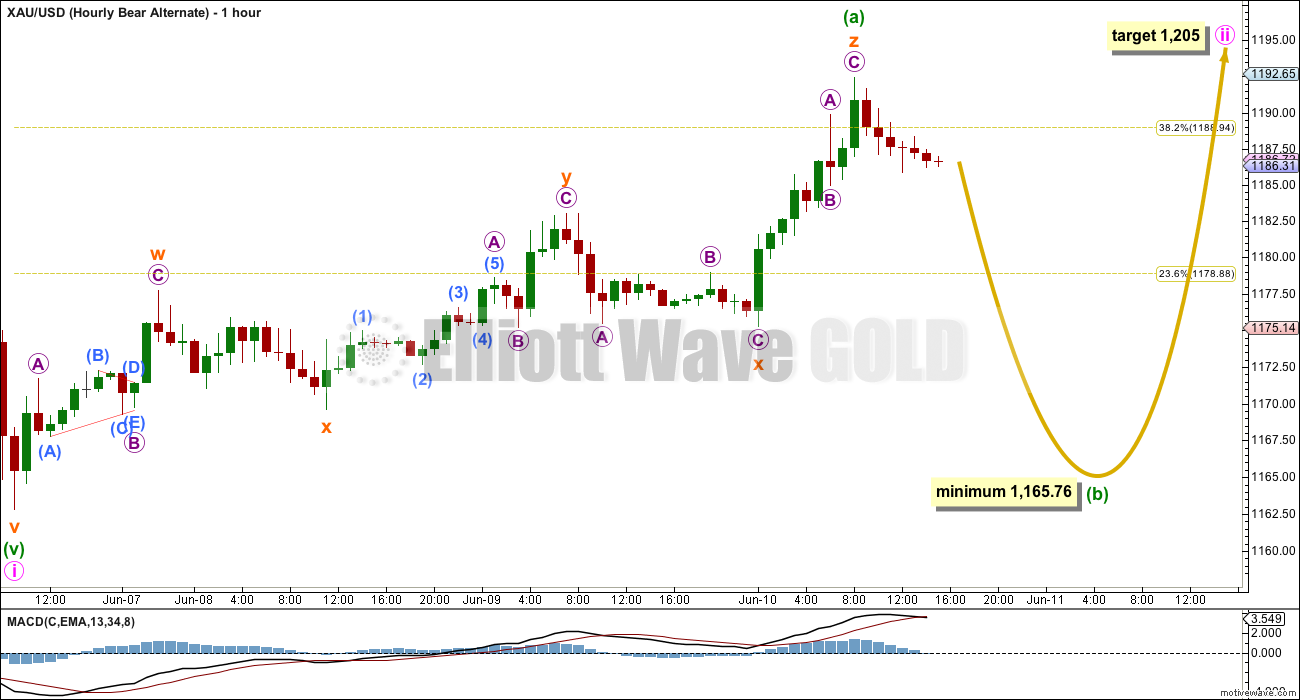
Click chart to enlarge.
This alternate wave count for the bear simply moves the degree of labelling within minute wave ii all down one degree. The triple zigzag may be only minuette wave (a).
It is not possible to have a multiple within a multiple, and the maximum number of corrective structures within a multiple is three. If minuette wave (a) is a multiple triple zigzag, then minute wave ii may not itself be a combination. When an A wave subdivides as a corrective structure the larger correction may only be a flat correction.
If minute wave ii is a flat correction, then minuette wave (b) within it must retrace a minimum 90% at 1,165.76. Minuette wave (b) may make a new low below the start of minuette wave (a) at 1,162.80 and in fact is reasonably likely to do so because the most common type of flat is an expanded flat, which requires minuette wave (b) to retrace 105% or more of minuette wave (a).
If minute wave ii continues sideways as a flat correction, it may end about the 0.618 Fibonacci ratio of minute wave i at 1,205.
If the next wave down is a clear three wave structure, and does not show a strong increase in downwards momentum, then minute wave ii may be continuing sideways as a flat correction. If the next wave down is a clear five wave structure, and shows a strong increase in downwards momentum, then minute wave ii would most likely be over as per the main hourly bear wave count.
Technical Analysis
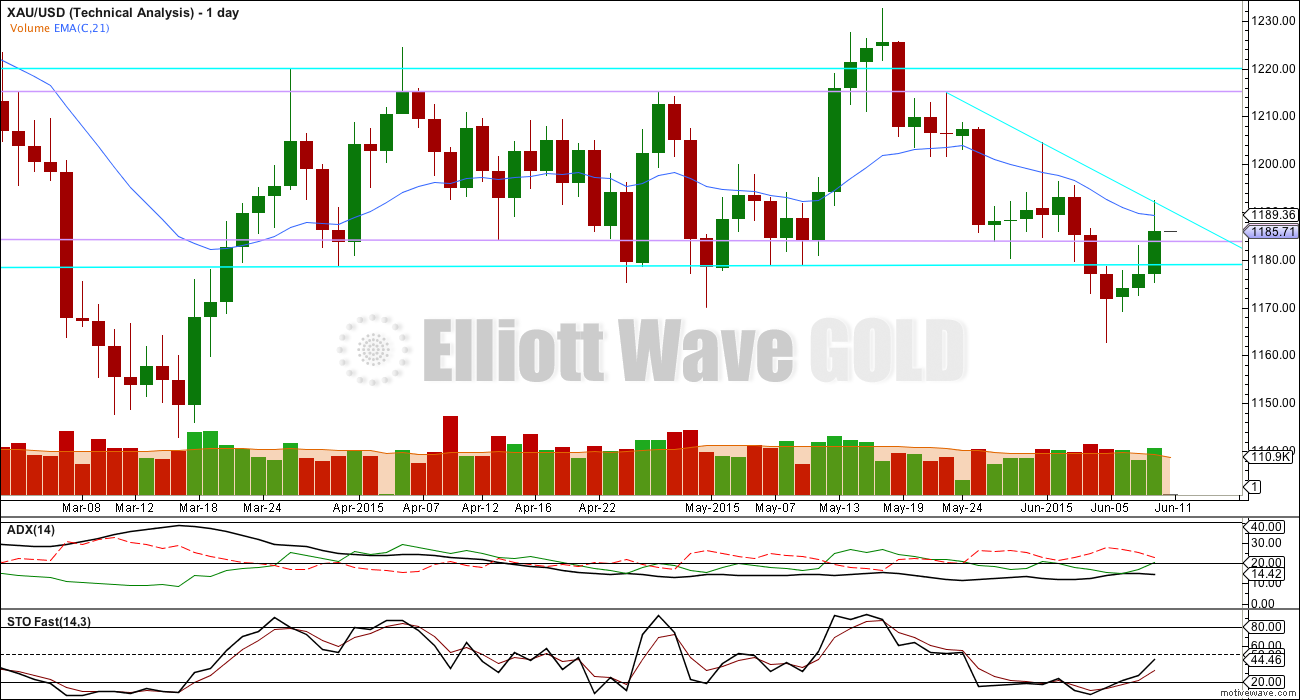
Click chart to enlarge.
At 14.42, ADX is still not above 15. No clear trend is yet indicated. A range bound system would still be indicated as the best approach to this market.
The lower lilac trend line has now been breached and volume slightly increased for Wednesday’s session. With price back into the trading range an upwards swing would not be more likely from here, using this approach.
The downwards sloping aqua blue trend line may provide some resistance. If that trend line is breached also, then more upwards movement may become more likely until price reaches resistance again at the upper horizontal lines and Stochastics returns to overbought.

Click chart to enlarge.
Overall volume still favours a downwards breakout eventually. During this sideways movement, it is still down days and a down week which have higher volume. On Balance Volume breaches a trend line (lilac line) which began in December 2013, and the breach is significant.
While price has made higher lows On Balance Volume has made lower lows (green trend lines). This small rise in price is not supported by volume, and it is suspicious.
This analysis is published about 05:54 p.m. EST.
Lara, has gold movements since Wednesday close changed forecast in any significant way either more bullish or bearish or still undecided? By the way your Technical analysis on GDX was significantly bearish and today it acted bearish.
It’s looking more bearish. For the bull count on the hourly chart I have tried to see if that last wave up will subdivide as a five, because minor wave 3 may only be an impulse and must begin with a five wave movement. The first wave up will not fit as an impulse or a diagonal. So I have to revert to the old 1-2, 1-2, 1-2. The problem there is the depth and duration of the current big second wave correction (now at micro degree). The second wave corrections are breaching base channels drawn about the first and second waves one degree higher, and this last one is almost 100%, it’s exceptionally deep. If price moves below 1,183.05 I’m having a really hard time figuring out a bullish wave count at the hourly chart level.
GDX Elliott Wave Technical Analysis – 10th June, 2015
by Lara · June 11th, 2015 · GDX · 2 Comments
GDX ANALYSIS WAS RELEASED THIS MORNING.
Does someone have a count for this downward move?. If the next wave down is a clear three wave structure, and does not show a strong increase in downwards momentum, then minute wave ii may be continuing sideways as a flat correction. If the next wave down is a clear five wave structure, and shows a strong increase in downwards momentum, then minute wave ii would most likely be over as per the main hourly bear wave count.
We might be in a triangle now which could be the 4th wave of a 5 down.
appears minute wave ii is continuing sideways as a flat correction to end at about 1205…
I was just going to ask Lara if she thought we were in wave (b) of alternate bear count– if she thought recent 24 hr movement was looking like 3-wave structure. Syed, really appreciate your post.
Not necessarily. I have a 5 down, followed by an incomplete 3 up currently completing it’s C wave. This may be either 1-2 or A-B of a zigzag. It’s not deep enough yet for a B wave of a flat (minimum on bear alternate hourly is 1,165.76). The start of an impulse will subdivide 5-3-5, and a zigzag also subdivides 5-3-5. It’s impossible at this stage to tell which one it is.
From yesterday’s high to today’s low there is a reasonable five wave impulse. I’m seeing this current small move up as an incomplete three, invalidation point 1,192.44. It’s in the C wave of a zigzag now, highly likely to make a new high above the end of it’s A wave at 1,185.49, and would reach equality with A at 1,187.39.
Lara: maybe I am misunderstanding you, but how could gold be in a C wave already if took several days for the A wave to complete? Gold would need at least another day just to complete a B wave, for the proportions to look feasible. Thanks.
I am referring to a very short term C wave at micro degree. The downwards move so far subdivides as a 5 – incomplete 3 – then another 5 down should unfold. The incomplete 3 subdivides A-B-C and I’m seeing C unfolding now. Does that make sense?
Scratch that, you mentioned numbers in the 1180s so you must be talking about a smaller C wave.
Matt, I think she’s referring to a lower level c wave.
I’m referring to a small wave within the B wave down. That’s all. Different degrees can be very confusing! Without charts. Next week it will be easy for everyone to upload charts with a couple of clicks… this whole discussion will be heaps easier.
Makes perfect sense. Your alt bear looks best to me because of the lack of momentum and follow through for downward movement. When the real 3rd of a 3rd comes, gold may move $30-50 in a matter of minutes.
Still holding 2/3 position long JNUG. Started a position in TMF yesterday, and added this morning, basis $66.20.
Is anyone still bullish as GDX has dropped and gold is still above 1175.27? Any wave count and expected retrace target?
Maybe I’ll buy back GDX as long as expected to bounce.
The Hourly Bull invalidation was revised down to 1175.27 after 1183.05 was broken as per Lara’s Wednesday analysis.
I’m selling GDX fast – Invalidation of Hourly Bull has happened with movement below 1183.05 already way down to 1175.78 at 8:30 am
Yes Lara will produce a new Hourly Bull count tonight.
Richard——– u do what u want to do but this from below—-Lara: “Subminuette wave iv may not move into subminuette wave i price territory below 1,183.05. If this price point is breached, then for the bull wave count it may be another second wave correction and the invalidation point for that would be at 1,175.27. That would see subminuette wave iii incomplete.–“
Thanks for the lower invalidation point I re-read it. I already sold GDX and gold and GDX are stagnant.
6/11 Wave count hour bull is invalidated. Gold must be going down in wave count hourly bear now. Any thoughts????
Looks like yesterday was a backtest of the broken channel.
Stocktwits chart
And USD looks oversold and at support. A move up from here would be bearish for gold.From public stockcharts
As I write this, gold is down below 1181, so hourly bull is invalid. A new hourly bull is needed and both bear counts are in play.
Bull not completely invalid (though downward move looked pretty strong to me). Per Lara (this may be an excerpt as i cut and paste and edit for myself) ———- Subminuette wave iv may not move into subminuette wave i price territory below 1,183.05. If this price point is breached, then for the bull wave count it may be another second wave correction and the invalidation point for that would be at 1,175.27. That would see subminuette wave iii incomplete.———– Now that I re-read your post I think your saying the same, we need a new bull count. 😉
Yes, it could be another nested 2nd wave, but I think that’s less likely.
Price dropped below 1183.05. This poses no problem for the bear counts. For the bull, Lara’s alternate scenario is playing out. I can’t interpret the statements “subminuette iii is incomplete” and “this may be another second wave correction”. The move cannot be part of subminuette ii because it would be an expanded flat 1183.07-1175.32-1192.44-? which would easily go below the invalidation point of 1175.27.
The nested 1-2 is still the most plausible bull count. And that will facilitate a surge in gold prices. However, I would still subscribe to the bearish view. The probable and imminent USD rebound, coupled with ongoing Greek impasse and possible default, makes for a bearish outlook for gold. Technically, gold has still to complete the larger trend correction below 1000. There is not much by way of optimism in price rising.
oh, good morning by the way.
Gold dropped on this news at 2:11 am
Dollar retakes ground vs. yen after Kuroda remarks deemed ‘careless’. June 11, 2015 2:11 a.m. ET
http://www.marketwatch.com/story/dollar-retakes-ground-vs-yen-after-kuroda-remarks-deemed-careless-2015-06-11
Lara: if possible, perhaps you could change my current posting name of “Matthias” to “Matt.” That way there is no confusion between me and the other subscriber below with a similar name. Thanks!
Will do – I actually thought you were the same person! So yeah, confusing much 🙂
Thursday 8:30 am US Retail Sales Report may move US dollar and Gold.
thank you for the reminder!
recent move makes me wonder if the Britts know something about our retails sales that we are yet to know.
Lara your video is terrific. You have a easy way to explain the overall complex details.
LOL that wasn’t easy. Sometimes I think I should save the bits I edit out and maybe put up a bloopers video for you to all have a laugh at me one day…. might be good entertainment value there….
Lara you might want to keep the bloopers yourself for a laugh. Once on the internet it’s out forever and you’d have to have “bloopers” visible at all times to protect yourself. It is funny thinking about it thanks for sharing.
Lara, love the last part of your video & analysis regarding technical analysis and weekly charts, which support the bearish escenario. When EW analysis isn´t clear (you have 2+ possible escenarios) TA should be supportive of one of those escenarios). However, I think you should complement better your daily analysis with further TA (e.g. HUI, GDX trend analysis, and even Gold & Silver trend analysis).
In a perfect world yes I should. But this analysis took about 4 hours. I have S&P 500 to do as well… and two websites to maintain. There is just not enough time in one day to do it all.
I do look at GDX more regularly than i publish analysis for it, and I do look at Silver daily also. I’m just not including trend analysis of either in Gold.
Matt – Gold volume is high and provides textbook accurate EW charts, GDX and Silver volume is much lower and because of this they don’t provide accurate EW charts. That is what has happened time and time again when Lara did GDX and Silver charts as per Lara’s own explanations in the last 2 years.
Mathius is a different subscriber. You might be confusing us.
Gold price is looking to rally (short term up move) from current levels; that would bring hourly bull count in to play seeking 1201-02….
… a break above 1192-93 required….
What tells you that?
Hello Matthias: JUST MY VIEW: Plenty of tell-tale signs for an expected uptick to occur… Overnight Gold price failed to get below 1184-83 and is bottomy here now (that pretty much matches up with Lara’s analysis for hourly Bull Wave count); stochastic is bullish; upturn in MacdMA indicates a rally; other such indicators including ADX which has dropped (indicating diminishing strength) although DMI+ remains below DMI- (indicative of down trending)…. I would expect Gold price to get choppy. Levels to take out on the upside 1189-92-93…. I dare say Gold price would still need to take out the recent 1204.70 //// Downside risk 10dma 1183, upside risk 20weekMA 1207 and 100dma at 1206-07….
Syed thanks for clarifying the bullish outlook.
Thanks Syed. There is a chance of some minimal immediate upside movement beyond the recent high, but I don’t think it will get very far. I am more inclined to see some more downward movement now for a B wave. After re-analyzing prices, volume, etc., I believe that the sideways movement could drag on for several more trading days (perhaps beyond the 17th) until a C wave high occurs. Moreover, even though 1205 is the current target, the 1210 area may also be a possibility for the end of the correction. There are several alignments there. Besides, it is likely that gold – if it gets that high – will hit a number of stops above 1200, and the 1204 spike from a couple weeks ago, to get it there.
Hi Matt: Agree with your view. Thanks.