
Downwards movement fits the bear Elliott wave count better than the bull, but it is not enough to provide price confirmation yet.
Summary: The bull wave count expects the middle of a third wave up to show a strong increase in momentum. A short term target is at 1,209, and the mid / long term target for the third wave to end is still at 1,288. A new high above 1,192.44 would be short term bullish. The bear wave count expects another five wave move down which may be a third wave or a C wave. A new low below 1,175.27 would be short term bearish, and more downwards movement to at least 1,165.76 should be expected.
To see the bigger picture and weekly charts go here.
Changes to last analysis are italicised.
Bull Wave Count
Click chart to enlarge.
The bull wave count sees primary wave 5 and so cycle wave a a complete five wave impulse on the weekly chart.
Pros:
1. The size of the upwards move labelled here intermediate wave (A) looks right for a new bull trend at the weekly chart level.
2. The downwards wave labelled intermediate wave (B) looks best as a three.
3. The small breach of the channel about cycle wave a on the weekly chart would be the first indication that cycle wave a is over and cycle wave b has begun.
Cons:
1. Within intermediate wave (3) of primary wave 5 (now off to the left of this chart), to see this as a five wave impulse requires either gross disproportion and lack of alternation between minor waves 2 and 4 or a very rare running flat which does not subdivide well. I have tried to see a solution for this movement, and no matter what variation I try it always has a major problem.
2. Intermediate wave (5) of primary wave 5 (now off to the left of the chart) has a count of seven which means either minor wave 3 or 5 looks like a three on the daily chart.
3. Expanding leading diagonals (of which intermediate wave (A) or (1) is) are are not very common (the contracting variety is more common).
4. Volume does not support this bull wave count.
For volume to clearly support the bull wave count it needs to show an increase beyond 187.34 (30th April) and preferably beyond 230.3 (9th April) for an up day. Only then would volume more clearly indicate a bullish breakout is more likely than a bearish breakout.
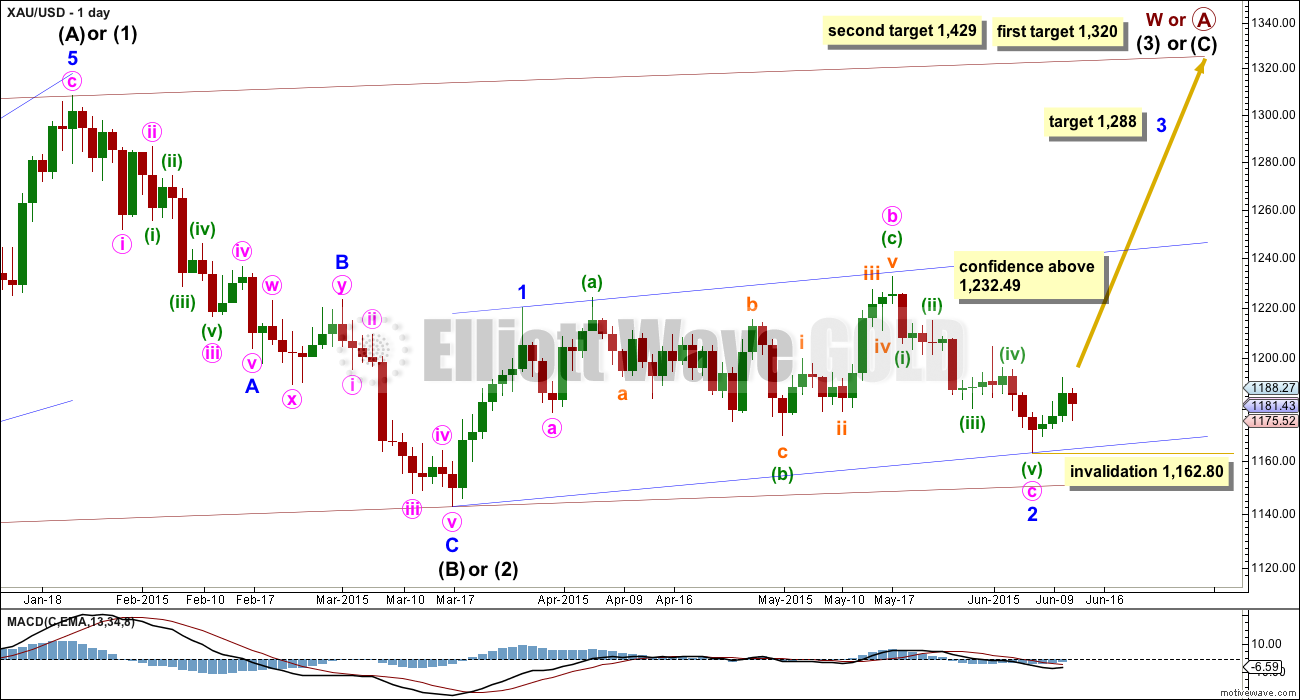
Within cycle wave b, primary wave A may be either a three or a five wave structure. So far within cycle wave b there is a 5-3 and an incomplete 5 up. This may be intermediate waves (A)-(B)-(C) for a zigzag for primary wave A, or may also be intermediate waves (1)-(2)-(3) for an impulse for primary wave A. At 1,320 intermediate wave (C) would reach equality in length with intermediate wave (A) and primary wave A would most likely be a zigzag. At 1,429 intermediate wave (3) would reach 1.618 the length of intermediate wave (1) and primary wave A would most likely be an incomplete impulse.
Intermediate wave (A) subdivides only as a five. I cannot see a solution where this movement subdivides as a three and meets all Elliott wave rules (with the sole exception of a very rare triple zigzag which does not look right). This means that intermediate wave (B) may not move beyond the start of intermediate wave (A) below 1,131.09. That is why 1,131.09 is final confirmation for the bear wave count at the daily and weekly chart level.
Intermediate wave (C) is likely to subdivide as an impulse to exhibit structural alternation with the leading diagonal of intermediate wave (A). This intermediate wave up may be intermediate wave (3) which may only subdivide as an impulse.
Minor wave 2 is over here. Minute wave c is just 2.7 longer than 1.618 the length of minute wave a. At 1,288 minor wave 3 would reach 1.618 the length of minor wave 1.
Within minor wave 3, no second wave correction may move beyond its start below 1,162.80.
A new high above 1,232.49 would eliminate the bear wave count and provide full confidence in the targets.
Hourly Bull Wave Count
Click chart to enlarge.
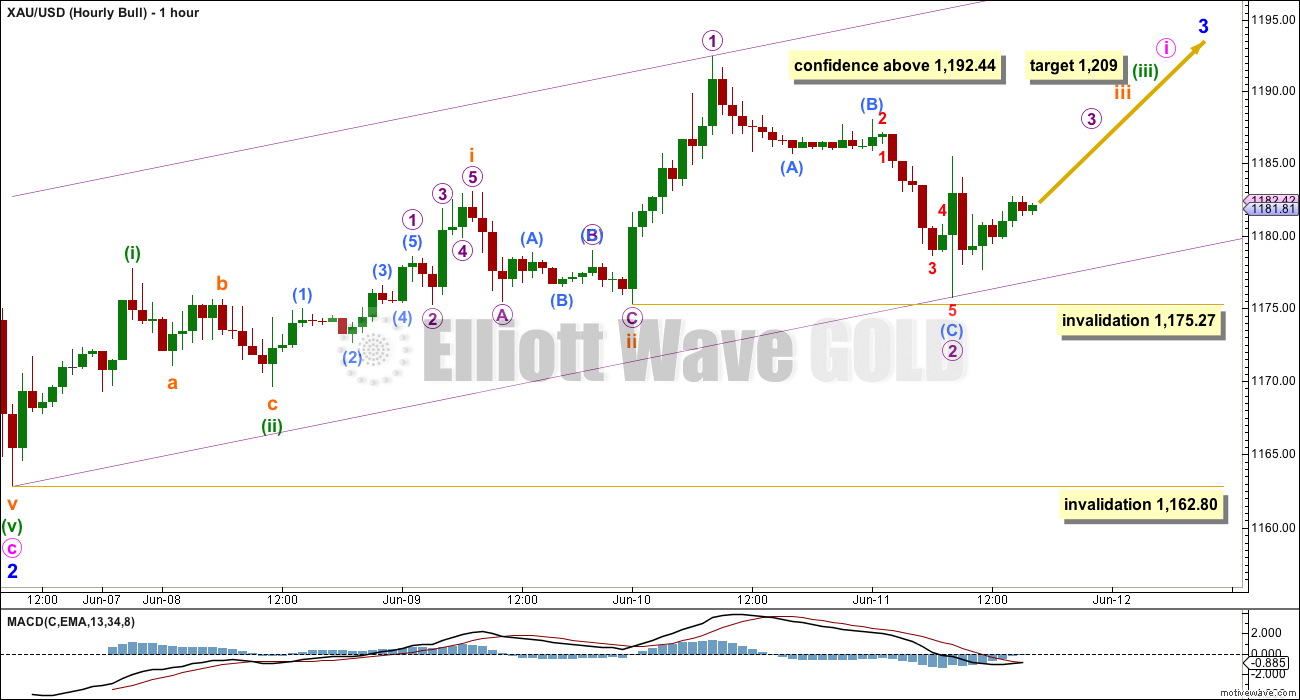
Downwards movement may not be a fourth wave correction and may only be another second wave. The bull wave count now must revert to seeing this upwards move as a series of overlapping first and second waves to start minor wave 3.
This is very common for the start of a third wave, but it does have some problems which reduce its probability.
A base channel drawn about each first and second wave at minuette and subminuette degree would be breached by the following second wave correction one degree lower. I have not drawn these base channels on this hourly chart because they are not useful in showing where price is finding support. When a lower degree second wave correction breaches a base channel drawn about a first and second wave one or more degrees higher, the probability that the move is a second wave reduces. This is still a valid wave count though because base channels just don’t always work.
Micro wave 2 is an exceptionally deep second wave. It should be more likely to be brief and shallow as a small second wave correction within a third wave one and two degrees higher. It is showing up on the daily chart as a red candlestick, which is unusual for a micro degree second wave correction.
At 1,209 minuette wave (iii) would reach 2.618 the length of minuette wave (i).
A new high above 1,192.44 would invalidate the bear wave count at the hourly chart level and would provide some confidence in this hourly bull wave count.
Micro wave 2 may not move beyond the start of micro wave 1 below 1,175.27. If downwards movement continues below this price point, I am struggling to see a bull wave count at the hourly chart level. That does not mean a valid count does not exist, and if I find one I shall publish it. For now I cannot see a solution.
Within minor wave 3, no second wave correction may move beyond its start below 1,162.80. In the short / mid term a new low below 1,162.80 would substantially support the bear wave count.
Bear Wave Count
Click chart to enlarge.
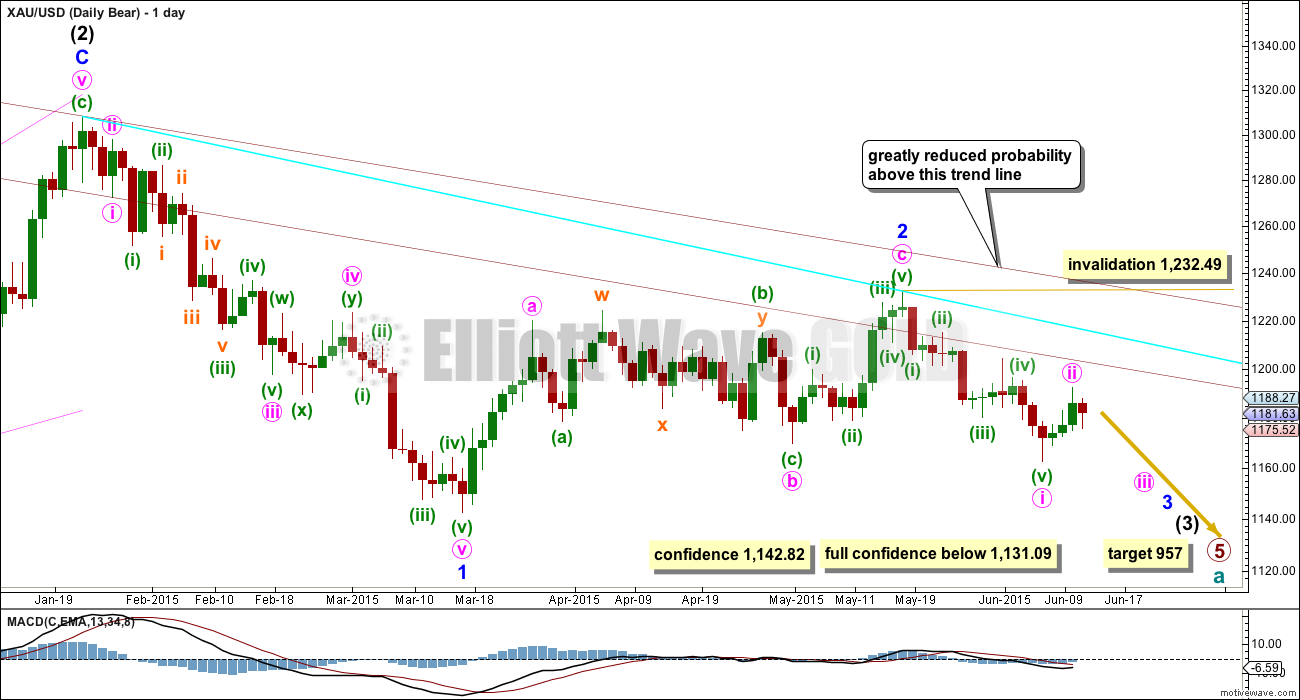
This wave count follows the bear weekly count which sees primary wave 5 within cycle wave a as incomplete. At 957 primary wave 5 would reach equality in length with primary wave 1.
Pros:
1. Intermediate wave (1) (to the left of this chart) subdivides perfectly as a five wave impulse with good Fibonacci ratios in price and time. There is perfect alternation and proportion between minor waves 2 and 4. For this piece of movement, the bear wave count has a much better fit than the bull wave count.
2. Intermediate wave (2) is a very common expanded flat correction. This sees minor wave C an ending expanding diagonal which is more common than a leading expanding diagonal.
3. Minor wave B within the expanded flat subdivides perfectly as a zigzag.
4. Volume at the weekly and daily chart continues to favour the bear wave count. Since price entered the sideways movement on 27th March it is a downwards week which has strongest volume, and it is downwards days which have strongest volume.
5. On Balance Volume on the weekly chart recently breached a trend line from back to December 2013. This is another bearish indicator.
Cons:
1. Intermediate wave (2) looks too big on the weekly chart.
2. Intermediate wave (2) has breached the channel from the weekly chart which contains cycle wave a.
3. Minor wave 2 is much longer in duration than a minor degree correction within an intermediate impulse normally is for Gold. Normally a minor degree second wave within a third wave should last only about 20 days maximum. This one is 44 days long.
4. Within minor wave 1 down, there is gross disproportion between minute waves iv and ii: minute wave iv is more than 13 times the duration of minute wave i, giving this downwards wave a three wave look.
Minor waves 1 and 2 are complete. Minute wave i within minor wave 3 may be incomplete on the hourly chart.
Minute wave ii may not move beyond the start of minute wave i above 1,232.49.
A new low below 1,142.82 would provide a lot of confidence in this bear wave count. At that stage, the bull wave count may not be continuing its second wave correction. But only a new low below 1,131.09 would invalidate any variation of a bull wave count and provide full and final confirmation for a bear wave count.
Main Hourly Bear Wave Count
Click chart to enlarge.
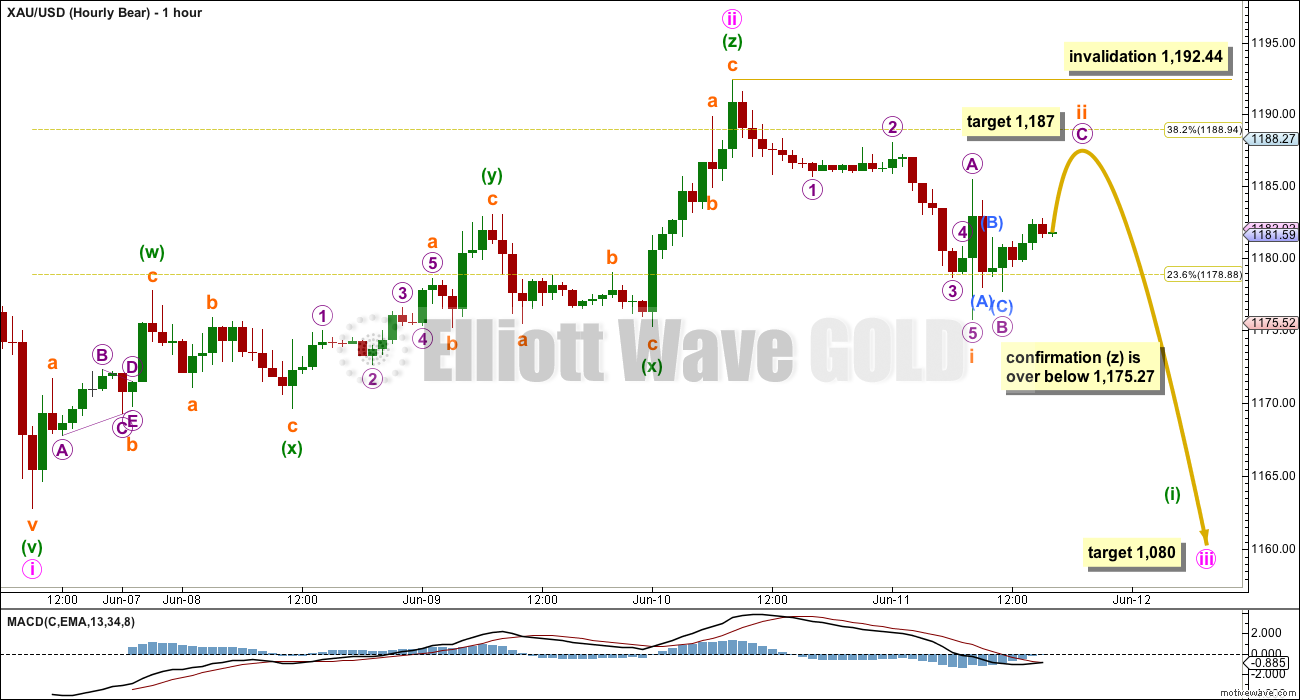
Minute wave ii may still be a complete triple zigzag, its subdivisions are perfect and the structure has a clear slope against the prior downwards trend. This looks like a typical triple zigzag. Although triples are reasonably rare, I have seen two before on Gold and this one looks typical.
If minute wave ii is over, it was a relatively brief and shallow correction. Because this is a small second wave correction within a third wave one and two degrees higher, the strong downward pull of the middle of intermediate wave (3) may force this second wave to be more brief and shallow than a second wave correction normally is, so it is more likely to be over now.
Minute wave iii may only subdivide as an impulse. Within it, minuette wave (i) must unfold as a five wave structure, is very likely to be an impulse, and highly unlikely to be a leading diagonal.
So far within minuette wave (i), it may have subminuette wave i complete and subminuette wave ii incomplete. An impulse subdivides 5-3-5-3-5, and so the first waves of 1-2-3 subdivide 5-3-5, which is exactly how a zigzag subdivides. It is impossible today to tell if this move unfolding downwards is the start of an impulse or halfway through a zigzag (alternate bear hourly count below).
Subminuette wave ii may not move beyond the start of subminuette wave (i) above 1,192.44.
Subminuette wave ii may be an incomplete zigzag. At 1,187 micro wave C would reach equality in length with micro wave A.
A new low below 1,175.27 would invalidate the hourly bull wave count and would confirm the third zigzag of minuette wave (z) as complete. A new low below 1,175.27 would at this stage provide some small confidence in this bear wave count.
Alternate Hourly Bear Wave Count
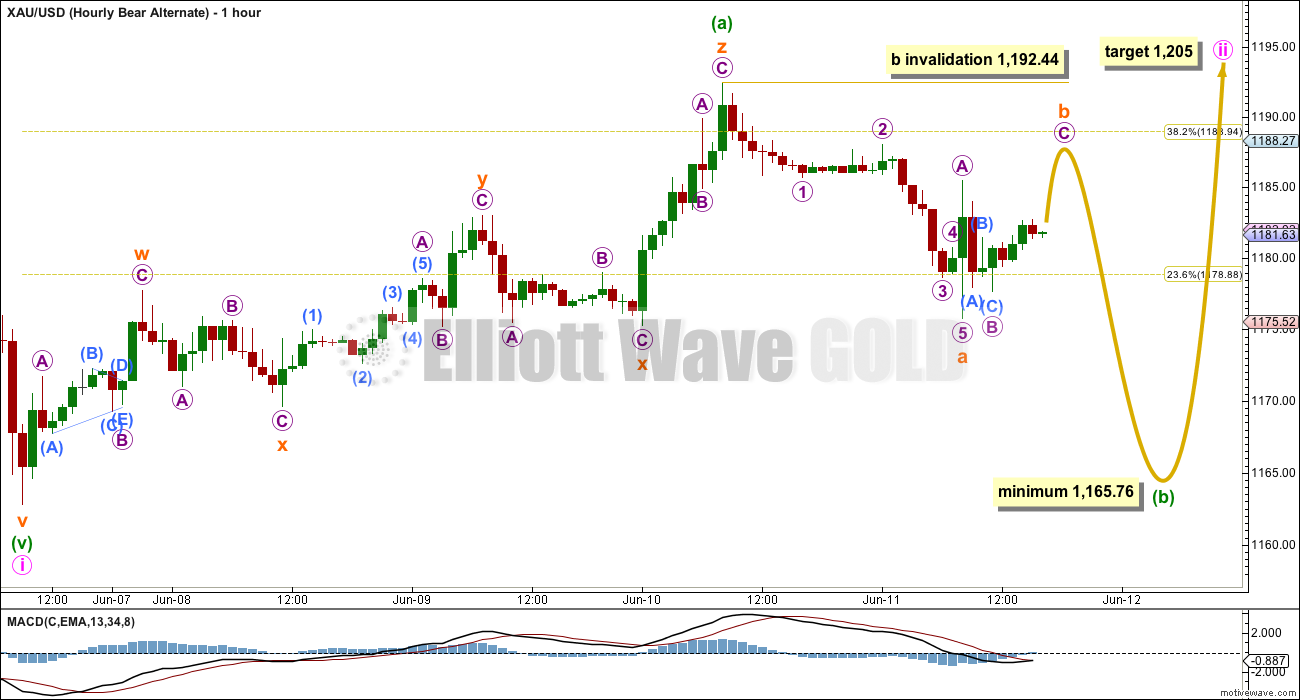
Click chart to enlarge.
As yesterday, the degree of labelling within minute wave ii has been moved down one degree. It is still possible that minute wave ii is unfolding as a flat correction.
Flat corrections require the A wave to subdivide as a “three”, a corrective structure. This one for minuette wave (a) may be a complete triple zigzag.
Within the flat correction, minuette wave (b) must retrace a minimum 90% of minuette wave (a) at 1,165.76. It may make a new low below the start of minuette wave (a) at 1,162.80 and is reasonably likely to do so because the most common type of flat is an expanded flat, which requires minuette wave (b) to be a 105% length of minuette wave (a) at 1,161 or below.
A-B-C for a zigzag subdivides exactly the same as 1-2-3 within an impulse. What happens after the first 5-3-5 is complete tells us if the move was a completed zigzag or is an incomplete impulse. If price turns up and moves back into wave A or 1 price territory, it can’t be a fourth wave and so a zigzag would be complete. If price does not reach back into what is wave A or 1 territory, then it would be a fourth wave and an impulse should be expected to continue lower.
Subminuette wave b may not move beyond the start of subminuette wave a above 1,192.44.
If the next move down is a five and does not show a very strong increase in downwards momentum, it may be subminuette wave c of a zigzag.
But if the next move down is a five and shows a strong increase in momentum, and is much longer than the first five down, it may be more likely a third wave (as per the main bear hourly wave count).
Technical Analysis

Click chart to enlarge.
Weekly Chart: Overall volume still favours a downwards breakout eventually. During this sideways movement, it is still down days and a down week which have higher volume. On Balance Volume breaches a trend line (lilac line) which began in December 2013, and the breach is significant.
While price has made higher lows On Balance Volume has made lower lows (green trend lines). This small rise in price is not supported by volume, and it is suspicious.
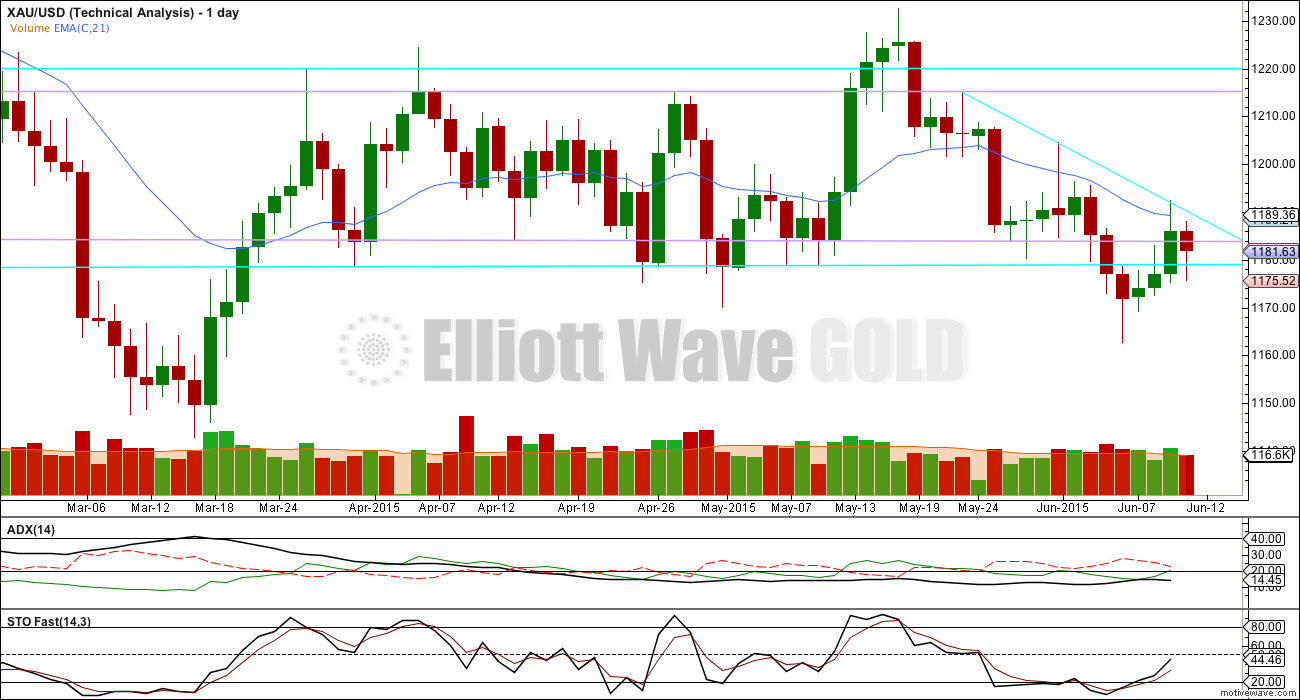
Click chart to enlarge.
Daily Chart: At 14.45 ADX is still below 15. ADX is still indicating no clear trend is yet evident. A range bound trading system is still better than a trend following system for this market.
This range bound system illustrated here uses horizontal lines of support and resistance, with fast Stochastics to indicate oversold and overbought. The approach is to expect the end of one swing and the beginning of another when price and Stochastics are both at support or resistance with oversold or overbought. Currently Stochastics is returning from oversold and price is moving back above support. An upwards swing would be expected to continue from this point.
Trading a range bound market is much more risky than trading a market which is clearly trending. All the technical analysis books I have read advise extreme caution in a range bound market (they insist it is best left to experienced traders only). The risk of loss is much greater than a trending market. This risk is clearly illustrated by how far price varies above and below the outer blue horizontal lines; it is impossible to tell exactly where one swing ends and price changes direction. Substantial movement outside the horizontal lines may still be followed by the next swing, and substantial losses may be incurred if traders enter too soon.
I cannot stress strongly enough that if members insist on trading a range bound market that your stops are carefully placed, you do not overexpose your account, and you manage your money carefully. From Kirkpatrick and Dahlquist, “Technical Anaylsis” page 567: “Theory of Runs. The chance of going broke from a series of losses is the amount of trading times the percentage of losses to the power of the largest string of losses. Most analysts will assume a minimum round of ten consecutive losses as the baseline. In any case, most calculations end with a maximum suggested percentage investment of around 2% to avoid the risk of going broke.” (Emphasis on 2% is mine.)
To avoid wiping out your account in these very difficult market conditions this would be good advice.
And finally, from my own personal experience (I’m very risk averse), it is often the trades you don’t take which make the difference between profit and loss, and prevent your account from being wiped out.
This analysis is published about 06:00 p.m. EST.
The COT moved much more bullish.
I’m swapping over the main and alternate bear hourly counts today. This small inside day looks corrective. It’s taking it’s time… I think it’s maybe 55% likely to be a B wave, and 45% likely to be a small second wave. For the bull wave count… the fact that it can’t make a five up on the hourly chart is really concerning ATM, especially when you consider the weight of bearish indicators. That bull count MUST keep going up from here, and that trend line on the TA chart must be breached before I’d have any confidence in those bullish targets at this stage.
Thanks for your input here on probabilities.
Lara does gold still have to bounce up to 1187 target area first for both bull and bear? Are you still giving, “Extreme caution is advised if you are expecting an upwards swing from here.”?
For the bear wave counts yes, the C wave has only just begun, and should move at least slightly above the A wave to avoid a truncation at 1,185.49. The target is now 1,186. For the bull wave count is absolutely must move up from here, and the fact that at the start of a minor degree third wave it can’t yet even make a clear five up on the hourly chart is further concern for the bull count. So yes to both questions.
Wall Street, Main Street Decisively Bearish On Gold Next Week
By Neils Christensen – Friday June 12, 2015 12:12
http://www.kitco.com/news/2015-06-12/Wall-Street-Main-Street-Decisively-Bearish-On-Gold-Next-Week.html
Gold price has traded in a narrow trade range thus far and is having an inside day to an inside day~!…This is potent enough for a likely outcome of a breakout with strong impulse to occur…. No signs yet of a breakdown below 1175-73…. tough one to figure out.
Lara cautions in video: Technical Analysis portion: Bearish is more likely. Extreme caution is advised if you are expecting an upwards swing from here. You may want to wait for the baby blue down slopped trend line (on 1 day chart) to be breached to the upside before going bullish.
If gold peaks early 9:30 to 11 then drops rest of the day or if drops early goes up rest of the day. Today it peaked early so pattern may be down until about 3 pm? That is just what I’m used to seeing as gold’s pattern early after open is opposite versus the rest of the day until maybe late afternoon when the the Pros come in.
Any opinions on gold’s general intra-day patterns that may be useful?
Lara: what is the maximum common length of an expanded flat correction? Is it 200% of its prior wave? I am wondering if minuette wave B (alt bear) could conceivably move far lower than 105%. For example, could this B wave – if that is what this is – move down to the 1140s (150-170% correction), only to be followed by a C wave that rockets gold back up to the 1205 target? Thanks
I think she has answered this in the past, and if I recall, there is no maximum, just a minimum.
There’s no rule which states any maximum, and I have seen B waves within expanded flats that are 3X the length of the A wave. There is a convention (from Mr Prechter I think) that when the B wave is twice the A wave the probability an expanded flat is unfolding is greatly reduced and the wave count should be discarded.
Bonds rockin, miners turning green.
Gold looks weak. Looks like a 5 up completed for micro wave c (both bear hourly counts) and now gold is down to 1178. If we go below 1175.27, the next bear target @ 1165.76 will be in play.
I would be a little wary of calling micro wave C over, it would be truncated by a fair margin. And micro wave C won’t subdivide as an impulse or an ending diagonal on the hourly chart. (It may possibly subdivide as an impulse on the five minute chart) It may be that micro wave B is continuing sideways now and micro C has yet to begin. That last upwards wave does subdivide perfectly as a zigzag.
Gold price making it very unclear which wave count to follow grrr…. Gold price had an inside day on Thursday with H 1187.4 / L 1174.8 (traders’ indecision?)…. Ordinarily I would expect a range break or range expansion. Gold price initial movement has been up and away from pivot coming back down but not getting under it suggesting / indicating for a possible price rise… I would be tempted to take a Buy with SL at 1178 or 1176 for TP 1183-84-85, 1189-90, 1192-93 (higher if Gold price is to reach 1205-1210) and look for price weakness at any of these levels to convert to sell for TP 1176-75, 1171-70 and lower 1165 as per Lara’s expected downside target…. Tough one today of which way to go lol
Lara I liked your deluxe explanation of trading risks and precautions in the Technical Analysis bottom section. Important to understand especially with the use of 3x miners ETFs in this range bound trend less market.
That’s great! If even only one person applies the 2% idea to their trades and it avoids their account being wiped out… it will have worked.
Lara any idea how long it might be before gold moves through full confidence and we are left with only one either the bull or the bear?
Just looking for a trend again.
With both wave counts now expecting third waves… in opposite directions… if either one of those wave counts is right then I hope it should not be too long now. This is a particularly long consolidation period, unusual for this market in recent years. It WILL end. If the bear count is right we should get some clarification sooner rather than later, if the bull count is right it would take longer because the confirmation point is further away.
Actually, I take that back about this being unusual for Gold. It did have a big consolidation for primary wave 4. But at least I had a better idea what was happening, the triangle was pretty clear particularly at the end. This time… many more possible EW structures are in play.
Today Treasury rates specially 10yr eased off. If 10yr rates slides down that is bullish for gold .
Even Coin Collectors Have Given Up on Gold
Bloomberg By Debarati Roy 5 hours ago
https://finance.yahoo.com/news/gold-coin-market-vanishing-u-052036235.html
GDX had $80M in positive money flow again today. $70M on Tuesday, and $120M on Friday. Seems like someone is buying these dips.
Bonds rocked today, in late Dec, and mid Mar, bonds took off a few days before gold.
Of the hourly counts above, I rank the 1) Alternate Bear, 2) Bull, 3) Main Bear.
Interesting times here for gold, it may still take a week or two to figure this all out, and it seems like we have been saying that for 3 months now. Gold held it’s ground today with the impacts of the Yes, and Dollar. $gold:$silver ratio looks like it wants to start rolling over.
Silver Futures open interest is at or close to an all time high. In the recent past this has coincided with a spec short squeeze.
That’s all for now, bought some ice cream with a TZA trade today.
impact of the YEN (looking forward to the edit feature returning 🙂