
Sideways movement in a larger range fits the bear Elliott wave count at the hourly chart level better than the bull.
Summary: The bear wave count expects downwards movement to 1,165.76 minimum before another five wave structure up to a target at 1,205 (that target may change). The bull wave count expects a third wave up to 1,225 from here.
To see the bigger picture and weekly charts go here.
Changes to last analysis are italicised.
Bull Wave Count
Click chart to enlarge.
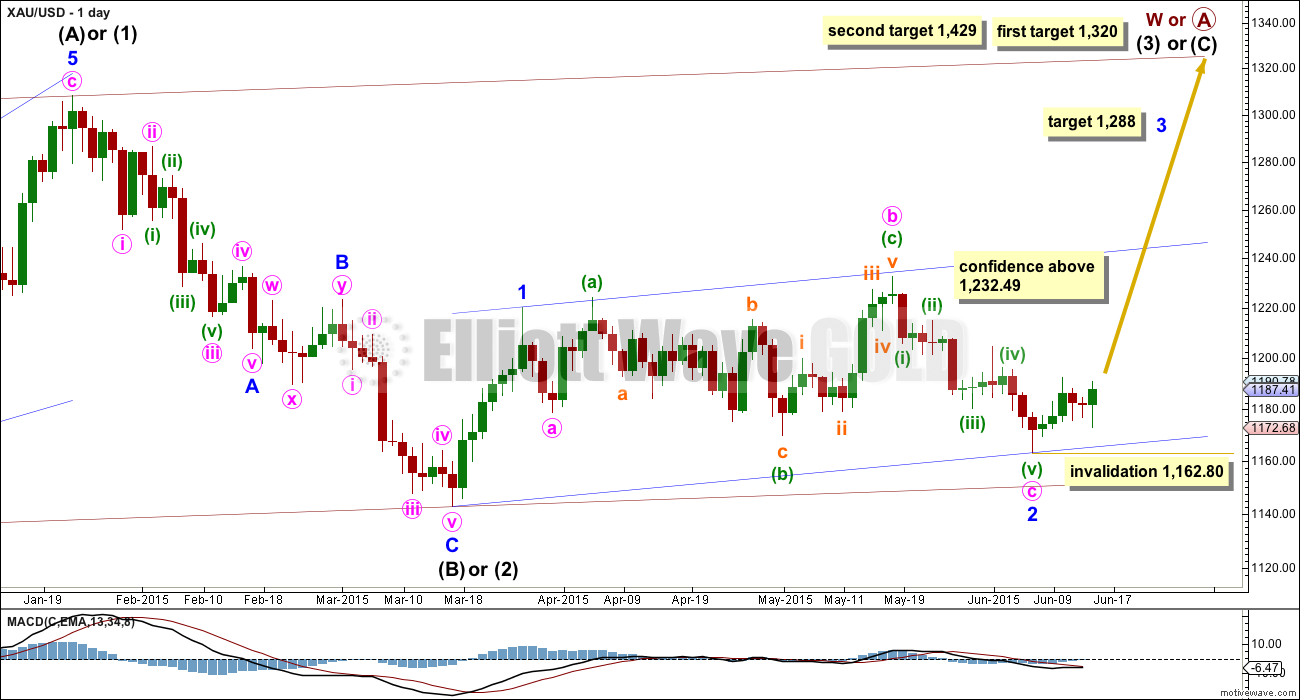
The bull wave count sees primary wave 5 and so cycle wave a a complete five wave impulse on the weekly chart.
Pros:
1. The size of the upwards move labelled here intermediate wave (A) looks right for a new bull trend at the weekly chart level.
2. The downwards wave labelled intermediate wave (B) looks best as a three.
3. The small breach of the channel about cycle wave a on the weekly chart would be the first indication that cycle wave a is over and cycle wave b has begun.
Cons:
1. Within intermediate wave (3) of primary wave 5 (now off to the left of this chart), to see this as a five wave impulse requires either gross disproportion and lack of alternation between minor waves 2 and 4 or a very rare running flat which does not subdivide well. I have tried to see a solution for this movement, and no matter what variation I try it always has a major problem.
2. Intermediate wave (5) of primary wave 5 (now off to the left of the chart) has a count of seven which means either minor wave 3 or 5 looks like a three on the daily chart.
3. Expanding leading diagonals (of which intermediate wave (A) or (1) is) are are not very common (the contracting variety is more common).
4. Volume does not support this bull wave count.
For volume to clearly support the bull wave count it needs to show an increase beyond 187.34 (30th April) and preferably beyond 230.3 (9th April) for an up day. Only then would volume more clearly indicate a bullish breakout is more likely than a bearish breakout.
Within cycle wave b, primary wave A may be either a three or a five wave structure. So far within cycle wave b there is a 5-3 and an incomplete 5 up. This may be intermediate waves (A)-(B)-(C) for a zigzag for primary wave A, or may also be intermediate waves (1)-(2)-(3) for an impulse for primary wave A. At 1,320 intermediate wave (C) would reach equality in length with intermediate wave (A) and primary wave A would most likely be a zigzag. At 1,429 intermediate wave (3) would reach 1.618 the length of intermediate wave (1) and primary wave A would most likely be an incomplete impulse.
Intermediate wave (A) subdivides only as a five. I cannot see a solution where this movement subdivides as a three and meets all Elliott wave rules (with the sole exception of a very rare triple zigzag which does not look right). This means that intermediate wave (B) may not move beyond the start of intermediate wave (A) below 1,131.09. That is why 1,131.09 is final confirmation for the bear wave count at the daily and weekly chart level.
Intermediate wave (C) is likely to subdivide as an impulse to exhibit structural alternation with the leading diagonal of intermediate wave (A). This intermediate wave up may be intermediate wave (3) which may only subdivide as an impulse.
Minor wave 2 is over here. Minute wave c is just 2.7 longer than 1.618 the length of minute wave a. At 1,288 minor wave 3 would reach 1.618 the length of minor wave 1.
Within minor wave 3, no second wave correction may move beyond its start below 1,162.80.
A new high above 1,232.49 would eliminate the bear wave count and provide full confidence in the targets.
Hourly Bull Wave Count
Click chart to enlarge.
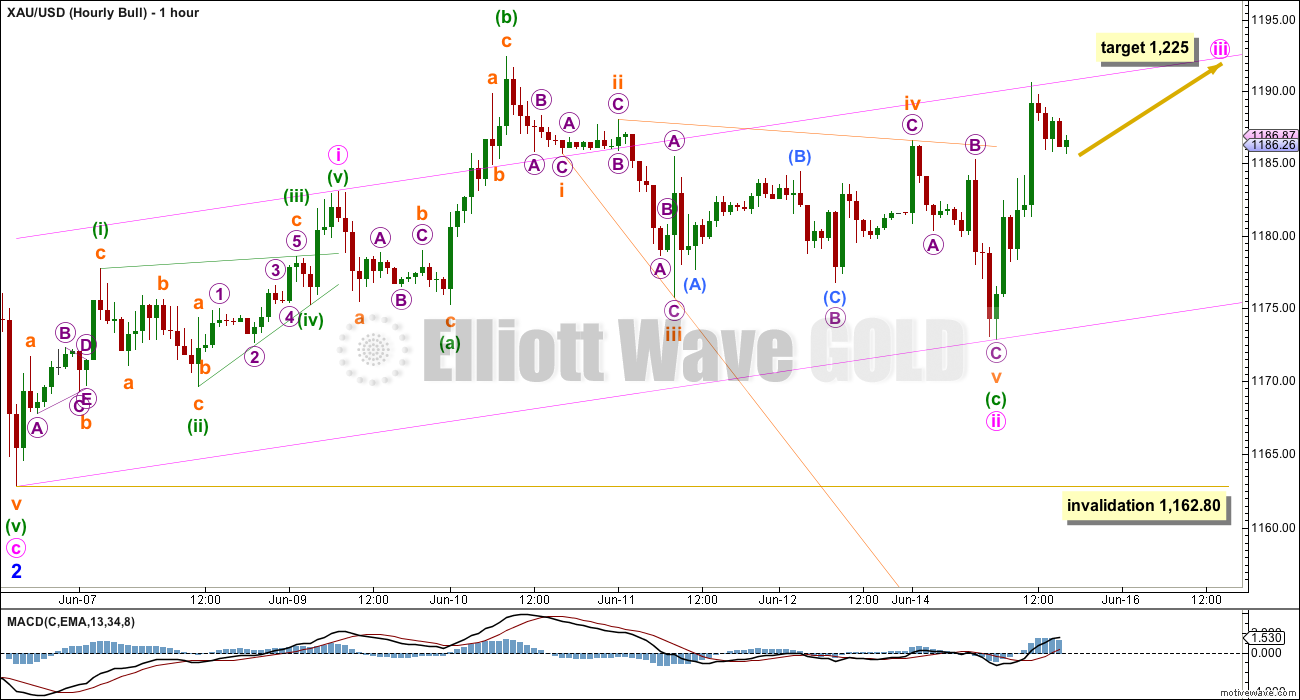
Minor wave 3 must begin with a five wave structure upwards. At this stage, this hourly wave count is the only solution I can see.
Minute wave i may have been a leading contracting diagonal, and minute wave ii may be a complete expanded flat.
The leading contracting diagonal of minute wave i fits all rules for this structure, but it does not have the right look. While contracting diagonals normally end with an overshoot of the 1-3 trend line by the fifth wave, this overshoot is far to big to look normal.
Within the expanded flat of minute wave ii, minuette wave (b) is 2.21 the length of minuette wave (a), a lot longer than the normal common length of up to 1.38 and a little longer than the normal maximum length of 2. However, I have in the past seen expanded flats with particularly long B waves. No rule is broken here (there is no rule stating a maximum length for a B wave within a flat) but the probability of a flat is low when the B wave is longer than twice the length of the A wave.
Minuette wave (c) is seen as an ending expanding diagonal. Within an ending diagonal, all sub waves must be zigzags and the fourth wave must overlap first wave price territory. These rules are met. However, within subminutte wave iv zigzag, micro wave C looks very strongly like a three wave structure when it should be a five. This further reduces the probability of this wave count.
At 1,225 minute wave iii would reach 2.618 the length of minute wave i.
For the bull, I will leave the invalidation point down at 1,162.80. If minute wave ii continues lower, then it may not move beyond the start of minute wave i.
Bear Wave Count
Click chart to enlarge.
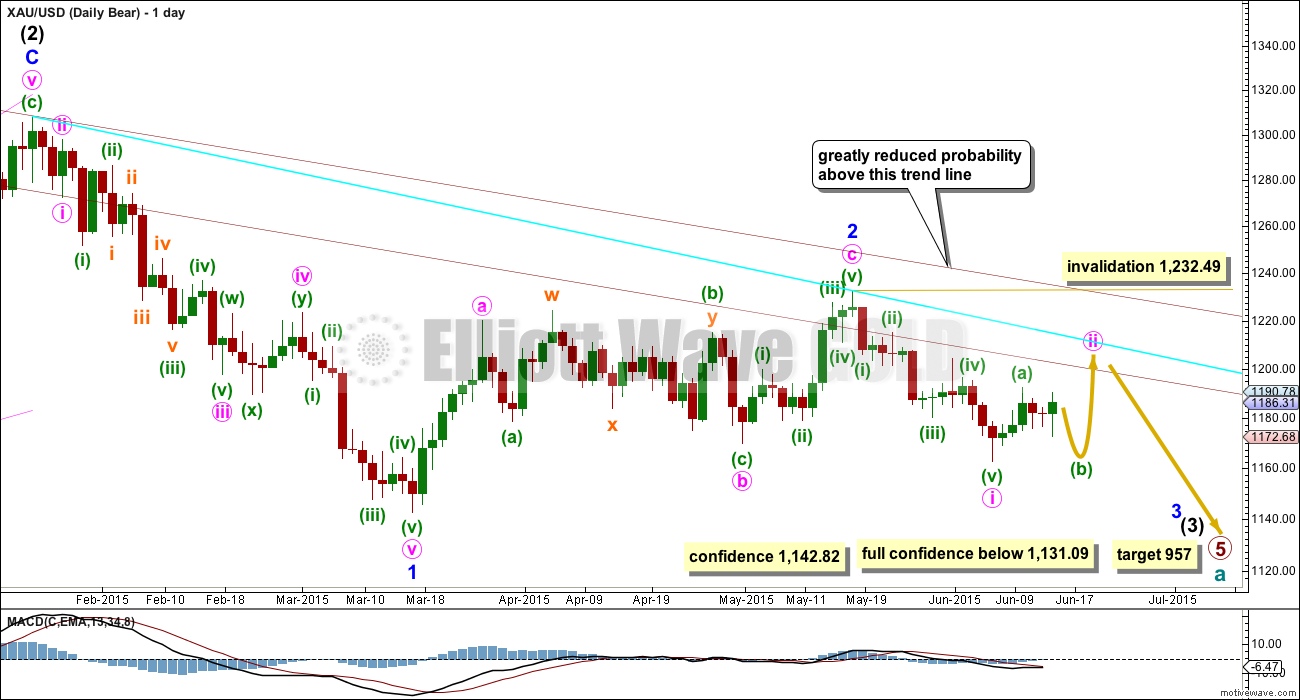
This wave count follows the bear weekly count which sees primary wave 5 within cycle wave a as incomplete. At 957 primary wave 5 would reach equality in length with primary wave 1.
Pros:
1. Intermediate wave (1) (to the left of this chart) subdivides perfectly as a five wave impulse with good Fibonacci ratios in price and time. There is perfect alternation and proportion between minor waves 2 and 4. For this piece of movement, the bear wave count has a much better fit than the bull wave count.
2. Intermediate wave (2) is a very common expanded flat correction. This sees minor wave C an ending expanding diagonal which is more common than a leading expanding diagonal.
3. Minor wave B within the expanded flat subdivides perfectly as a zigzag.
4. Volume at the weekly and daily chart continues to favour the bear wave count. Since price entered the sideways movement on 27th March it is a downwards week which has strongest volume, and it is downwards days which have strongest volume.
5. On Balance Volume on the weekly chart recently breached a trend line from back to December 2013. This is another bearish indicator.
Cons:
1. Intermediate wave (2) looks too big on the weekly chart.
2. Intermediate wave (2) has breached the channel from the weekly chart which contains cycle wave a.
3. Minor wave 2 is much longer in duration than a minor degree correction within an intermediate impulse normally is for Gold. Normally a minor degree second wave within a third wave should last only about 20 days maximum. This one is 44 days long.
4. Within minor wave 1 down, there is gross disproportion between minute waves iv and ii: minute wave iv is more than 13 times the duration of minute wave i, giving this downwards wave a three wave look.
Minor waves 1 and 2 are complete. Minute wave i within minor wave 3 may be incomplete on the hourly chart.
Minute wave ii may not move beyond the start of minute wave i above 1,232.49.
A new low below 1,142.82 would provide a lot of confidence in this bear wave count. At that stage, the bull wave count may not be continuing its second wave correction. But only a new low below 1,131.09 would invalidate any variation of a bull wave count and provide full and final confirmation for a bear wave count.
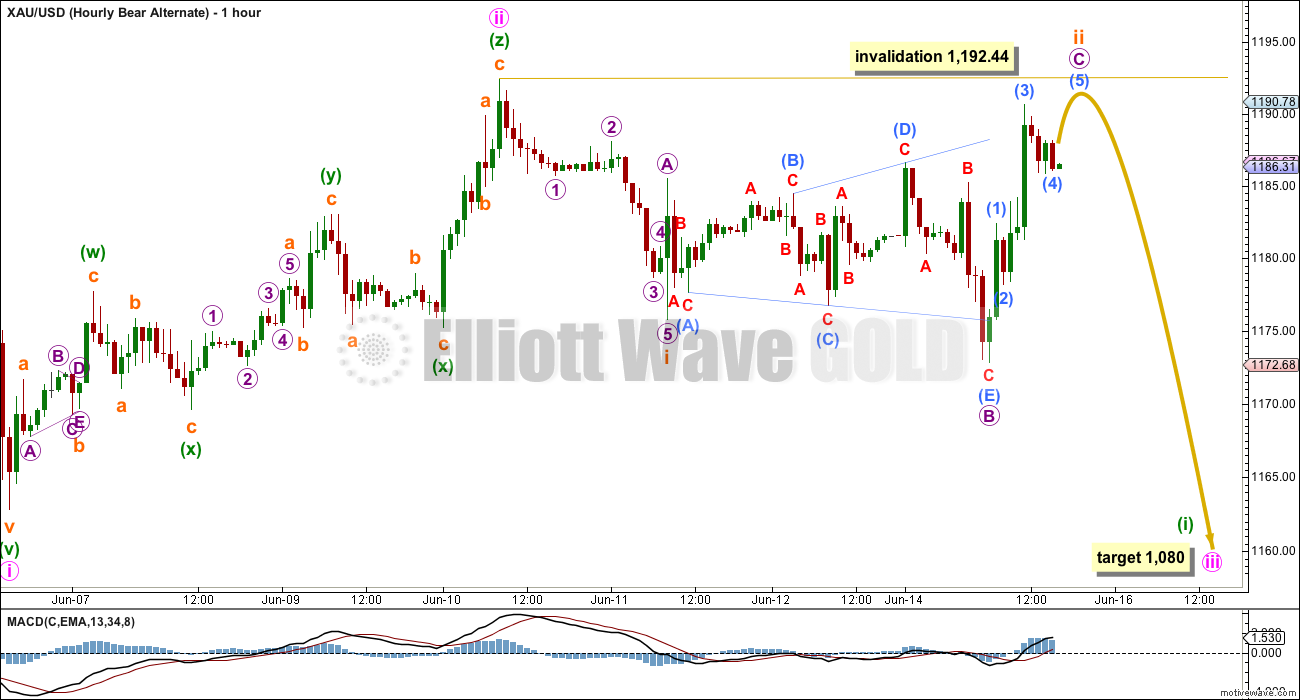
Main Hourly Bear Wave Count
Click chart to enlarge.
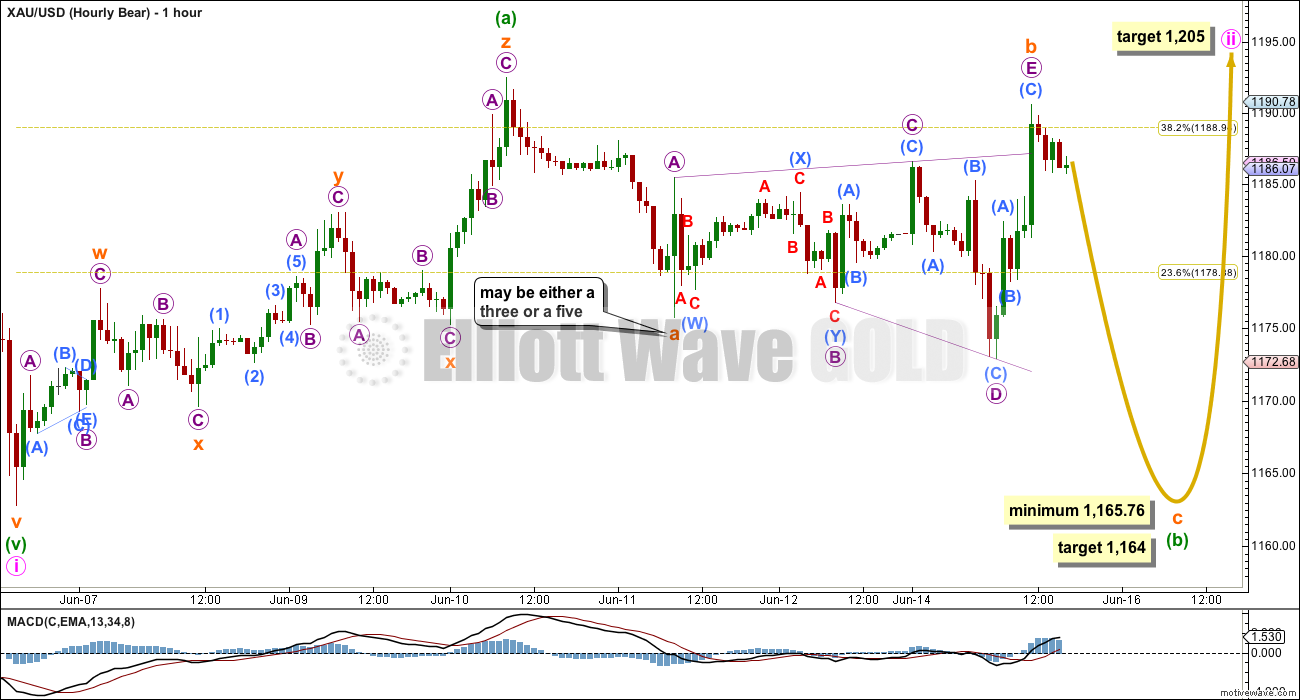
It is very likely that minute wave ii is not over.
Within it, minuette wave (a) is a “three”, a rare triple zigzag, which his means minute wave ii is a flat correction (when the A wave subdivides as a three that indicates a flat is unfolding).
Within the flat correction, minuette wave (b) must retrace a minimum 90% of minuette wave (a) at 1,165.76. Minuette wave (b) may make a new price extreme beyond the start of minuette wave (a) below 1,162.80.
Minuette wave (b) may be any type of more than 13 possible corrective structures. Of all Elliott waves, it is B waves which exhibit the greatest variety in form from quick sharp zigzags to time consuming complicated combinations.
Within minuette wave (b), subminuette wave a will subdivide either as a three or a five. For this reason I am removing the upper invalidation point today. Minuette wave (b) may be an expanded flat, and so subminuette wave b may make a new high above the start of subminuette wave a at 1,192.44 and still be valid.
Subminuette wave b fits perfectly as a very rare expanding triangle, the rarest of all Elliott wave structures. All the sub waves of the triangle are single or double zigzags, and only one is a double zigzag (micro wave B). The end of each sub wave moves beyond the end of the prior wave in the same direction.
If subminuette wave b is an expanding triangle, then it is complete with micro wave E a complete zigzag. At 1,164 subminuette wave c would reach 1.618 the length of subminuette wave a. Subminuette wave c must subdivide as a five wave structure.
In the short term, if price continues a little higher, then subminuette wave b may be relabelled with subdivisions the same as subminuette wave ii for the alternate below. That would still expect subminuette wave c to move lower to at least 1,165.76.
In the short term, a new low below 1,182.42 would indicate that micro wave E is a complete zigzag and that wave is over, and then subminuette wave c down may be expected to be underway. A new low below 1,182.42 in the short term may not be a fourth wave correction within a continuing five wave structure upwards (as per the hourly alternate below).
Alternate Hourly Bear Wave Count
Click chart to enlarge.
It is also possible that minute wave ii is over as a triple zigzag.
If minute wave ii is over, then the first wave down within minute wave iii must subdivide as a five wave structure. Subminuette wave i may be seen as a five.
Subminuette wave ii may be an almost complete expanded flat correction. The subdivisions all fit, but not quite as well as that seen for the main bear hourly count.
A second wave correction may not subdivide into a triangle as the sole corrective structure. There is a triangle in that movement, and it may be the B wave of an expanded flat correction.
Subminuette wave ii may be an expanded flat subdividing 3-3-5. Micro wave C would be an incomplete five wave structure, requiring the final fifth wave up to complete. Thereafter, subminuette wave iii downwards should begin to show a strong increase in downwards momentum.
Subminuette wave ii may not move beyond the start of subminuette wave i above 1,192.44.
Technical Analysis
Click chart to enlarge.
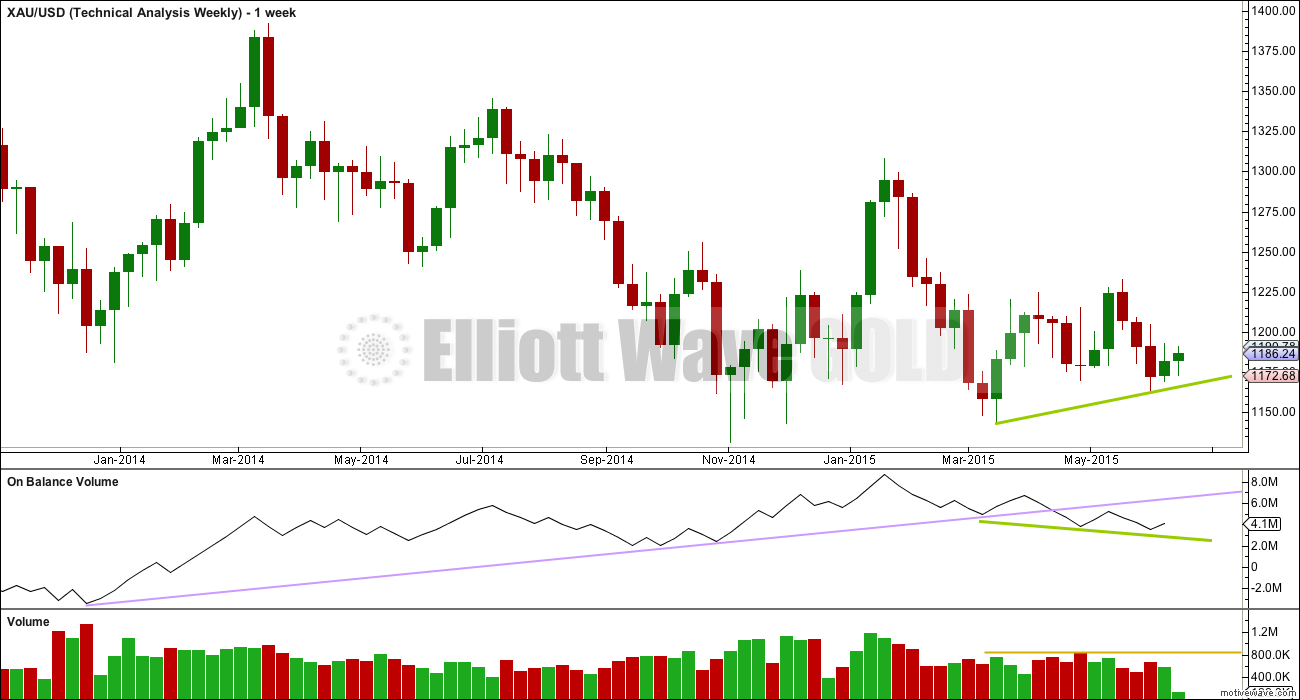
Weekly Chart: Overall volume still favours a downwards breakout eventually. During this sideways movement, it is still down days and a down week which have higher volume. On Balance Volume breaches a trend line (lilac line) which began in December 2013, and the breach is significant.
While price has made higher lows, On Balance Volume has made lower lows (green trend lines). This small rise in price is not supported by volume, and it is suspicious.
Click chart to enlarge.
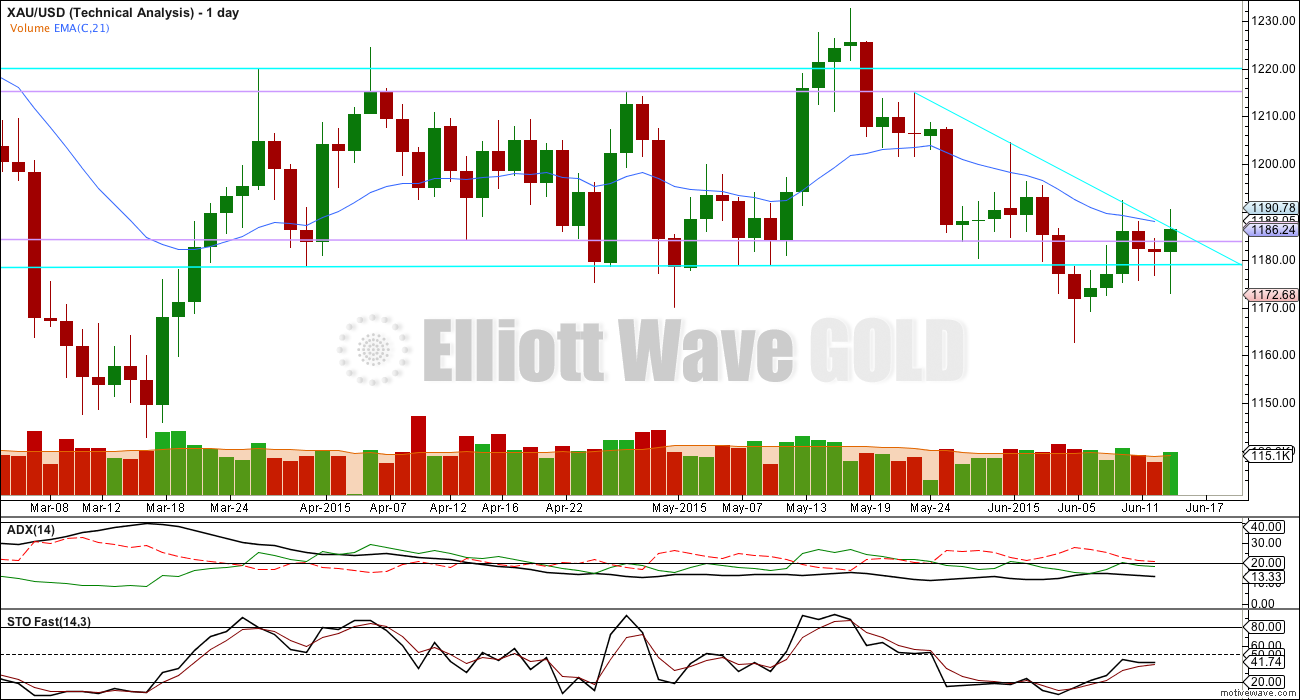
Daily Chart: ADX is declining and below 15. This strongly indicates there is no clear trend. Gold remains within a sideways consolidation phase it began back on 27th March, price is again within the horizontal lines of support and resistance. A range bound system should be employed as opposed to a trend following system for trading.
The range bound system illustrated here uses horizontal lines of support and resistance in conjunction with fast Stochastics to indicate the end of each swing and the start of the next swing. It is not perfectly accurate, price has and will again break above and below the outer blue trend lines before returning to the range between them. And this perfectly illustrates why a range bound market is more risky to trade than a trending market; it is impossible to tell exactly where one swing will end and the next will begin, when price swings above and below support and resistance only to then return to the range substantial losses may be incurred. It is vital to keep stops reasonable and exercise patience in this market. Sometimes the trades you don’t take make the difference between profit and loss. Good money management rules are essential to prevent wiping out your account in this type of market.
Upwards movement for Monday has overshot the downwards sloping trend line which has previously provided resistance. This resistance may be giving way, the next upward swing may begin from here.
A note about the morning doji star formed by the last three daily candlesticks: this pattern should be ignored in this instance because it has very clearly not come at the end of a downtrend. It is not an indication here of a trend change to the upside.
Volume continues to favour a bearish breakout, when the breakout eventually comes. Since 27th March it is downwards days which have the strongest volume. This does not always work, it is not definitive. It is a bearish indication, another small piece of information to take into account.
This analysis is published about 06:08 p.m. EST.
Here …
Despite ratio problems I’m Still going with my triangle idea and still making money. Here is my rough chart. Beware of thrust out of triangle…
Jaf…
I think gold may go sideways or down until.
FED FOMC news Wednesday 2 pm EST, then I will follow the gold trend and buy right away.
Whichever way one looks at it, the bulls ought not to get past 1190-91 and the bears need to see a break below 1175…. A break below 1158-57 will really seal the deal for the shorts and sink the bulls lol… A break below 1162-61 would also do for starters but I would watch the downside with the lower band at 1166-65….. Looking forward to Lara’s update / analysis to get an idea of where Gold price stands in this maze~! //// Bearish Gold as long as price is below 100dma/200dma on closing basis.
GDX closed the gap from April 1st. GDX positive MFI divergence over the past 2 weeks.
Ben, these are indicators but what do you conclude they indicate–is GDX headed up or down?
I am positioned for a move up, I am following the bear hourly. Gold may drop down to 1165 but I’m not going to try to time that, it may be a 30 spike on fed announcement.
Ben, you mentioned “positive MFI divergence” is that bullish or bearish GDX?
Bullish divergence.
I realize this is a risky trade, it’s not much of my portfolio. I’m willing to lose the profit I have as I am evaluating a different way to trade using my toolbox. But, I like the bear wave hourly and upside coming soon.
We got to $12 of the target, it looks like this move is still going at the smaller waves. Miners lead (usually), I will be finishing off my long position today or tomorrow morning.
Took profits on TMF yesterday. Long TNA in premarket.
I have it with a five down complete, which would be a first wave within an impulse for the C wave. The main bear hourly wave count looks the best still, it has the best fit.
Fantastic, thanks for the update.
Closed my TNA for a little over 3%. Might get back into bonds. Lara, do you provide any bond analysis? I’d love some EW perspective on the US 30 year treasury.
How about mail Hour bull count??? Still in play to 1225. Invalidation is below 1162.
Yes hourly bull still valid. It just needs to rally eventually.
Looks like the alternate hourly bear has been invalidated with a move below the end of submicro wave 1 without making a new high first. Main hourly bear is now in play. Expect high volatility.
I’m going to discard that wave count today. This does not look like the start of a third wave down.
It doesn’t look like the start of a 3rd wave up either….what’s the elliott wave count for gold going sideways for the next 6 months (lol)…