
Again upwards movement was unexpected for the bear Elliott wave count, but for the bull Elliott wave count the target was met.
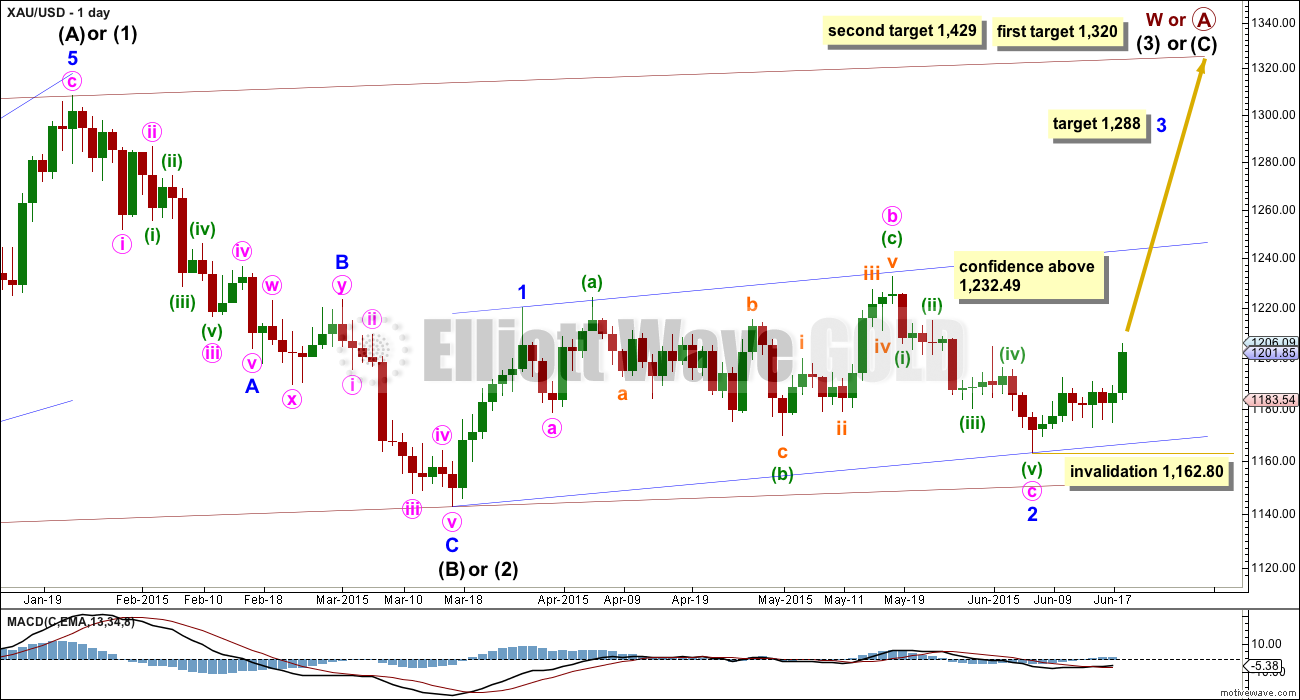
Summary: Both bull and bear wave counts expect downwards movement from here. The bear wave count expects the middle of a third wave down to start, and its target is at 1,093. The bull wave count expects a deep second wave correction to move below 1,180. The invalidation / confirmation point is at 1,162.80. A new low below that point in the next few days would strongly favour the bear wave count. If price does not move below 1,162.80 in the next few days the bull wave count would be favoured.
To see the bigger picture and weekly charts go here.
Changes to last analysis are italicised.
Bull Wave Count
Click chart to enlarge.
The bull wave count sees primary wave 5 and so cycle wave a a complete five wave impulse on the weekly chart.
Pros:
1. The size of the upwards move labelled here intermediate wave (A) looks right for a new bull trend at the weekly chart level.
2. The downwards wave labelled intermediate wave (B) looks best as a three.
3. The small breach of the channel about cycle wave a on the weekly chart would be the first indication that cycle wave a is over and cycle wave b has begun.
Cons:
1. Within intermediate wave (3) of primary wave 5 (now off to the left of this chart), to see this as a five wave impulse requires either gross disproportion and lack of alternation between minor waves 2 and 4 or a very rare running flat which does not subdivide well. I have tried to see a solution for this movement, and no matter what variation I try it always has a major problem.
2. Intermediate wave (5) of primary wave 5 (now off to the left of the chart) has a count of seven which means either minor wave 3 or 5 looks like a three on the daily chart.
3. Expanding leading diagonals (of which intermediate wave (A) or (1) is) are are not very common (the contracting variety is more common).
4. Volume does not support this bull wave count.
For volume to clearly support the bull wave count it needs to show an increase beyond 187.34 (30th April) and preferably beyond 230.3 (9th April) for an up day. Only then would volume more clearly indicate a bullish breakout is more likely than a bearish breakout.
Within cycle wave b, primary wave A may be either a three or a five wave structure. So far within cycle wave b there is a 5-3 and an incomplete 5 up. This may be intermediate waves (A)-(B)-(C) for a zigzag for primary wave A, or may also be intermediate waves (1)-(2)-(3) for an impulse for primary wave A. At 1,320 intermediate wave (C) would reach equality in length with intermediate wave (A) and primary wave A would most likely be a zigzag. At 1,429 intermediate wave (3) would reach 1.618 the length of intermediate wave (1) and primary wave A would most likely be an incomplete impulse.
Intermediate wave (A) subdivides only as a five. I cannot see a solution where this movement subdivides as a three and meets all Elliott wave rules (with the sole exception of a very rare triple zigzag which does not look right). This means that intermediate wave (B) may not move beyond the start of intermediate wave (A) below 1,131.09. That is why 1,131.09 is final confirmation for the bear wave count at the daily and weekly chart level.
Intermediate wave (C) is likely to subdivide as an impulse to exhibit structural alternation with the leading diagonal of intermediate wave (A). This intermediate wave up may be intermediate wave (3) which may only subdivide as an impulse.
Minor wave 2 is over here. Minute wave c is just 2.7 longer than 1.618 the length of minute wave a. At 1,288 minor wave 3 would reach 1.618 the length of minor wave 1.
Within minor wave 3, no second wave correction may move beyond its start below 1,162.80.
A new high above 1,232.49 would eliminate the bear wave count and provide full confidence in the targets.
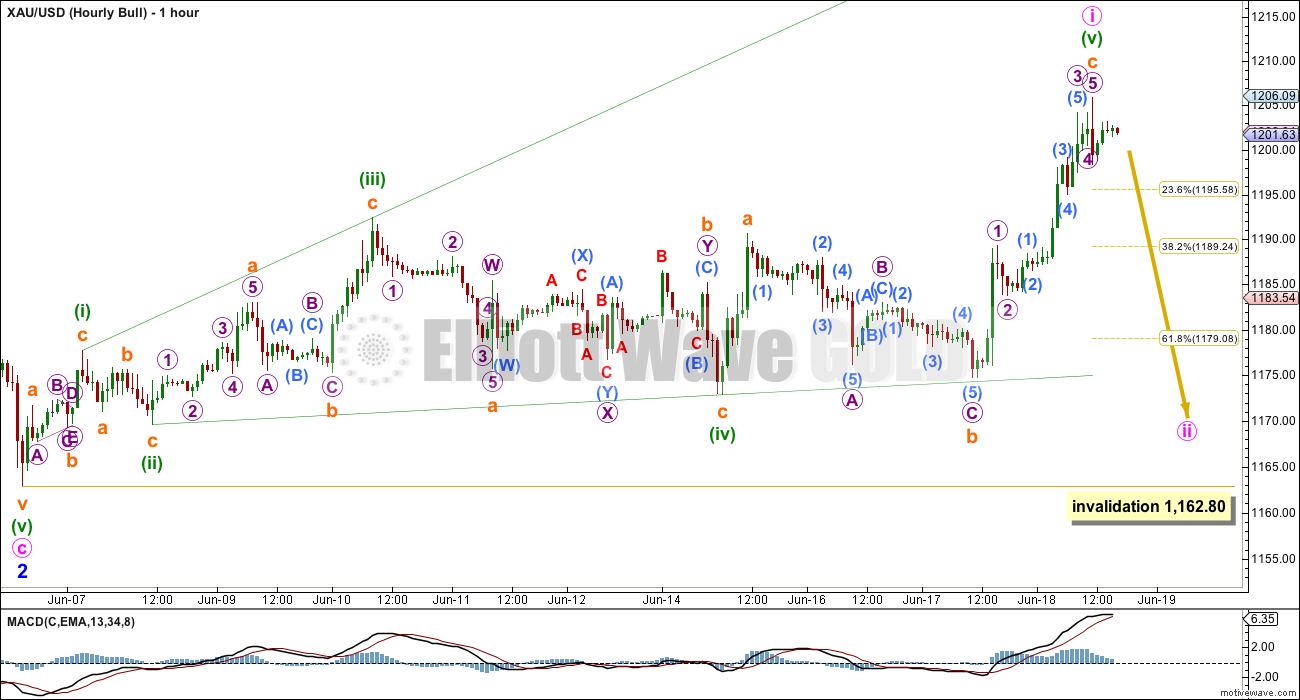
Hourly Bull Wave Count
Click chart to enlarge.
Minute wave i must subdivide as a five wave structure, either an impulse or a leading diagonal. Leading diagonals are most commonly contracting, with the expanding variety not so common. This rarity reduces the probability of this wave count.
Leading diagonals require the second and fourth waves to subdivide as zigzags, and the fourth wave must overlap first wave price territory, which this one does. The first, third and fifth waves are also most often zigzags.
The most common depth of second and fourth waves within diagonals is between 0.66 to 0.81 the prior wave. Here minuettte wave (ii) is 0.54 and minuette wave (iv) is 0.86. Neither are within normal range further slightly reducing the probability of this wave count.
Within minuette wave (iv) zigzag, subminuette wave b is labelled as a double zigzag, but it has an atypical look. This structure moves sideways, whereas double zigzags should have a clear slope against the main trend and not a sideways look.
Minuette wave (v) is now a complete zigzag, and within it subminuette wave c is a complete five wave impulse. I have checked the subdivisions for this wave carefully on the five minute chart and it can be seen as complete.
Second wave corrections following leading diagonals in first wave positions are often very deep. Minute wave ii should be expected to be very deep, likely deeper than the 0.618 Fibonacci ratio at 1,180.
Minute wave ii may not move beyond the start of minute wave i below 1,162.80.
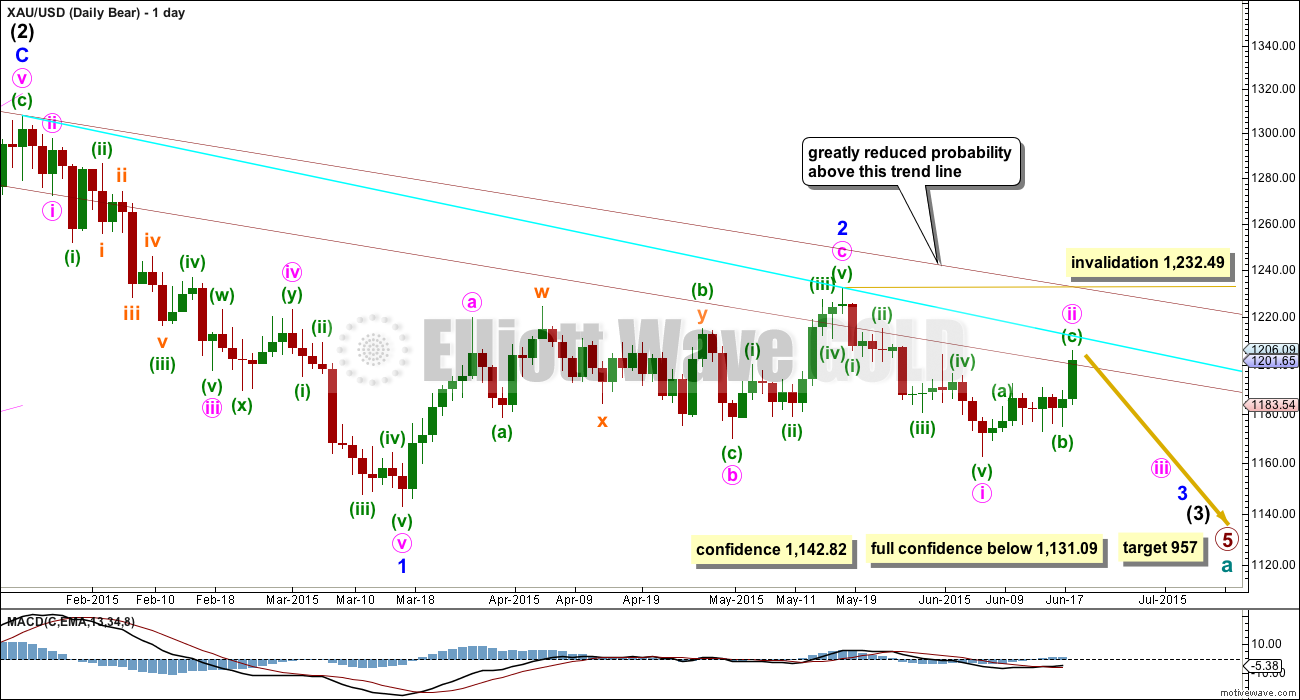
Bear Wave Count
Click chart to enlarge.
This wave count follows the bear weekly count which sees primary wave 5 within cycle wave a as incomplete. At 957 primary wave 5 would reach equality in length with primary wave 1.
Pros:
1. Intermediate wave (1) (to the left of this chart) subdivides perfectly as a five wave impulse with good Fibonacci ratios in price and time. There is perfect alternation and proportion between minor waves 2 and 4. For this piece of movement, the bear wave count has a much better fit than the bull wave count.
2. Intermediate wave (2) is a very common expanded flat correction. This sees minor wave C an ending expanding diagonal which is more common than a leading expanding diagonal.
3. Minor wave B within the expanded flat subdivides perfectly as a zigzag.
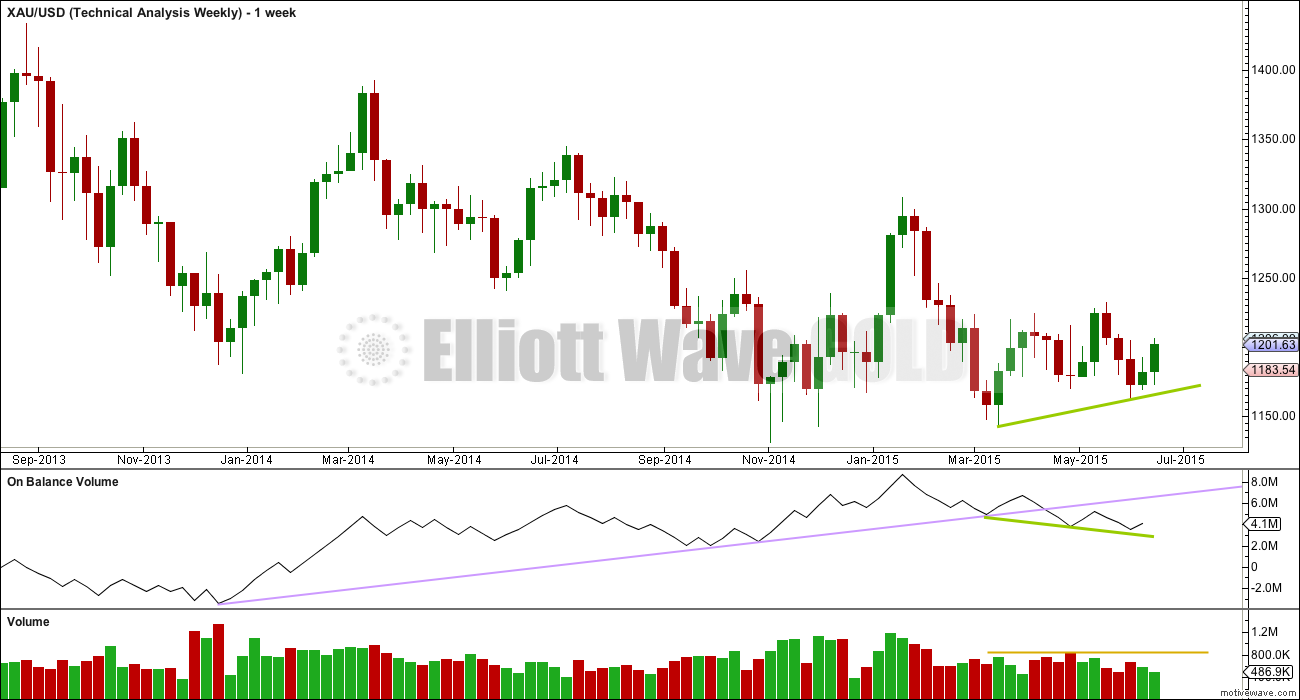
4. Volume at the weekly and daily chart continues to favour the bear wave count. Since price entered the sideways movement on 27th March it is a downwards week which has strongest volume, and it is downwards days which have strongest volume, five of them.
5. On Balance Volume on the weekly chart recently breached a trend line from back to December 2013. This is another bearish indicator.
Cons:
1. Intermediate wave (2) looks too big on the weekly chart.
2. Intermediate wave (2) has breached the channel from the weekly chart which contains cycle wave a.
3. Minor wave 2 is much longer in duration than a minor degree correction within an intermediate impulse normally is for Gold. Normally a minor degree second wave within a third wave should last only about 20 days maximum. This one is 44 days long.
4. Within minor wave 1 down, there is gross disproportion between minute waves iv and ii: minute wave iv is more than 13 times the duration of minute wave i, giving this downwards wave a three wave look.
Minor waves 1 and 2 are complete. Minute wave i within minor wave 3 may be incomplete on the hourly chart.
Minute wave ii may not move beyond the start of minute wave i above 1,232.49.
At this stage, a new low below 1,162.80 would provide a lot of confidence in the bear wave count. Further confidence would come with a new low below 1,142.82 and final confidence would come only with a new low below 1,131.09.
Minute wave ii is now very likely to be over here. If it moves any higher, then it should find strong resistance at the blue trend line.
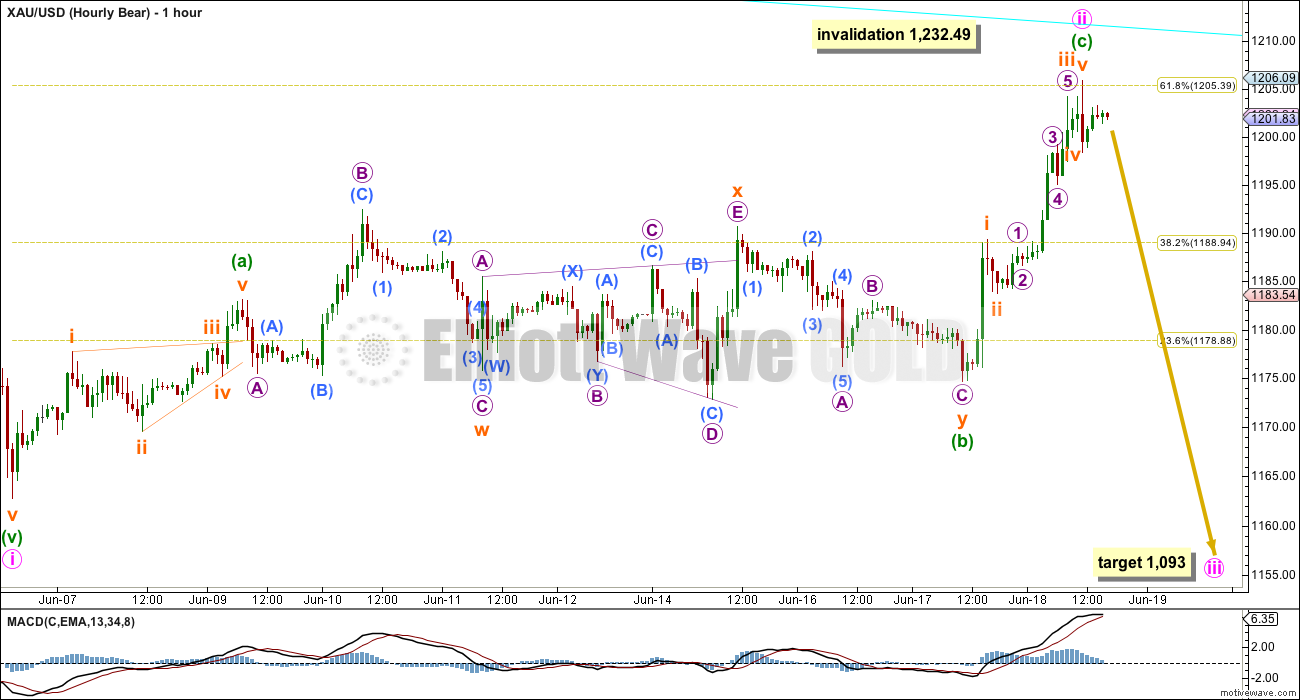
Hourly Bear Wave Count
Click chart to enlarge.
Upwards movement is too high and strong to be an X wave within a combination. It would not break any Elliott wave rules, but it does not have the right look at all.
At the daily chart level, it looks like there is a clear three up which may have ended at the 0.618 Fibonacci ratio of minute wave i.
At the hourly chart level, the subdivisions can fit as a zigzag only if the possible triple zigzag for minuette wave (a) is ignored. If minuette wave (a) was a leading contracting diagonal, then it does not have a typical look: the fifth wave of the diagonal is a bigger overshoot than is normal of the i-iii trend line.
Minuette wave (b) is a combination: flat – X (expanding triangle) – zigzag. It has a typical sideways look for a combination, and this is where a B wave looks to have unfolded on the daily chart. The flat for subminuette wave w though is a rare running flat, the second problem with this wave count at the hourly chart level. The subdivisions all fit perfectly, but the rarity of a running flat must reduce the probability of this wave count.
Minuette wave (c) is 1.58 short of 1.618 the length of minuette wave (a).
If this wave count is correct, then a very strong third wave down should begin from here.
Technical Analysis
Click chart to enlarge.
Weekly Chart: Overall volume still favours a downwards breakout eventually. During this sideways movement, it is still down days and a down week which have higher volume. On Balance Volume breaches a trend line (lilac line) which began in December 2013, and the breach is significant.
While price has made higher lows, On Balance Volume has made lower lows (green trend lines). This small rise in price is not supported by volume, and it is suspicious.
Click chart to enlarge.
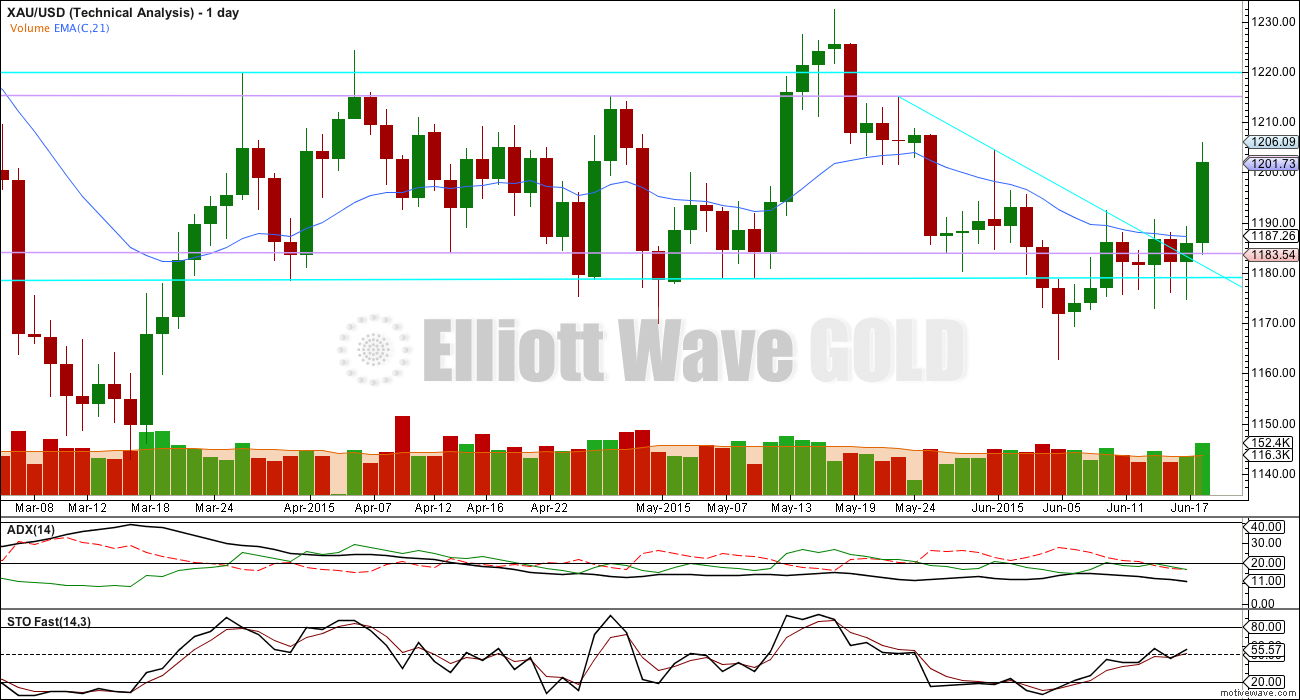
Daily Chart: ADX still strongly indicates there is no clear trend. A range bound system should be employed. With price now fully above the downwards sloping blue trend line, which recently provided resistance, this approach would expect a continuation of upwards movement to the upper horizontal trend lines and for Stochastics to again reach overbought.
This range bound system diverges very strongly now from both Elliott wave counts. I will leave it up to members to use their own preferred analysis methods to supplement this Elliott wave analysis, and to make your own judgements. Only when price breaks above 1,232.49 or below 1,162.80 will we finally have confirmation that a breakout has occurred and will we know what direction it is in.
Volume continues to indicate a downwards breakout may be more likely than upwards, but this does not always work. Volume is an indicator, is not definitive, but is another piece of information to consider.
Within the sideways range, it is six days which have strongest volume and they are all down days: 9th April 230.3k, 30th April 187.8k, 29th April 181.8k, 16th April, 176.9k, 14th April 171.5k. The strongest up day had 171.1k on 13th May.
This analysis is published about 05:58 p.m. EST.
Please excuse me, for making errror on H4 Period chart.
http://upic.me/i/hg/1screenshot_1.png
Since I’d sent you some charts.
Now, these are my update charts for GOLD.
http://upic.me/i/q6/2screenshot_1.png Month Period.
http://upic.me/i/gc/0screenshot_1.png Week Period.
There are 3 reversal patterns on week period,
1. Falling Wedge http://upic.me/i/gc/0screenshot_1.png
2. Broadening Botttom http://upic.me/i/u0/0screenshot_1.png
3. Inverse Head and Shoulders http://upic.me/i/2s/0screenshot_1.png
http://upic.me/i/kt/0screenshot_1.png Day period.
As you can see, w(a)/5 in Ending Diagonal is five wave pattern, So W5 is Zigzag 5-3-5
Thus w(b) can rebound only 61.8% of w(a),
In which W(b) is formed Expanding Triangle.
http://upic.me/i/kt/0screenshot_1.png H4 Period.
You can see the same Correction as Day Period,
w(a) of (D) is the five wave pattern and w(b) is Expanding Triangle,
which already rebouned 61.8% 0f w(a)
http://upic.me/i/td/0screenshot_1.png H1 Period.
The chart showed the forming of w(b) of (D)
http://upic.me/i/t3/1screenshot_1.png M5 Period.
As the M5 period, you can see the (Expanding) Ending Diagonal.
Ending Diagonal occures on the W5 or C-wave.
As referance : http://upic.me/i/t3/1screenshot_1.png
http://www.elliottwave.com/freeupdates/archives/2011/03/10/Ending-Diagonal-Elliott-Wave-Pattern-in-Cocoa-Start-of-an-Opportunity.aspx#axzz3d25Hdhvg
http://upic.me/i/t3/1screenshot_1.png M30 Period.
” when they end, prices tend to retrace the entire pattern, or more, and fast — in 1/3 to 1/2 the time it took the pattern to form.”
And Now, there is Descending Triangle forming.
I wonder why miners got whacked down so badly today. I haven’t traded for a couple of days and just for thrills bought some DUST at the first high of gold when the market opened today, at 15.00, aiming to close the position at the end of the day. At 3:30 pm, gold barely crawled down 3 bucks but DUST gained slightly more than a dollar. Gold dropped 0.21% but DUST gained more than 7%. I don’t recall having experienced such an anomaly before. Without hesitation, I cashed out at 15.98. This spike may mean that DUST could move in tandem with gold early next week, both down. Don’t want to push my luck too far. Have a wonderful weekend, guys (and ladies).
DUST went up a lot because from 1:30 pm with gold at 1202.61 then Gold proceeded to drop for 2 hours and 15 minutes down to 1200.29 at 3:45 pm except for 2 very brief increases of 50 cents. GDX went up 4% last 2 days and since today gold switched to slow downward momentum for hours GDX went down and DUST gradually kept going up. Extended downward momentum in miners has a compounding effect drawing many more sellers. So ‘IF’ gold continues to drop early next week DUST will continue to go UP, UP, UP because DUST a bear 3X ETF goes up when GDX goes down. Congratulations on your quick and profitable intraday DUST trade. I also made profits on DUST today although I sold it earlier and lower than you.
I made the same trade, however I sold at 15.85. a 50% retracement which I’ve found common after Big down days in DUST. There is also big volume in NUGT after hours which usually means a trend change. But I’m not sure what the trend is, I would not call the one day spike in NUGT yesterday a trend? Dust has been on the rise for over a month from low of$11.10 . All that is obvious is that traders are positioning for a move
Also when the market has a bad day minning stock are pulled down with it , regardless of the price of gold.
Thank you so much for the enlightening explanation. I’m so glad that you had also profited from trading DUST.
COT is pretty bullish on Silver, and open interest is up 3,000 contracts since Tuesday. I added a small USLV position this morning, and a small position in TMF as well . I updated a COT chart I look at. Just a reminder, I only look at Swap and MM positions, and the reason I look at total divergence over 10 weeks is to see if I can spot significant commitment of capital in one way or another. Looking at this chart and the data behind it, I have a hard time seeing how gold can drop much lower in the short term. To get there, the Swaps would have to let the Money Managers be in a pretty decent profit position in silver and gold, which historically hasn’t been happening.
Have a great weekend everyone.
Jaf: you’re seeing a zigzag unfolding upwards from the last swing low at 1,162.
Which is the same as my zigzag upwards for minute wave ii on the bear wave count.
How did you get A of that zigzag to unfold? Where do you see it ending and what EW structure do you see it as?
As answered below
NEXT WEEK’S U.S. ECONOMIC REPORTS
starts with this week then below is next week.
http://www.marketwatch.com/Economy-Politics/Calendars/Economic
Thanks Richard,
Wednesday’s GDP report works well with this idea. The news may be exactly what we need for this idea to work. It can be the catalyst behind the thrust passed “D” of the triangle which will be full confirmation
Greece could affect Euro and $USD soon which could be a trigger.
Here is the big picture for this idea
Right now it looks a lot more like we are in wave iv of 1 up of C
You have intermediate wave (A) within your primary wave 4 triangle labelled as a zigzag.
Have you checked that the subdivisions fit 5-3-5? Can you get that to work and meet all EW rules?
Because I’ve tried that and I can’t get it to work. Which doesn’t mean it won’t work, just that I can’t make it work.
Oh I see what you’re saying. going by memory I worked the entire “A” leg of triangle into a 5/3/5 zig zag. I’ll check after midnight tonight. But I’m pretty sure my ratios were decent
I was asking about this and the other too. I have two questions on your wave count today, one for intermediate wave (A) (this question) and another for minor wave A.
I’ve tried to see it subdividing as a zigzag and I couldn’t get it to work. Specifically, the problem was within the A wave of the zigzag. It looks like a leading contracting diagonal, but the wave lengths of that possible diagonal don’t meet the rules for wave lengths of a contracting diagonal. The third wave should be shorter than the first (it is) and the fifth wave should be shorter than the third (it isn’t).
That was my problem. So I’m wanting to see if you managed to resolve it and how.
Here is close up of gold nearing E
I appreciate the effort but still small for me to read.
try to open in new window?
not much more I can do …
All these charts can be opened in a new window. Control +click (but thats a Mac).
Then increase the size of that window until you can read it.
We are working on a lightbox for charts within comments. It’s on the list.
John when I clicked on your link it opened up and your chart is beautiful a work of art filled with goodies. It fills slightly more than my 24″ monitor but I can slide the bottom toggle to see the sides. I can read all the numbers. Luckily I can read very fine print. I take it that you are Bullish. Good luck.
Just after I posted this comment your chart doesn’t have a link and so I now have to use google enlarge up to 300% and is a bit blurry but I can still make out the numbers. The link did open much clearer. I don’t know why link disappeared?
Bearish… After E its down….
below 1000pog
This is a pivotal moment in my opinion. Its a very big move based on this idea.
Pink V, Blue C, and Black E is all one point.. I just spread them out so that you can see their fib retracements individually but they are the same target. This all makes maroon 4. and thus 5 down is very big. In other words, after E is complete we dive into Primary 5
After E dive into Primary 5. So you still have gold in Primary 4. What is your bottom target for Primary 5?
Richard. I can work out a wave 5 target tonight as an approximation but it will be revised as we learn from its developing substructure. Put it this way… You’re going to make more money in the next few months than you thought was possible. GDx is raring to drop as many of you experienced today. At what risk? 10-15 pog loss? It doesn’t get better than this
John, having trouble reading numbers on your chart , would you post number that is your E target ? Just post E number?
Broad target range is from 1210 to 1227. I’m leaning toward 1218 to 1220.
…So with 1232.49 the invalidation point ( which is C of this triangle) we only have a $10 pog risk to reward.
I’m really curious; how did you resolve the structure of minor A? (it’s just off to the left of this chart). That would be the wave up from the last swing low at 1,162.
I worked it out as a zig zag. Not in front of my screens at the moment but I’ll Zoom in on it when I’m back home and post
Thanks Jaf.
If it’s a zigzag then the structure cannot be a zigzag, it must be a flat correction.
When A subdivides as a three then a flat is unfolding.
Which means B must retrace a minimum 90% of A. But this one does not. Which means the labelling would be invalid.
See Frost and Prechter “Elliott Wave Principle” page 89 for rules on zigzags and flats.
Again, I’m going by memory and through my small iPhone. Are you saying “a” of the triangle can’t be a zig zag? Will check my sub waves tonight
I’m saying you’re labelling a zigzag 3-3-5.
That’s not a zigzag, that’s a flat correction.
A zigzag must have the A wave as a five wave structure, not a three.
A zigzag subdivides 5-3-5.
And when you start to resolve that you’ll find my problem I’ve had this week. That A wave fits best as a three. Which indicates a flat. Which indicates a B wave that should follow it and be 90% of the A wave.
Any wave count anyone?
I’m thinking gold may drop any minute now as just retraced backup?
Hi Richard. Just a view: Assuming Gold price topped at 1205.70 H as per wave count complete by making an up move of about $21-22 on Thursday; the 61.8% of this $21-22 is about $13-14. Thus, 1205.70 less $13-14 would require for Gold price to break below 1193-92 to bring it in the bear camp. Thereafter, gold price could likely stall at support 1188-86 with 1182 below there. Initially Gold price needs to get below 1198/pivot at 1196 which it has not done so far. There is some upside risk for a takeout of 1205-06 for 1209-10….//// In my estimation Gold price is looking to top soon.
Another look at the confusing signals between gold and miners.
http://www.talkmarkets.com/content/commodities/which-of-these-charts-is-right?post=67198
Can you guys see this gdx chart?
I really cant get it any better… I know it worked on the previous system
Jaf
It’s on the list to have charts uploaded in comments open in a new window when clicked on.
cool…
Jaf, thanks for the GDX chart. Gold chart was much easier to read once enlarged. Sounds like Lara is aware of the issue. Anyway, I get the jest of it. Having trouble trying to reconcile Gold and GDX. Your Gold count shows a possible imminent downward move out of the triangle, but GDX looks like it might need a couple of weeks to finish it’s triangle? Not saying either one is wrong, just trying to make sense of it. I would think if Gold breaks down, that GDX would break down ASAP also. Any thoughts? Bob
Exactly Bob, you’re correct. I’m gauging gold with momentum and this move has been pretty strong. Gold should finish E passed the triangle trend line (.618 of C) while GDX’s “E” would end within the triangle trend line with a .382 retrace-meant of “C”. Both drop in unison thereafter
Got it. Thanks.
Timeline proportions for target E is not to scale on my chart. I’m not going to try to guess time at this point; Just guage momentum. A good method is toggling between 1hour, 4 hour and 1 day chart on fxcm ( trading station mobile) and looking at the macd relationship of each. When each of them are lined up to cross over you’re going to see some serious $hit. Does anyone have the news forecast for next week? That will also help us guage which day this could happen. If I’m wrong… Invalidation is not too far away so a stop loss should make this a low risk bet.
Jaf
Maybe just give a link for the chart if you have one?
Guys this is a pivotal moment. It is my belief that gold is about to drop in the biggest way. I wish I could say for sure… But it’s based on my understanding of the metal and how it trades. Stop loss is not far away, so you don’t have much to lose if I’m wrong (and I could be). But I’m starting to average in on this short. Richard if you can do link I’ll email it to you.
GDX dropped and DUST went up from 10:38 am to 11:00 am
Gold is retracing back up now and may get ready to drop again any minute now 12:07 pm EST???
Thanks for the chart Jaf.
This is my first post on EWG. I must say that I truly enjoy reading Lara’s analysis. It is indeed thorough. I appreciate your honest observations when you are unsure of the direction of price movement. Have you attempted to track your success ratio? I would love to see historical correlations between your daily thesis and empirical market trends and perform confidence analysis. I believe the observations could be quite enlightening.
Yes I have. It did not work. It’s an extremely subjective exercise and it resulted in quite some disagreement amongst members. I’m not going to be doing it again, but if anyone else wants to give it a go feel free.