
Downwards movement was expected for both bull and bear Elliott wave counts, in the short term, but price has moved mostly sideways to complete a small red candlestick.
Summary: Both bull and bear wave counts still expect downwards movement from here. The bear wave count expects the middle of a third wave down to start, and its target is at 1,093. I have an alternate hourly count for the bear today which allows for a final small fifth wave up before the correction is over, but it has a lower probability. The bull wave count expects a deep second wave correction to move below 1,180. The invalidation / confirmation point is at 1,162.80. A new low below that point in the next few days would strongly favour the bear wave count. If price does not move below 1,162.80 in the next few days, then the bull wave count would be favoured.
To see the bigger picture and weekly charts go here.
Changes to last analysis are italicised.
Bull Wave Count
Click chart to enlarge.
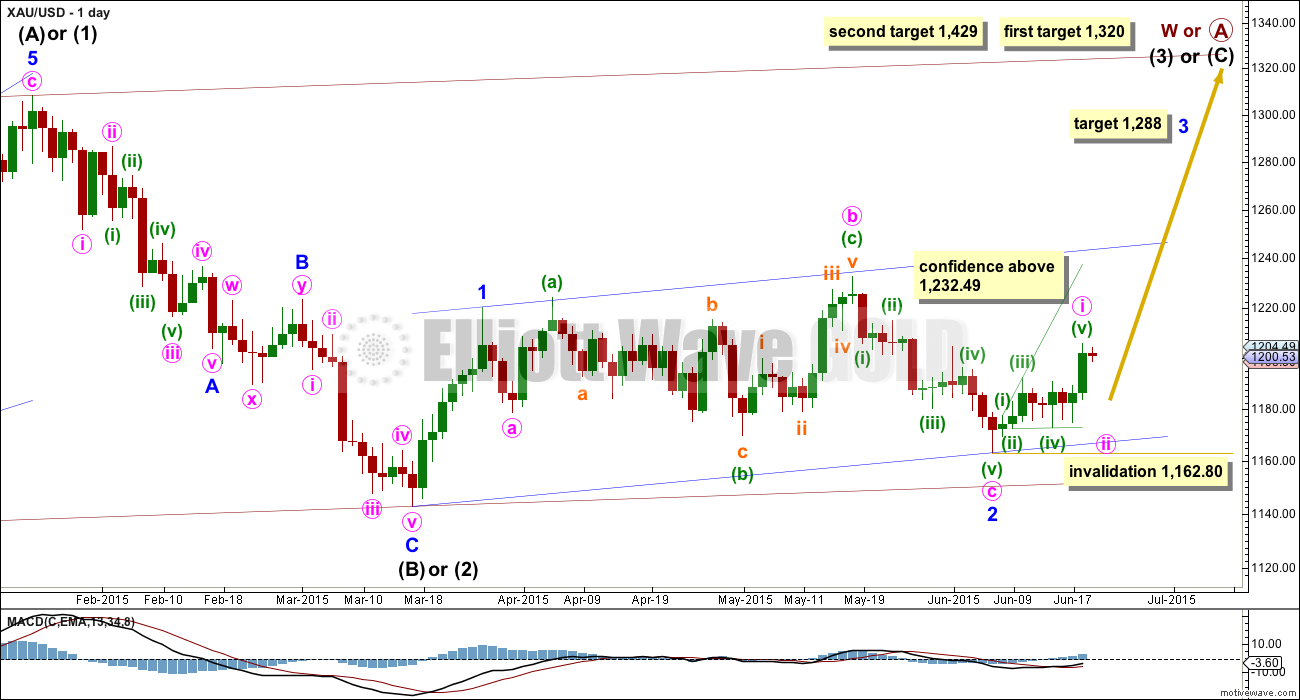
The bull wave count sees primary wave 5 and so cycle wave a a complete five wave impulse on the weekly chart.
Pros:
1. The size of the upwards move labelled here intermediate wave (A) looks right for a new bull trend at the weekly chart level.
2. The downwards wave labelled intermediate wave (B) looks best as a three.
3. The small breach of the channel about cycle wave a on the weekly chart would be the first indication that cycle wave a is over and cycle wave b has begun.
Cons:
1. Within intermediate wave (3) of primary wave 5 (now off to the left of this chart), to see this as a five wave impulse requires either gross disproportion and lack of alternation between minor waves 2 and 4 or a very rare running flat which does not subdivide well. I have tried to see a solution for this movement, and no matter what variation I try it always has a major problem.
2. Intermediate wave (5) of primary wave 5 (now off to the left of the chart) has a count of seven which means either minor wave 3 or 5 looks like a three on the daily chart.
3. Expanding leading diagonals (of which intermediate wave (A) or (1) is) are are not very common (the contracting variety is more common).
4. Volume does not support this bull wave count.
For volume to clearly support the bull wave count it needs to show an increase beyond 187.34 (30th April) and preferably beyond 230.3 (9th April) for an up day. Only then would volume more clearly indicate a bullish breakout is more likely than a bearish breakout.
Within cycle wave b, primary wave A may be either a three or a five wave structure. So far within cycle wave b there is a 5-3 and an incomplete 5 up. This may be intermediate waves (A)-(B)-(C) for a zigzag for primary wave A, or may also be intermediate waves (1)-(2)-(3) for an impulse for primary wave A. At 1,320 intermediate wave (C) would reach equality in length with intermediate wave (A) and primary wave A would most likely be a zigzag. At 1,429 intermediate wave (3) would reach 1.618 the length of intermediate wave (1) and primary wave A would most likely be an incomplete impulse.
Intermediate wave (A) subdivides only as a five. I cannot see a solution where this movement subdivides as a three and meets all Elliott wave rules (with the sole exception of a very rare triple zigzag which does not look right). This means that intermediate wave (B) may not move beyond the start of intermediate wave (A) below 1,131.09. That is why 1,131.09 is final confirmation for the bear wave count at the daily and weekly chart level.
Intermediate wave (C) is likely to subdivide as an impulse to exhibit structural alternation with the leading diagonal of intermediate wave (A). This intermediate wave up may be intermediate wave (3) which may only subdivide as an impulse.
Minor wave 2 is over here. Minute wave c is just 2.7 longer than 1.618 the length of minute wave a. At 1,288 minor wave 3 would reach 1.618 the length of minor wave 1.
Within minor wave 3, no second wave correction may move beyond its start below 1,162.80.
A new high above 1,232.49 would eliminate the bear wave count and provide full confidence in the targets.
Hourly Bull Wave Count
Click chart to enlarge.
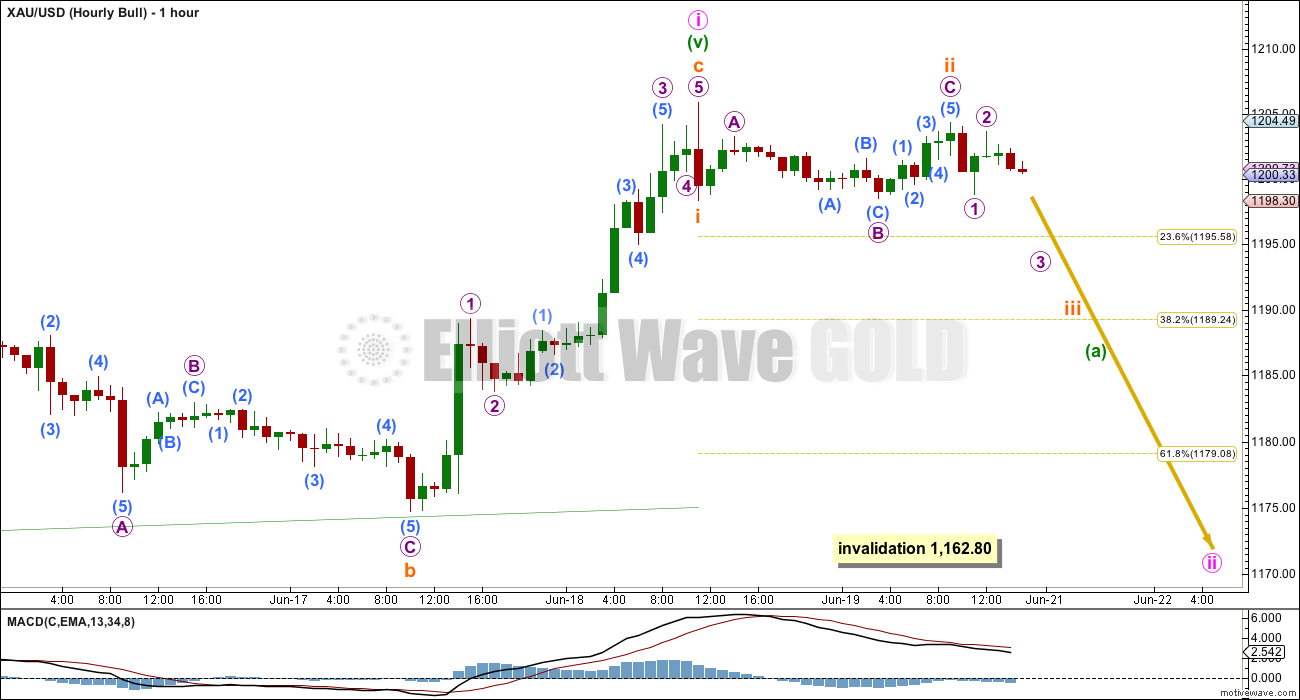
Minute wave i was seen as a leading expanding diagonal. A leading diagonal requires the second and fourth waves to subdivide as zigzags; the first, third and fifth waves are most commonly zigzags. That is why minuette wave (v) on this chart is labelled a-b-c: it’s a zigzag for the fifth wave of a leading diagonal.
Second wave corrections following leading diagonals in first wave positions are normally very deep. Minute wave ii should be expected to be very deep, likely deeper than the 0.618 Fibonacci ratio of minute wave i at 1,179.
Minute wave ii may subdivide as several corrective structures, but it is most likely to be a simple zigzag subdividing 5-3-5. A double zigzag would be the next likely structure.
Within a zigzag, minuette wave (b) may not move beyond the start of minuette wave (a) above 1,205.89. I am not putting this invalidation point on the hourly chart though, because minute wave ii may not be a zigzag and may be a flat or combination.
Within a flat or combination, the b or x wave may move beyond the start of the a or w wave at 1,205.89.
It is too early to tell which corrective structure may unfold for minute wave ii.
Bear Wave Count
Click chart to enlarge.
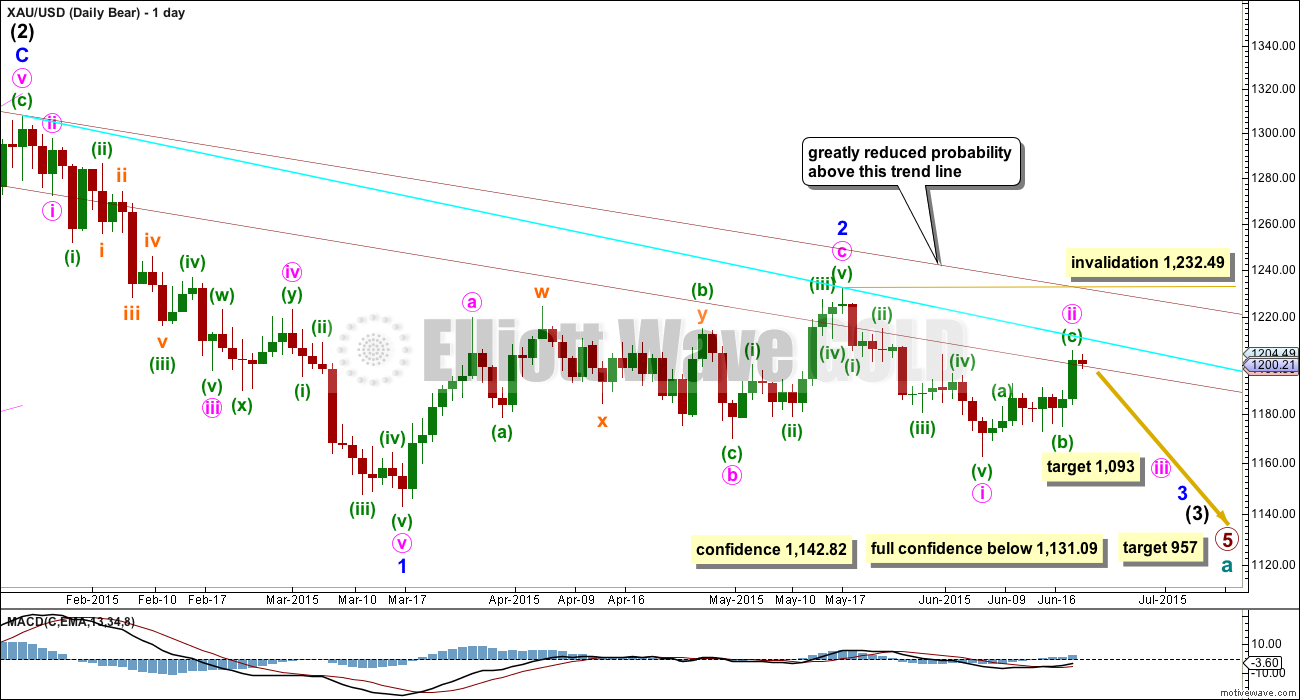
This wave count follows the bear weekly count which sees primary wave 5 within cycle wave a as incomplete. At 957 primary wave 5 would reach equality in length with primary wave 1.
Pros:
1. Intermediate wave (1) (to the left of this chart) subdivides perfectly as a five wave impulse with good Fibonacci ratios in price and time. There is perfect alternation and proportion between minor waves 2 and 4. For this piece of movement, the bear wave count has a much better fit than the bull wave count.
2. Intermediate wave (2) is a very common expanded flat correction. This sees minor wave C an ending expanding diagonal which is more common than a leading expanding diagonal.
3. Minor wave B within the expanded flat subdivides perfectly as a zigzag.
4. Volume at the weekly and daily chart continues to favour the bear wave count. Since price entered the sideways movement on 27th March it is a downwards week which has strongest volume, and it is downwards days which have strongest volume, five of them.
5. On Balance Volume on the weekly chart recently breached a trend line from back to December 2013. This is another bearish indicator.
Cons:
1. Intermediate wave (2) looks too big on the weekly chart.
2. Intermediate wave (2) has breached the channel from the weekly chart which contains cycle wave a.
3. Minor wave 2 is much longer in duration than a minor degree correction within an intermediate impulse normally is for Gold. Normally a minor degree second wave within a third wave should last only about 20 days maximum. This one is 44 days long.
4. Within minor wave 1 down, there is gross disproportion between minute waves iv and ii: minute wave iv is more than 13 times the duration of minute wave i, giving this downwards wave a three wave look.
Minor waves 1 and 2 are complete. Minute wave i within minor wave 3 may be incomplete on the hourly chart.
Minute wave ii may not move beyond the start of minute wave i above 1,232.49.
At this stage, a new low below 1,162.80 would provide a lot of confidence in the bear wave count. Further confidence would come with a new low below 1,142.82 and final confidence would come only with a new low below 1,131.09.
Minute wave ii is now very likely to be over here. If it moves any higher, then it should find strong resistance at the blue trend line.
Main Hourly Bear Wave Count
Click chart to enlarge.
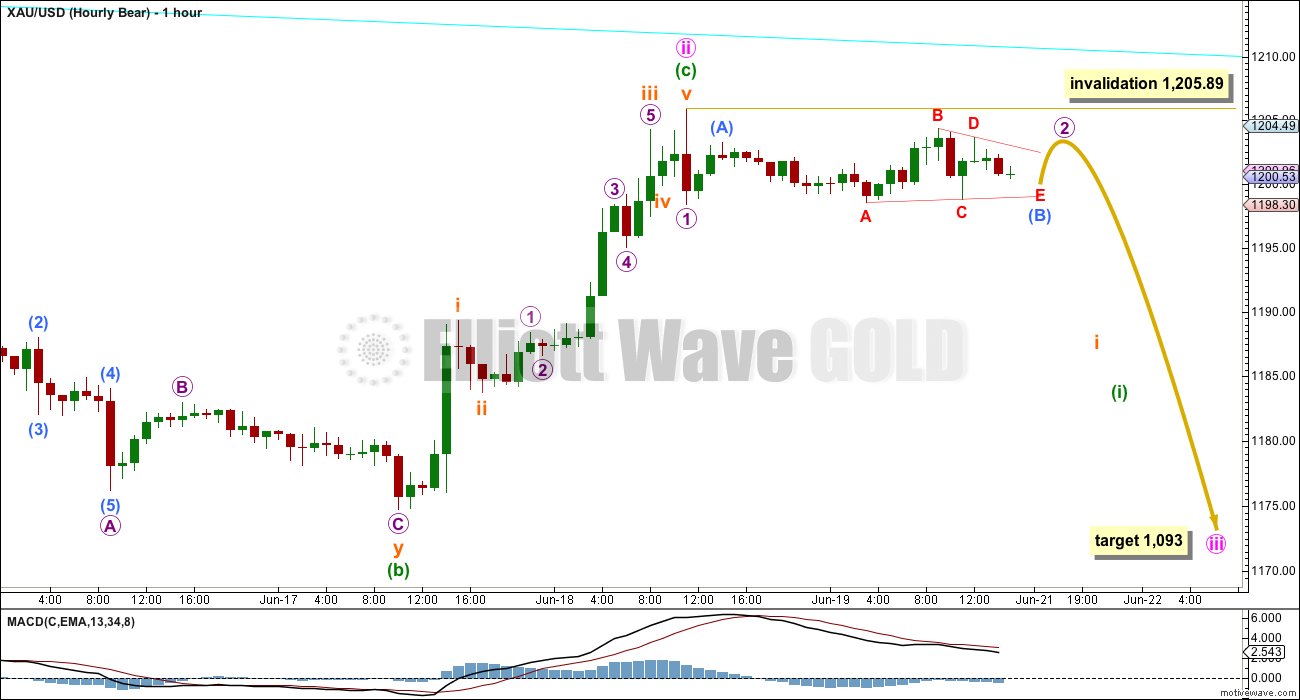
Minute wave ii is most likely to be over. Sideways movement for Friday’s session is too time consuming to look like part of the last wave up. It looks like the next wave is underway.
Minute wave ii subdivides as a zigzag (all subdivisions of this movement are seen on yesterday’s hourly chart). Minuette wave (c) is just 1.58 short of 1.618 the length of minuette wave (a). Minute wave ii has ended extremely close to the 0.618 Fibonacci ratio of minute wave i which was at 1,205.39.
At 1,093 minute wave iii would reach 1.618 the length of minute wave i.
The first move down may be a low degree first wave and incomplete second wave correction.
Within micro wave 2, a triangle may be almost complete for submicro wave (B). When it is complete, a short wave up for submicro wave (C) would be very likely to move slightly above the end of submicro wave (A) at 1,203.23 to avoid a truncation. Micro wave 2 may not move beyond the start of micro wave 1 above 1,205.89.
If price moves above 1,205.89 in the short term, then I would use the alternate below.
Alternate Hourly Bear Wave Count
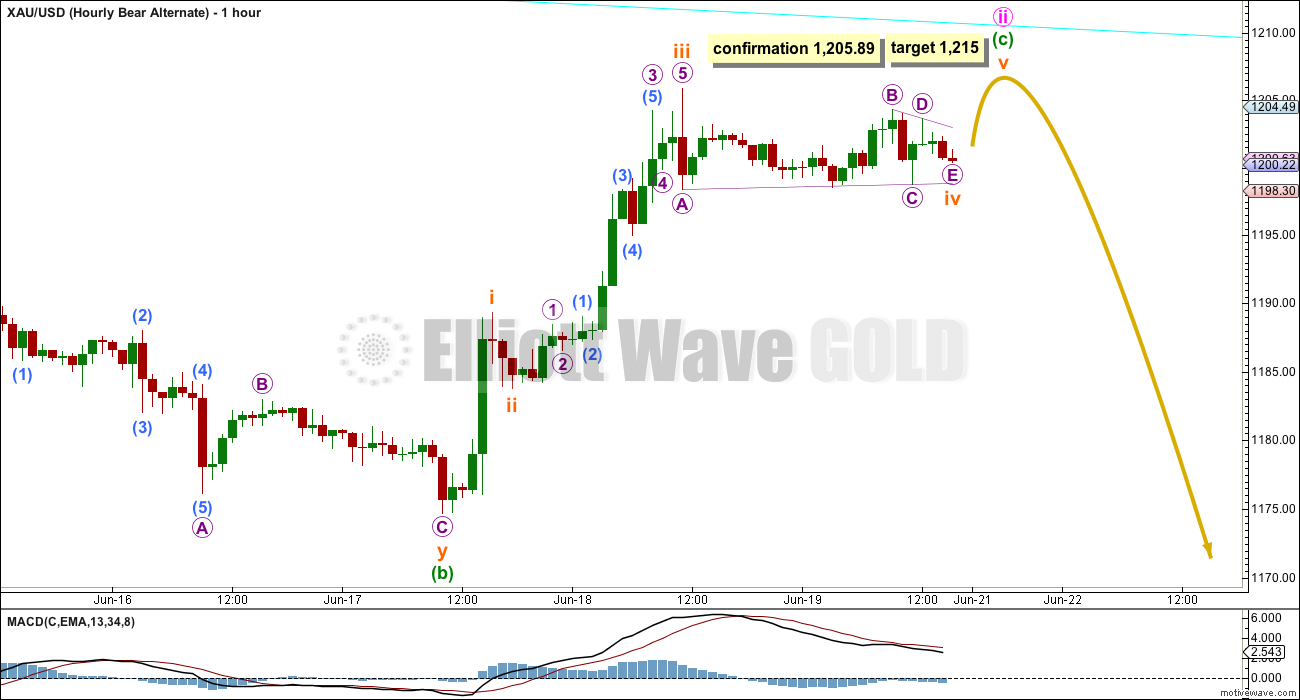
Click chart to enlarge.
It is also possible that minute wave ii is incomplete, that a final fifth wave up is required to complete minuette wave (c).
However, this sideways movement for subminuette wave iv is grossly disproportionate to subminuette wave ii: subminuette wave ii lasted just two hours while subminuette wave iv is 13.5 times that duration. Triangles are normally more long lasting than zigzags, but this difference is too great which gives this upwards movement a three wave look while it is labelled as a five.
If this idea is correct, then at 1,215 subminuette wave v would reach equality in length with subminuette wave i.
The ratio between minuette waves (a) and (c), which the main bear hourly wave count has, would be lost. Minute wave ii would no longer end at the 0.618 Fibonacci ratio of minute wave i.
This alternate has a lower probability than the main bear hourly wave count.
Technical Analysis
Click chart to enlarge.
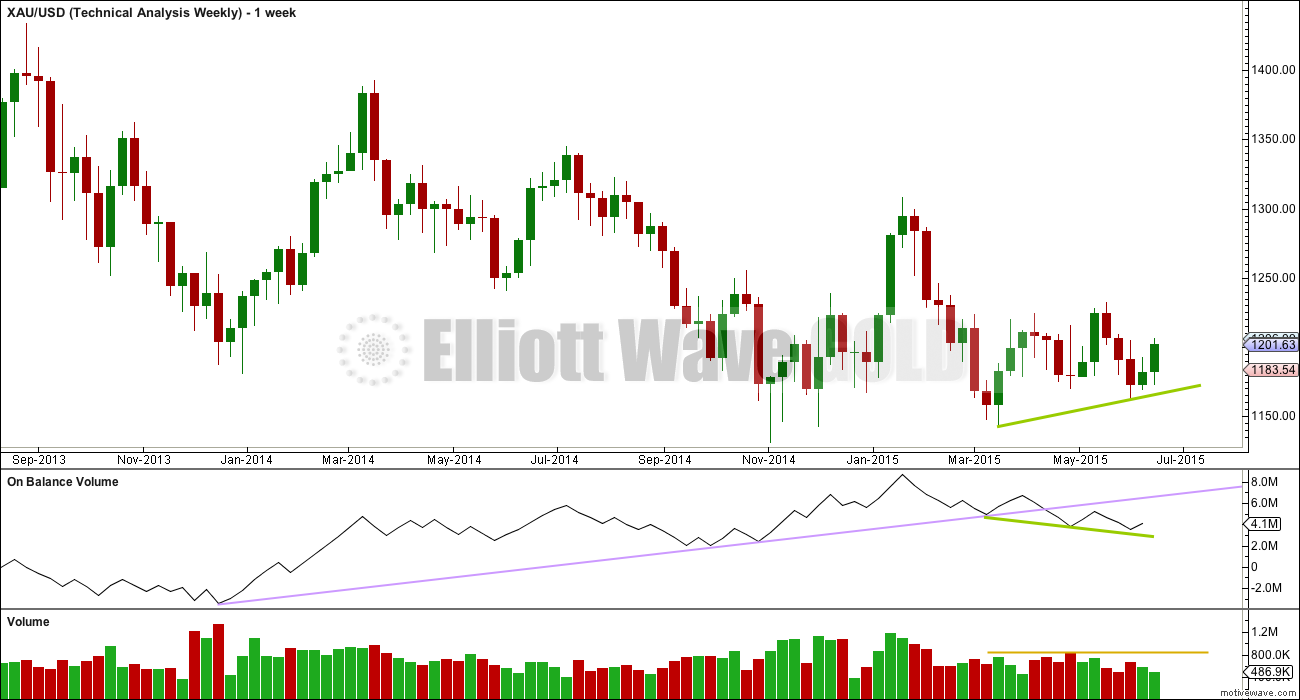
Weekly Chart: Overall volume still favours a downwards breakout eventually. During this sideways movement, it is still down days and a down week which have higher volume. On Balance Volume breaches a trend line (lilac line) which began in December 2013, and the breach is significant.
While price has made higher lows, On Balance Volume has made lower lows (green trend lines). This small rise in price is not supported by volume, and it is suspicious.
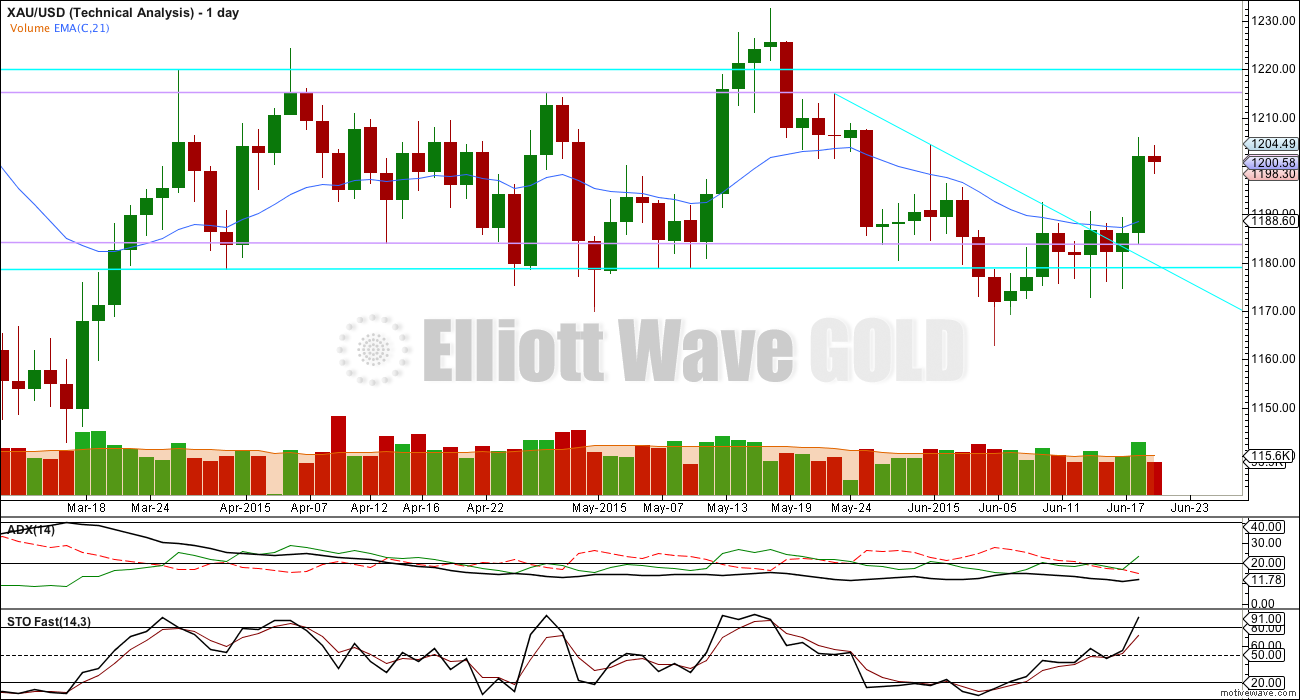
Click chart to enlarge.
Daily Chart: ADX still strongly indicates there is no clear trend. A range bound system should be employed. With price now fully above the downwards sloping blue trend line, which recently provided resistance, this approach would expect a continuation of upwards movement to the upper horizontal trend lines and for Stochastics to again reach overbought.
Stochastics is now overbought and so this system could expect the upwards swing to possibly end here. But this is the problem with this approach. While Stochastics is overbought price has not yet reached the resistance lines. Upwards movement could continue for a few days until price again reaches resistance. Or the upwards swing may be shorter and the next downwards swing (or even a downwards breakout) could begin from here. It is impossible to tell with this approach exactly where one swing ends and the next begins.
The most reasonable approach would be to expect price to continue up until it reaches resistance and for Stochastics to continue to remain overbought for a few days, like it did for the last swing high which ended on 18th May.
This approach does not now diverge so strongly from the Elliott wave counts.
Volume continues to indicate a downwards breakout may be more likely than upwards, but this does not always work. Volume is an indicator, is not definitive, but is another piece of information to consider.
Within the sideways range, it is six days which have strongest volume and they are all down days: 9th April 230.3k, 30th April 187.8k, 29th April 181.8k, 16th April, 176.9k, 14th April 171.5k. The strongest up day had 171.1k on 13th May.
This analysis is published about 04:57 p.m. EST.
God bless Lara for her fabulous analysis and patience to respond to members wherever possible. As she goes on to say “If I do nothing else, I hope to be able to teach members enough of EW rules and guidelines for you to all be able to pick out EW analysis which is useful (adheres to rules and guidelines) and that which is not useful.” That’s more than value for money folks~!!
I agree with you Syed.
Lara,
Do you have a preference on hourly bull or hourly bear?
Is hourly bull still likely to go below 1,179 and perhaps to end minute wave ii at about 1,170 area? Is bull count still favoured if price doesn’t drop below 1,162.80 this week?
At which price might the next big retrace and upper target be on the way down?
Overall I slightly favour the bear because of volume indicators.
For the bull count I’m going to look at moving the degree of labelling within minute ii up one degree; instead of subminuette wave i complete that may have been minuette wave (a). The zigzag may be a quick deep movement.
But it’s also equally likely that the labelling is correct and minuette wave (a) is incomplete. That would see minute wave ii a big clear three wave structure.
Zigzags normally look like clear threes, with the B wave within them time consuming. But sometimes a zigzag can look like an impulse because sometimes the B wave is quick and shallow.
Either way, minute ii is incomplete. A target below the 1,179 area would still be most likely.
For the bear we may get a new low below 1,162.80 in the next one or two days now.
Lara, Congratulations on the brilliant EW forecast of today’s huge gold drop.
So on the daily bear, we re in 5 of 1?
Does the failure to make a new high to = 2 for the bear found mean that the primary is in play?
Ugly candles on Gold right now
I think the move to 1204.29 Friday afternoon completed micro 2
1204.29 at 9:50 am EST Friday
It does look as if the Hourly Bear is in play.
The Hourly bear alternate hasn’t been confirmed with movement above 1205.89
I’m firmly discarding that hourly bear alternate. It’s completely wrong.
Undeniably, gold has been difficult to predict this year. It’s surely been a frustrating time for many traders. Nonetheless , there is a silver lining to this plaguing cloud.
The volatile and often seemingly senseless nature of gold has challenged us to ask questions and seek new solutions this year. And that’s not a bad thing if you’re an optimist — God help you if you’re not —
For instance, this lingering mass of complex patterns and ugly ratios has caused many of us to question our strategies. Richard for example is now taking heed of fundamental news -Great! Laura is introducing common and supportive technical tools, and I have also revised my theories and beliefs…
I believe the Elliott Wave Theory is a sophisticated system of bilateral explanations. You can look at a perfect five-wave impulse and say it’s 100% bullish. And I can look at that same impulse and argue the chart is 100% bearish, simply by labeling it wave “A” of a “corrective” zig-zag. Think about that for a moment… and then think about all the other patterns that are hypocritical of one another.
Let’s apply my theory to our progress and hard work this year.
We’ve virtually become so good at reading these complex patterns such that we can now develop arguments for both bull and bear.
We zoom in on 5 minute charts looking for clues and explanations but only find ourselves entrapped in depts of complexity with no definitive answers.
We continue to apply the same solutions to the same problems expecting different results and
like a mouse in a wheel we go nowhere.
So where’s the silver lining?
The EWG website has great potential. It is the only website that I remain subscribed to. Lara has great work ethics and she has several dedicated traders who are on-site every day. The sooner this group acknowledges the caveats with E-wave the sooner we will find a rewarding solution. E-wave is useful but we have to understand it for what it is, and what it is not.
Ps… So if the Elliott wave theory is a double standard system you’re probably wondering how I can be so confident that gold will break-out of this triangle to the downside? The simple answer is:
I am waging my risk margin as minimal due to the close proximity of the invalidation point. I’m also acknowledging momentum, volume, Gdx/$sptgd/$hui behaviour, and the University of Michigan sentiment report as a precursor to the pending Wednesday GDP report.
**Remember, we are in a grand supercycle wave 4! I wouldn’t expect all ratios to be picture perfect. Even Frost and Prechter advise taking a holiday during this ominous corrective patern.
Jaf
Elliott wave is never going to be accurate all the time, no technical analysis method exists which will be accurate all the time.
The variety in nature is reflected in markets, as an expression of human social mood.
Corrections are always hard to analyse, for any TA method. They exhibit the greatest variety, there are more than 13 possible EW corrective structures. From 27th March I’m pretty sure Gold moved into a long lasting and complicated B wave. They’re the worst of all Elliott waves to analyse.
But at the end of the day there will be only one correct wave count. It’s my job to figure out what that is before major movements in price.
The last several years have shown me that it is attention to detail, a through knowledge of Elliott wave rules and guidelines, and an eye for the “right look” that is going to see me come up with the right wave count more often than not.
You are right that two Elliotticians can come up with different wave counts and very different projections in exactly the same market. So can two different technical analysts using various TA tools.
But in all of that you must also pay attention to the application of rules and guidelines. There is an enormous amount of analysis online calling itself Elliott wave, which violates rules, ignores guidelines, and ignores the right look.
Any application of EW which ignores the rules (or tries to rewrite them) in Frost and Prechter will eventually have zero predictive power. It may be lucky for a while (especially if the fault is at a large degree like primary) and it may look like it’s on the right track, but eventually the wave count will be found to have no use.
So in any discussion of the practical use of EW I do think that this problem must be acknowledged. There is too much EW analysis which does not follow EW rules and guidelines.
If I do nothing else, I hope to be able to teach members enough of EW rules and guidelines for you to all be able to pick out EW analysis which is useful (adheres to rules and guidelines) and that which is not useful.
Jaf, Being an optimist myself, I agree with the silver linings in the cloud of the past months of sideways limited range movements. You mentioned University of Michigan sentiment report as a precusor to this Wednesday’s 8:30 am GDP report.
I checked it is very bullish. http://www.sca.isr.umich.edu/
I would enjoy if there were more intraday comments on wave counts and retrace highs and low, for better trading results.
Lara’s site is the only site I subscribe to.
Here is the GDX – 2 hour chart.
I have spread out the substructure of E (circled) so that you can see the fib retracements for both orange C and green E. So the illustration is obviously not proportionate to time but rather accurate on price. Orange C and Green E both share $19.72 as a common retracement point this will likely be where it stops to the upside. But I would guage your short entry by using price of gold momentum and don’t be surprised if GDX truncates to the upside.
Pink B retracements are as follows ( not shown on chart due to congestion)
23.6% of Pink A = 19.08
38.2% of Pink A = 20.70 (on the trend line)
Jaf
Jaf, what do to make of today’s GDX action? Still in the b wave? Seems to be getting very deep for a zigzag.
Lara,
Attached is my detailed hourly look at Intermediate wave A of my triangle idea. The entire move is a perfect Zig-Zag pattern with perfect proportions for both price and time.
The sub waves are minor wave A.B.C
A is an expanding diagonal.
B is a combination of zig-zag + triangle + expanded flat
C is a perfect 5 wave impluse
The entire move has perfect fibonacci proportions:
C = 1.382 X A (exactly)
It also has perfect time line proportions:
C = 0.618 X A (exactly)
I hope you can all read the chart because it has the perfect look IMO.
(If you cant read it, I can always email it to you Lara and you can post it if necessary)
Jaf
I can’t read it, when I open in another window and zoom in its blurry.
Please could you email it to me: admin@elliottwavegold.com
Thank you
Sent
Okay, I’ve had a pretty close look at this part of your wave count. It is crucial to the bigger picture; if intermediate wave (A) is an A wave within a triangle it must be a three.
There are two violations of Elliot wave rules I can see in this wave count.
Within the leading diagonal of minor wave A minute wave i is labelled as a leading diagonal. First waves within leading diagonals may only be either zigzags or impulses. They may not be diagonals.
The diagonal of minor wave A has trend lines which converge and a fourth wave which is shorter than the second, so the diagonal would be contracting. But the third wave at 78.46 is longer than the first wave at 76.86. The rules for wave lengths of contracting diagonals is violated. Also, it does not fit the rules for expanding diagonals either.
A wave count which does not meet all EW rules all the time is not valid.
Ok so I fixed sub-wave 1 of the disputed leading diagonal into a permissible zig-zag which was easy enough. The only disparity is the difference between the length of pink 1 and pink 3. This difference is $5.73.
So if “this” is the “only” discrepancy thats holding us back from illustrating this ENTIRE move as an obvious triangle, I am more confident in my analysis than before. I’m certain technicians are not scrutinizing over this technicality, they’re calling this move as they see it… ( particularly in a grand supercycle wave 4.)
Good luck to you all.
Jaf
You may be more confident in your analysis, but it still violates an Elliott wave rule.
That’s the thing about Elliott wave. The rules are black and white.
The wave count violates an EW rule. The wave count is invalid.
I just don’t know what else I can say about it at this point. If you want to rewrite the rules as they are in Frost and Prechter then this is not the website and place to be doing that.
Lara, you’re right, I’m wrong.
Sorry for posting my ideas… I can see I hit a nerve… I will keep my thoughts and ideas to myself.
Thank you
Jaf
No, you’re welcome most certainly to publish your wave counts and ideas.
And if your wave count gives us another alternate to work with that’s great.
But it must meet all EW rules.
Because if we’re going to start rewriting the rules or breaking them because we want to… then it’s not Elliott wave.
That A wave in your triangle won’t subdivide as a three and fit all EW rules. It just does not work. That’s telling you something really important about your wave count. And that’s what I was aiming to point out to you.
I do want you and all members to keep publishing ideas, but if anyone publishes a wave count here which violates EW rules it’s my job to point that out.
Jaf, can you post a close-up of your GDX count? I’m thinking that today may have been wave b of e for the triangle and now we are looking for wave c of e up? If so, Looks like the b wave pullback was just past the .618 mark and the targets for c would be 19.45, where c=a, or 20.02 where c= 1.618 of a. That would complete the triangle and then GDX would drop hard with gold. Thoughts? Bob
P.S. Thanks for posting your charts. Right or wrong, they are very helpful and we’ll know soon.
Dreamer–a pop in gdx works well with either of Lara’s bear hourly counts.
Results of Kitco News’ Wall Street vs Main Street Weekly Gold Survey.
Outlook for next week 52%, are bearish on gold 35%, are bullish on gold 13% neutral.
Survey is in the same article below.
Gold Market To Watch Greece Turmoil, U.S. Dollar Next Week – By Neils Christensen
Friday June 19, 2015 16:08
http://www.kitco.com/news/2015-06-19/Gold-Market-To-Watch-Greece-Turmoil-U-S-Dollar-Next-Week.html
Inflation, deflation and the big gold call
Avi Gilburt – Published: June 19, 2015 2:13 p.m. ET
http://www.marketwatch.com/story/inflation-deflation-and-the-big-gold-call-2015-06-19
Avi’s stance, as a staunch adherent to EW, is that the only force that drives markets is sentiment. He does not believe in inter-market analysis, nor news.
Tham you are correct that is what AVI believes that sentiment drives the market. He also likes to ignore the US dollar and the news. So does Lara.
However when the big US news and the US dollar move in a way that moves gold opposite to what the Elliott Wave forecast is and an investor loses money enough times, eventually they may consider the US dollar and the big news so as to minimize surprise losses and maximize profits.
I used to ignore news and the US dollar for 18 months then saw the light and now take them into consideration, while mainly focused on Elliott Wave.
Others may disagree and to each their own with their own money.
Avi is pretty confident that any bounce we get here is a correction in the bear count.
Precious Metals: Upside Blastoff – June 19th
Morris Hubbartt
http://www.321gold.com/editorials/sfs/hubbartt061915.html
Many interesting gold, silver, and miners charts and more markets.