
Upwards movement was expected and is enough to provide full confirmation of the two main Elliott wave counts, which still do not diverge at this stage.
Summary: Both bull and bear wave counts still expect upwards movement to continue for a few days. The bull wave count has a minimum requirement at 1,232.49 and a maximum at 1,242.91. Upwards movement for the bull count may last about another three days. The bear count requires upwards movement to a minimum at 1,233.82 and its maximum is the upper maroon trend line on the daily chart. It may last a little longer, maybe a further six days. I favour the bull wave count. A short term target for upwards movement for both bull and main bear wave counts is at 1,220.
To see weekly charts for bull and bear wave counts go here. Changes to last analysis are italicised.
Bull Wave Count
Click chart to enlarge.
The bull wave count sees primary wave 5 and so cycle wave a a complete five wave impulse on the weekly chart.
Pros:
1. The size of the upwards move labelled here intermediate wave (A) looks right for a new bull trend at the weekly chart level.
2. The downwards wave labelled intermediate wave (B) looks best as a three.
3. The small breach of the channel about cycle wave a on the weekly chart would be the first indication that cycle wave a is over and cycle wave b has begun.
Cons:
1. Within intermediate wave (3) of primary wave 5 (now off to the left of this chart), to see this as a five wave impulse requires either gross disproportion and lack of alternation between minor waves 2 and 4 or a very rare running flat which does not subdivide well. I have tried again to see a solution for this movement, and no matter what variation I try it always has a major problem.
2. Intermediate wave (5) of primary wave 5 (now off to the left of the chart) has a count of seven which means either minor wave 3 or 5 looks like a three on the daily chart.
3. Expanding leading diagonals (of which intermediate wave (A) or (1) is) are are not very common (the contracting variety is more common).
4. The possible leading diagonal for minor wave 1 and particularly minute wave ii within it look too large.
For volume to clearly support the bull wave count it needs to show an increase beyond 187.34 (30th April) and preferably beyond 230.3 (9th April). Only then would volume more clearly indicate a bullish breakout is more likely than a bearish breakout.
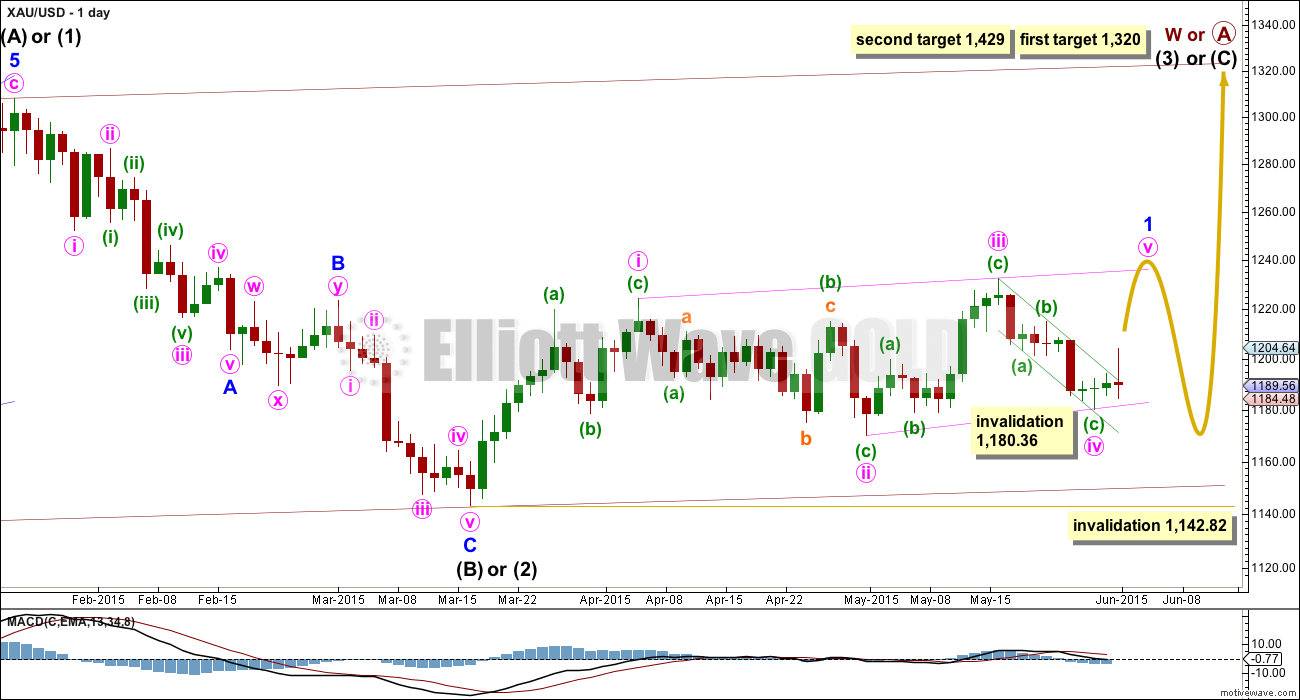
Within cycle wave b, primary wave A may be either a three or a five wave structure. So far within cycle wave b there is a 5-3 and an incomplete 5 up. This may be intermediate waves (A)-(B)-(C) for a zigzag for primary wave A, or may also be intermediate waves (1)-(2)-(3) for an impulse for primary wave A. At 1,320 intermediate wave (C) would reach equality in length with intermediate wave (A) and primary wave A would most likely be a zigzag. At 1,429 intermediate wave (3) would reach 1.618 the length of intermediate wave (1) and primary wave A would most likely be an incomplete impulse.
Intermediate wave (A) subdivides only as a five. I cannot see a solution where this movement subdivides as a three and meets all Elliott wave rules (with the sole exception of a very rare triple zigzag which does not look right). This means that intermediate wave (B) may not move beyond the start of intermediate wave (A) below 1,131.09. That is why 1,131.09 is final confirmation for the bear wave count at the daily and weekly chart level.
Intermediate wave (C) is likely to subdivide as an impulse to exhibit structural alternation with the leading diagonal of intermediate wave (A). This intermediate wave up may be intermediate wave (3) which may only subdivide as an impulse.
It is possible that the intermediate degree movement up for the bull wave count is beginning with a leading diagonal in a first wave position for minor wave 1.
A leading diagonal must have second and fourth waves which subdivide as zigzags. The first, third and fifth waves are most commonly zigzags, but sometimes they may be impulses. The fourth wave must overlap first wave price territory.
Within diagonals, the most common depth of the second and fourth waves is between 0.66 and 0.81. Minute wave ii is 0.67 of minute wave i. So far minute wave iv is 0.83 of minute wave iii, a little deeper than normal range.
The maximum depth for minute wave iv is at 1,178.08 where it would reach equality in length with minute wave ii. Because the diagonal is contracting the fourth wave may not be longer than equality with the second wave, should be shorter, and the trend lines should converge. Minute wave iv is now over. Within minute wave v no second wave correction nor B wave may move beyond its start below 1,180.36.
Second wave corrections following leading diagonals in first wave positions are commonly very deep. When this leading diagonal structure for minor wave 1 is complete, then minor wave 2 should unfold lower, may be expected to reach at least the 0.618 Fibonacci ratio of minor wave 1 or may be quite a bit deeper than that, and may not move beyond the start of minor wave 1 below 1,142.82.
Click chart to enlarge.
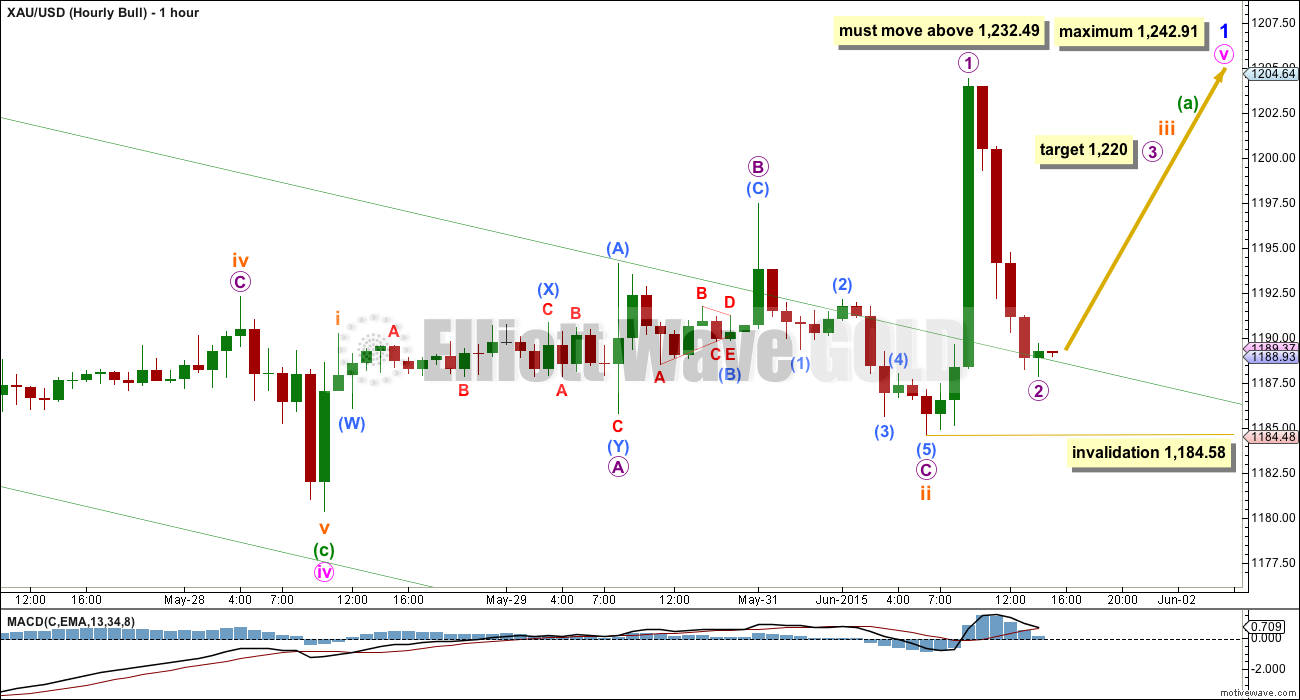
The wave count at the hourly chart level is the same for this bull and the main bear wave count below. A second wave, here subminuette wave ii, continued sideways to complete as an expanded flat correction. Micro wave B is an unusual length, at 2.65 times the length of micro wave A. But the subdivisions fit perfectly. Micro wave C has no Fibonacci ratio to micro wave A, but it has moved slightly below the end of micro wave A avoiding a truncation and a very rare running flat, and subdivides perfectly as a five wave impulse. Because the subdivisions fit perfectly and expanded flats are very common structures, it looks like this portion of the analysis is correct.
Within subminuette wave iii, micro waves 1 and now 2 are most likely complete. Micro wave 2 is a very deep correction of micro wave 1. It subdivides okay on the five minute chart as a completed zigzag, and is finding support about the upper edge of the channel, which previously provided resistance. At 1,220 micro wave 3 would reach 1.618 the length of micro wave 1.
Micro wave 2 may not move beyond the start of micro wave 1 below 1,184.58. If this invalidation point is breached, then the invalidation point moves down to where it is on the daily chart, to 1,180.36. At that stage, it may be that minuette wave (a) was already complete at the high labelled subminuette wave i, and minuette wave (b) may be unfolding lower. This is technically possible, but I consider it extremely unlikely because the subdivisions don’t have a good fit and it would see a remarkably short minuette wave (a).
Minor wave 1 is a leading contracting diagonal. Minute wave v of a leading diagonal may not be truncated and must move above the end of minute wave iii at 1,232.49. Minute wave v must be shorter than minute wave iii in length and may not move beyond equality with minute wave iii above 1,242.91.
Main Bear Wave Count
Click chart to enlarge.
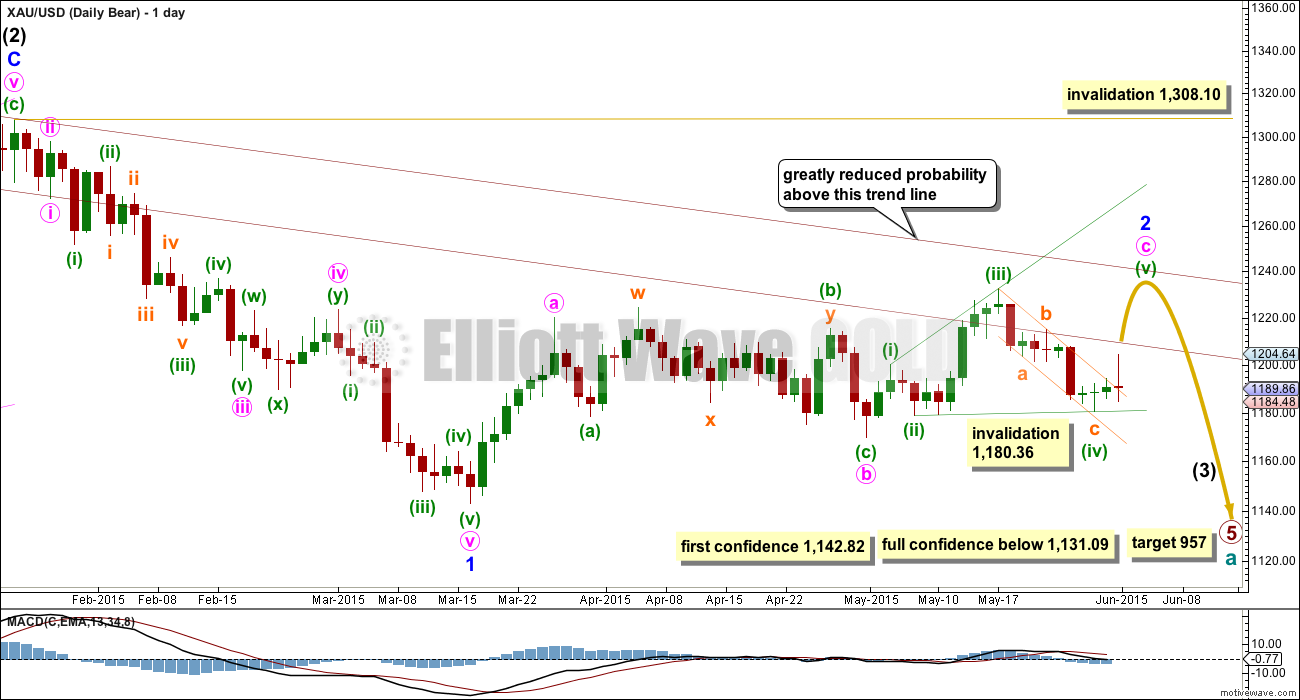
This wave count follows the bear weekly count which sees primary wave 5 within cycle wave a as incomplete. At 957 primary wave 5 would reach equality in length with primary wave 1.
Pros:
1. Intermediate wave (1) (to the left of this chart) subdivides perfectly as a five wave impulse with good Fibonacci ratios in price and time. There is perfect alternation and proportion between minor waves 2 and 4. For this piece of movement, the bear wave count has a much better fit than the bull wave count.
2. Intermediate wave (2) is a very common expanded flat correction. This sees minor wave C an ending expanding diagonal which is more common than a leading expanding diagonal.
3. Minor wave B within the expanded flat subdivides perfectly as a zigzag.
Cons:
1. Intermediate wave (2) looks too big on the weekly chart.
2. Intermediate wave (2) has breached the channel from the weekly chart which contains cycle wave a.
3. Minor wave 2 is much longer in duration than a minor degree correction within an intermediate impulse normally is for Gold. Normally a minor degree second wave within a third wave should last only about 20 days maximum. This one is in its 54th day and it is incomplete. It is now starting to look ridiculous; this is becoming a serious problem for the bear wave count. The bearish alternate below mostly resolves this problem.
4. Within minor wave 1 down, there is gross disproportion between minute waves iv and ii: minute wave iv is more than 13 times the duration of minute wave i, giving this downwards wave a three wave look.
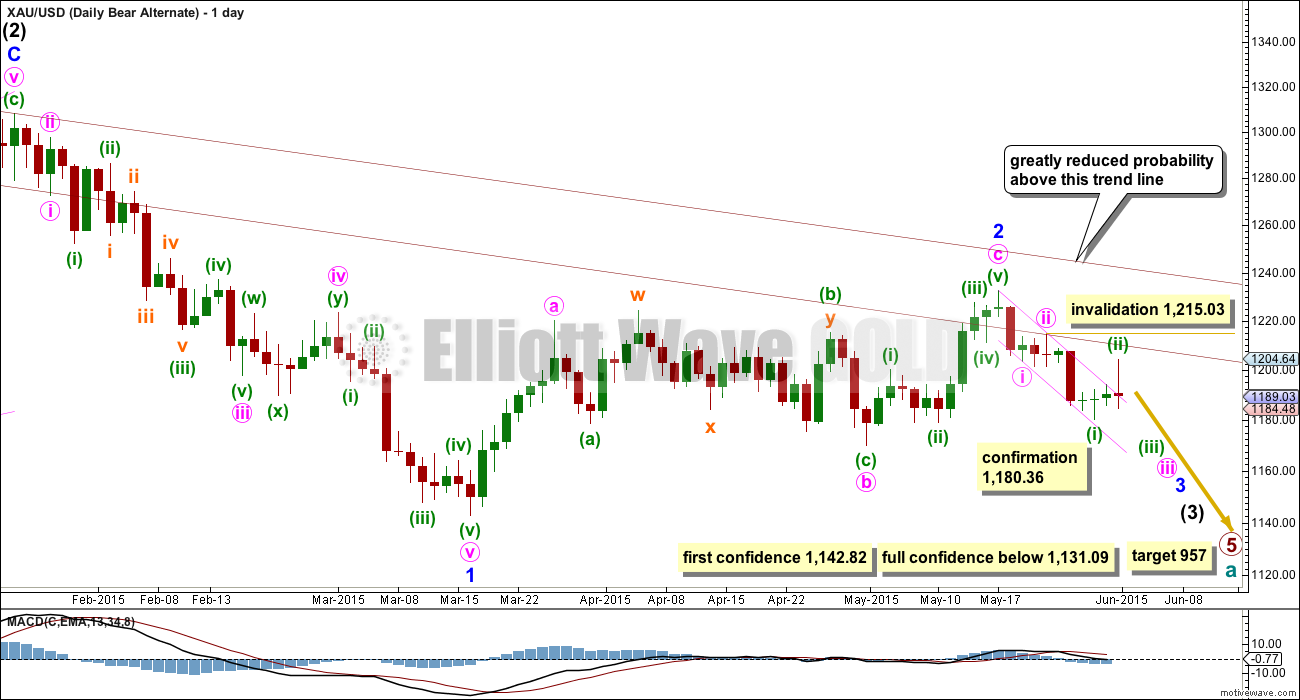
This bear wave count now needs minute wave c upwards to complete as a five wave structure which looks most likely at this stage to be an ending expanding diagonal.
Minor wave 2 may not move beyond the start of minor wave 1 above 1,308.10. However, this wave count would be substantially reduced in probability well before that price point is passed. A breach of the upper maroon trend line, a parallel copy of the upper edge of the channel copied over from the weekly chart, would see the probability of this wave count reduced so much it may no longer be published before price finally invalidates it.
When the ending diagonal structure is complete, then this bear wave count expects a strong third wave down for minor wave 3 within intermediate wave (3). At that stage, a new low below 1,142.82 would provide strong indication that the bear wave count would be more likely than the bull wave count. Only a new low below 1,131.09 would provide full confidence.
Click chart to enlarge.
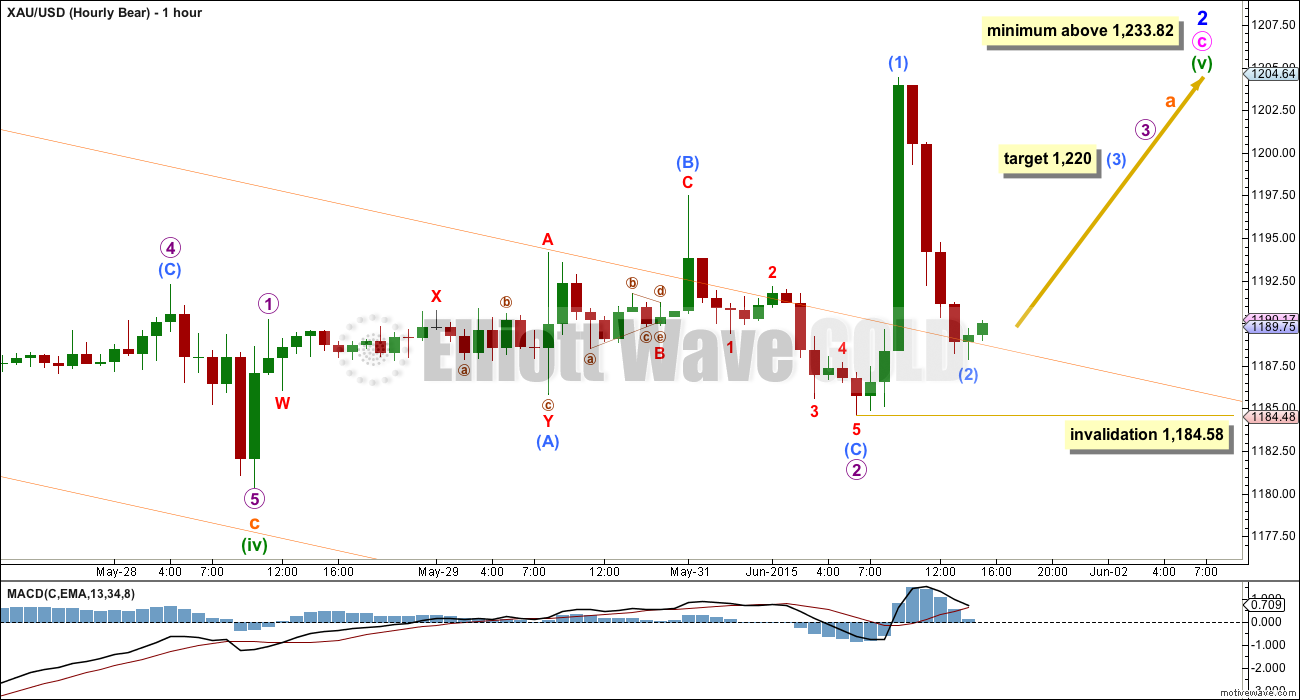
This hourly bear wave count is essentially the same as the hourly bull wave count.
Minute wave c is an ending expanding diagonal. Minuette wave (v) must be longer than equality in length with minuette wave (iii). It must move above 1,233.82.
Alternate Bear Wave Count
Click chart to enlarge.
I will continue to publish this alternate bear wave count because it resolves much of the problem of minor wave 2 being too long in duration for the main bear wave count.
Here minor wave 2 is a completed zigzag which lasted 44 days, just over twice the normal duration for a minor degree correction within an intermediate degree impulse for Gold. If minor wave 3 has begun, then it may now have two overlapping first and second wave corrections.
The problem today, which further reduces the probability of this wave count, is minuette wave (ii) has breached a base channel drawn about minute waves i and ii. Price should have found resistance at the upper edge of this small pink channel. However, base channels don’t always work. Price has come strongly back down.
This alternate bear wave count has a very important implication. If it is correct, then a very strong third wave down may have just begun. It requires confirmation. A new low initially below 1,180.36 would provide enough confirmation for this wave count to be taken seriously. If that happens, then this wave count would expect an imminent strong increase in downwards momentum.
For confidence in the target at 957 a new low below 1,142.82 and finally 1,131.09 is required.
Technical Analysis
Click chart to enlarge.
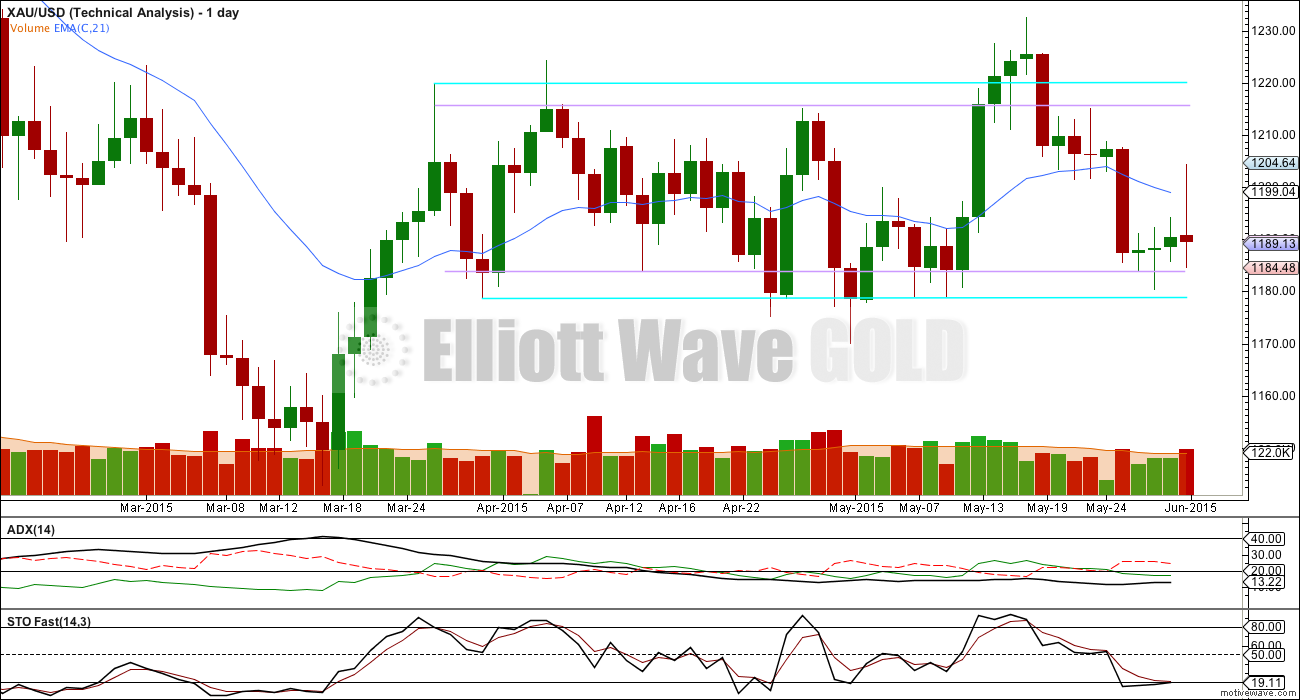
ADX is still below 15 and flat. Gold remains range bound. No clear trend is yet evident and so a range bound trading system should be used as opposed to a trend following system.
This range bound system I am outlining here uses Stochastics to indicate where each swing begins and ends. Stochastics is returning from oversold currently, and so a swing higher until Stochastics is again overbought would now be expected.
The horizontal trend lines delineate the upper and lower levels of support and resistance. The aqua blue trend lines are close to the extreme edges, the inner lilac lines are 0.5% of market value within the outer lines. These horizontal lines continue to show mostly where price is finding support and resistance.
While ADX remains below 15 this system should continue to be used. The +DX and -DX lines are not used, nor is the EMA, for this system. Only Stochastics and the trend lines are used in conjunction with the ADX line.
This analysis is published about 05:07 p.m. EST.
Wednesday 8:15 am EST ADP Payroll report important news will be a preview of what might happen with US non-farm payroll Friday the biggest news of this week that should really move the US dollar and gold.
Gold settles at highest level in more than a week – June 2, 2015 3:02 p.m. ET – That was the highest settlement for a most-active contract since May 22.
http://www.marketwatch.com/story/gold-edges-higher-as-dollar-pulls-back-2015-06-02
I’d like to let members know today that we think we have found a solution to the problem with comments. In order for it to work we have to update the theme of the site, which is a big job for a big site. Thereafter the new theme will look mostly the same but we can add a feature which allows for images to be uploaded from devices (no link required). We will be taking the site down on Sunday (EST) for a few hours to make changes. Hopefully if everything works as it should next week comments will be real time updated, and charts can be uploaded. I’d also like to make it clear for everyone that if you have any problems with how your name is appearing when you make comments please email us (or use the contact form) and let us know how you’d like your handle to appear. We can then change it for you. Thanks for your patience everyone!
Lara–a comment on current forum issue.
Every browser (I use Mac and Safari) can be different but text in forum is presented to me in very small difficult to read font. Possibly something can be done at server level to increase size of forum font? Not the type of font but font size is the issue.
This will come with the new theme when installed this coming weekend. For now you could try using command + to increase font of the whole page? I too use Macs + Safari. I always increase font size this way.
Lara: does today’s modest upward movement still fit with your outlook of a 3rd wave in the early stages? While gold made progress, movement seemed very subdued. Thanks.
I know, it’s slightly concerning. It isn’t convincing as a third wave… yet. But nor is it convincing at all as a third wave down (alternate bear count). Sometimes this is how third waves begin. Momentum has increased but is slightly lower than yesterdays momentum. I have an alternate bull count at the hourly level; minuette (a) may be either an impulse (that’s the main bull count, preferred) or a leading diagonal (lower probability structure). But that also expects a third wave up within the diagonal so it doesn’t resolve the problem of this small inside day. ADX is still flat and below 15. The TA picture still expect a swing up from here up to resistance.
Gold is now still looking Bullish in TOS platform with TTM and other top indicators in 4 hours down to 1 minute time frames.
I got nugt in a 5th wave up, should break the 11.41 high soon.
Shahab–how high does 5th wave take NUGT?
Here are some volume stats. someone posted somewhere.
At 11:45am Volume across the PM group seems to be ‘modest/low’ at best…
GOLD futures have traded 95K+ (Mon 177K)…
GLD at 2.0mil (avg 6.6mil)… @ NT-OS
GDX at 6.6mil (avg 43.9mil)… @ NT-OS
SLV at 2.5mil (avg 7.3mil)… @ NT-OS
Bottom-line, no bounce yet… everyone still ‘waiting for Godot’…
Of the big-cap Miners, only GG and ABX are showing some ‘life’, moving thru NT-rst levels on ‘decent’ volume.
Golds not going anywhere but grinding down to complete D of the triangle idea I posted when we had disqus. Despite proportion concerns it is characteristically on a predictable path that continues to make me money. …Jaf
What’s your target for the low of wave D?
Amazing ” continues to make you money” please enlighten us a little on the predictable path please.
How can I? Can’t post anything… Can’t say much or messages become deleted…
Best thing you can do right now is play momentum on macd…. Toggle between 1,2,4 hour, daily and weekly charts and you’ll see your answer
I’ve only deleted about two comments in the last six weeks. If either were yours then would not be because you disagree with my wave count, it would be because the tone doesn’t comply with the comment guidelines. I have no problem whatsoever with members disagreeing with my analysis as long as everyone remains polite. I have no problem with members posting alternate wave count ideas, and in fact this is most useful. I don’t remember the specific idea you are referring to, is it this alternate idea on the weekly chart? This one has been suggested several times recently. Primary wave 4 is labelled here as a flat, but it could also be a triangle. If it’s a triangle… then intermediate (A) has to subdivide as a three (single, double or triple zigzag). It can technically fit as a triple zigzag I guess. There are so many problem I can see with this wave count it’s not an idea I’d want to publish.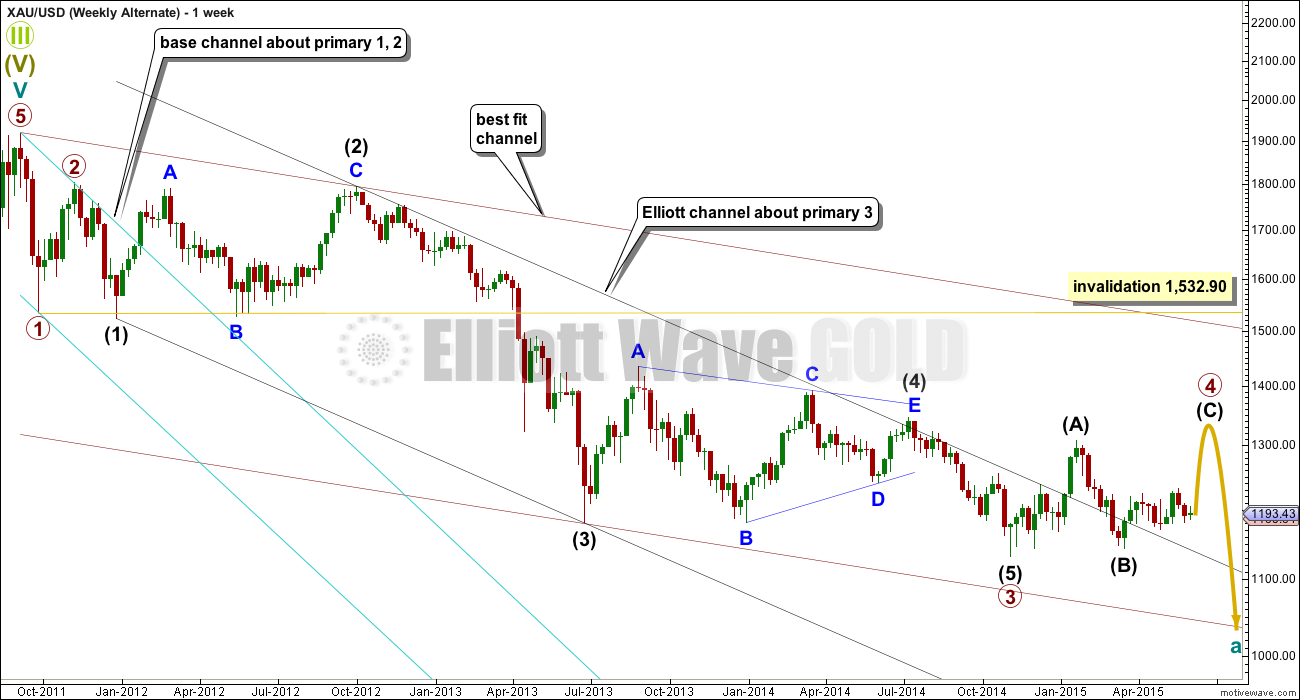
Gold edges up on Greece, economy concerns
June 2, 2015 11:30 a.m. ET
http://www.marketwatch.com/story/gold-edges-higher-as-dollar-pulls-back-2015-06-02
Any wave count anyone? Did gold just finish 1st wave up at 1195.48 and am in 2nd wave down now?
I have high 1196.4?
Different data feeds have slight difference, not a problem.
One Two Punch from EURO to US dollar has dollar down, Gold UP
http://www.marketwatch.com/story/dollar-hits-fresh-12-year-high-against-yen-2015-06-02-11033929
With this kind of support from the USD, you would expect gold to be flying high with a $20-30 up day. However, instead gold is behaving very sluggishly today. Current movement is not very 3rd wave like, if you ask me. Maybe it will be a delayed reaction. It’s like gold can’t believe that it has an open door and is just sitting and waiting. On the flipside, perhaps some serious selling is occurring today and any upward movements are being used as opportunities to dump gold. I’d be curious about today’s volume.
Its interesting that its not moving explosively in either direction. Seems like whenever an explosive move is supposed to happen, we get nothing but churn….
I think there was a 5 wave up from today’s low 1186.07 at 4:49 am to today’s high of 1195.48 at 9:17 am.
.618 retrace of that would be down at 1189.66 and gold may move lower than that?
Volume today as far as miners like GDX is concerned doesn’t appear high.
Link
Narrow trade range and inside day so far…. Whichever end of the range breaks will likely see continuation with thrust~!
Yes a break out up today since yesterday had a
Gold Forms Bullish Outside Day
http://www.kitco.com/news/2015-06-01/Gold-Forms-Bullish-Outside-Day-Watch-Dow-Theory-Divergence.html
Lara thanks again for your last chart 6th Technical Analysis as it provides important clarity in these trend less range bound times. Also the Daily Bear Alternate was great that you came up with it as it too provides clarity to any bearish move down. The quality of your overall presentation has increased, so my compliments to you for that.
I think it may be better to sell high them buy low daily since that is gold’s daily pattern. I am bullish on gold and happy that it only closed down $1.20 considering that 1st big US news 9:00 am was strong gold and 2nd and 3rd big US 10:00 am were both bullish US dollar and bearish gold.
All confidence levels have been achieved and Lara said upper trend line switched from resistance to support.
Without the trend this isn’t time for huge bet on bullish gold, however reasonable trade bullish looks good to me even though I wish gold would drop to 957 ASAP, but the odds of that are at low probability now, so I’ll trade what is presented, triple confirmed, supported and reasonable, and nimble trading and some daily profit taking at peaks if possible.
Hi Richard, so how nimlble were you this fine morning? I tried to exit NUGT at 11.40 on the return but didn’t get any execution, dropped price to 11.36 same result, gave up and am holding.
I did take some profits on GDX 7 cents off the earlier high today and have half left. Thought gold would drop more today to buy cheap but gold almost kept going up all day very slowly. I’ll just hold what I have overnight in case of overnight surprises.
Today was the day gold should have put in a green (white) candle. It did not. Plus did not close above 9ema resistance. Gold traded briefly above 9ema and closed below. That is not a good sign for longs. It may take few days may be. If gold trades below 1180 bear count is well and alive.
Holding below 1193 (pivot), Gold price appears to first be heading for a break below 1185 for possible 1183. I’d like to wait and see before engaging for the upside….
If that happens, there is no upside. Gold will quickly fall to 1140s.
Hi. Although Gold price continues to remain bearish, for various reasons (composite indicators) there is diminishing confidence in the downside and Gold price may not break below 1187, oversold stochastic is pointing for a price rise…. an up move through 1195-1200-03 for 1212 can likely be seen. One just has to play it cautiously. Personally my bias is for the downside where currently 1221 upside is seen as limiting….
Gold is at a major crossroads right now – it’s a do or die moment. I am ultimately bearish, but am open to a few days of upward movement first. Gold will show it’s direction in the coming hours. If it breaks below 1184-85, then downward movement should cascade another 40-50 dollars. If upward movement is to occur, it needs to happen immediately or it never will.
I agree, one has to be cautious and patient. It is not such a desperate situation just yet…. 1186-84 is providing good support thus far~! Time and price will tell.
Lara, what is your hourly chart for the alternate bear count looking like?
Posting that during this time of great importance for gold would be most helpful. Thanks.
I’ve just checked, it hasn’t been updated since 15th April. The EW picture is the same for both, so it really doesn’t change, but I’ll update it today anyway.
Lara, you’re probably really busy these days but I have a suggestion also. Do you think you could find a way to put up a page(separate page) to just the weekly charts which will show the current price data on them– maybe update weekly or every other with appropriate text. The request here is for weekly charts to have current price data and EW notations on them.
Look under historical analysis for Gold. There you’ll find the latest weekly charts. I’m linking back to them every day in the text analysis also.
It doesn’t change enough to warrant being done every week.
First target is 1142.82 for a 3rd wave.
i can’t see price going up in a sustained way until after NFP on Friday.