
Both Elliott wave counts expected downwards movement.
Summary: Both bull and bear wave counts expect more downwards movement. The bull count should see downwards movement unfold as a three; the bear expects a five down. If the bear is right, then it may be confirmed this week with a new low below 1,162.80; if that happens, then the target for downwards movement to end is at 1,093 for a third wave.
To see the bigger picture and weekly charts go here.
Changes to last analysis are italicised.
Bull Wave Count
Click chart to enlarge.
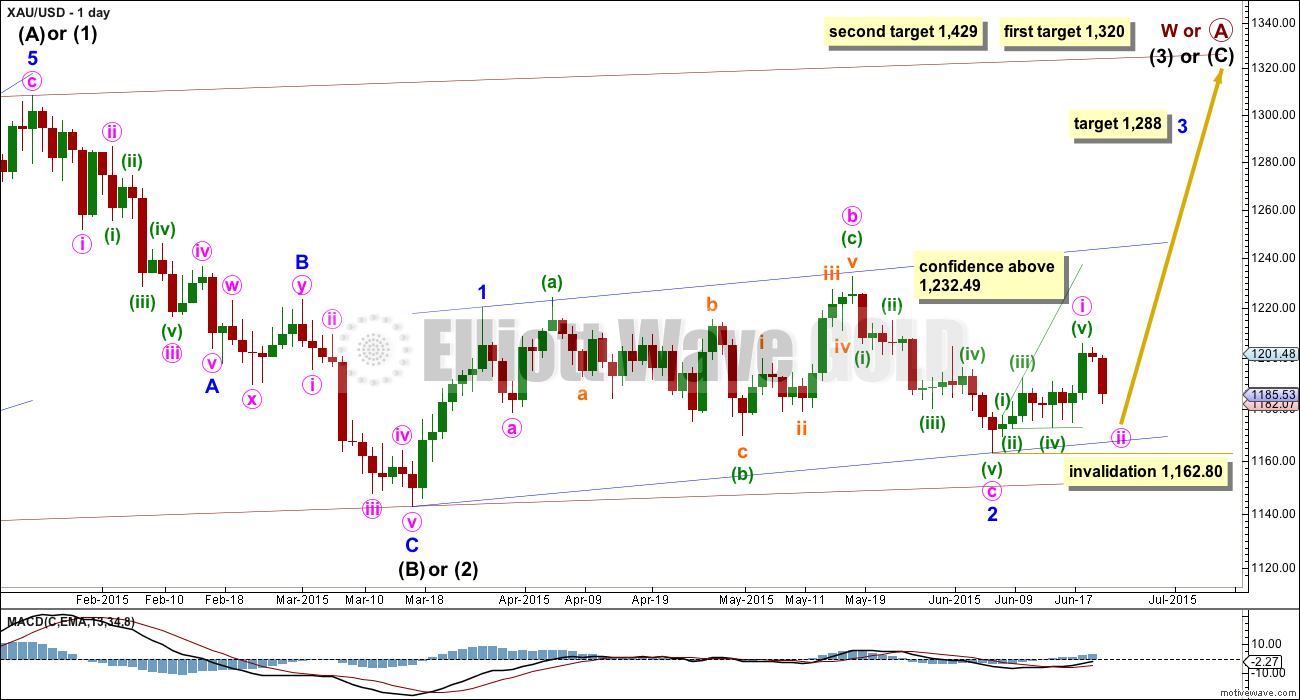
The bull wave count sees primary wave 5 and so cycle wave a a complete five wave impulse on the weekly chart.
Pros:
1. The size of the upwards move labelled here intermediate wave (A) looks right for a new bull trend at the weekly chart level.
2. The downwards wave labelled intermediate wave (B) looks best as a three.
3. The small breach of the channel about cycle wave a on the weekly chart would be the first indication that cycle wave a is over and cycle wave b has begun.
Cons:
1. Within intermediate wave (3) of primary wave 5 (now off to the left of this chart), to see this as a five wave impulse requires either gross disproportion and lack of alternation between minor waves 2 and 4 or a very rare running flat which does not subdivide well. I have tried to see a solution for this movement, and no matter what variation I try it always has a major problem.
2. Intermediate wave (5) of primary wave 5 (now off to the left of the chart) has a count of seven which means either minor wave 3 or 5 looks like a three on the daily chart.
3. Expanding leading diagonals (of which intermediate wave (A) or (1) is) are are not very common (the contracting variety is more common).
4. Volume does not support this bull wave count.
For volume to clearly support the bull wave count it needs to show an increase beyond 187.34 (30th April) and preferably beyond 230.3 (9th April) for an up day. Only then would volume more clearly indicate a bullish breakout is more likely than a bearish breakout.
Within cycle wave b, primary wave A may be either a three or a five wave structure. So far within cycle wave b there is a 5-3 and an incomplete 5 up. This may be intermediate waves (A)-(B)-(C) for a zigzag for primary wave A, or may also be intermediate waves (1)-(2)-(3) for an impulse for primary wave A. At 1,320 intermediate wave (C) would reach equality in length with intermediate wave (A) and primary wave A would most likely be a zigzag. At 1,429 intermediate wave (3) would reach 1.618 the length of intermediate wave (1) and primary wave A would most likely be an incomplete impulse.
Intermediate wave (A) subdivides only as a five. I cannot see a solution where this movement subdivides as a three and meets all Elliott wave rules (with the sole exception of a very rare triple zigzag which does not look right). This means that intermediate wave (B) may not move beyond the start of intermediate wave (A) below 1,131.09. That is why 1,131.09 is final confirmation for the bear wave count at the daily and weekly chart level.
Intermediate wave (C) is likely to subdivide as an impulse to exhibit structural alternation with the leading diagonal of intermediate wave (A). This intermediate wave up may be intermediate wave (3) which may only subdivide as an impulse.
Minor wave 2 is over here. Minute wave c is just 2.7 longer than 1.618 the length of minute wave a. At 1,288 minor wave 3 would reach 1.618 the length of minor wave 1.
Within minor wave 3, no second wave correction may move beyond its start below 1,162.80.
A new high above 1,232.49 would eliminate the bear wave count and provide full confidence in the targets.
Hourly Bull Wave Count
Click chart to enlarge.
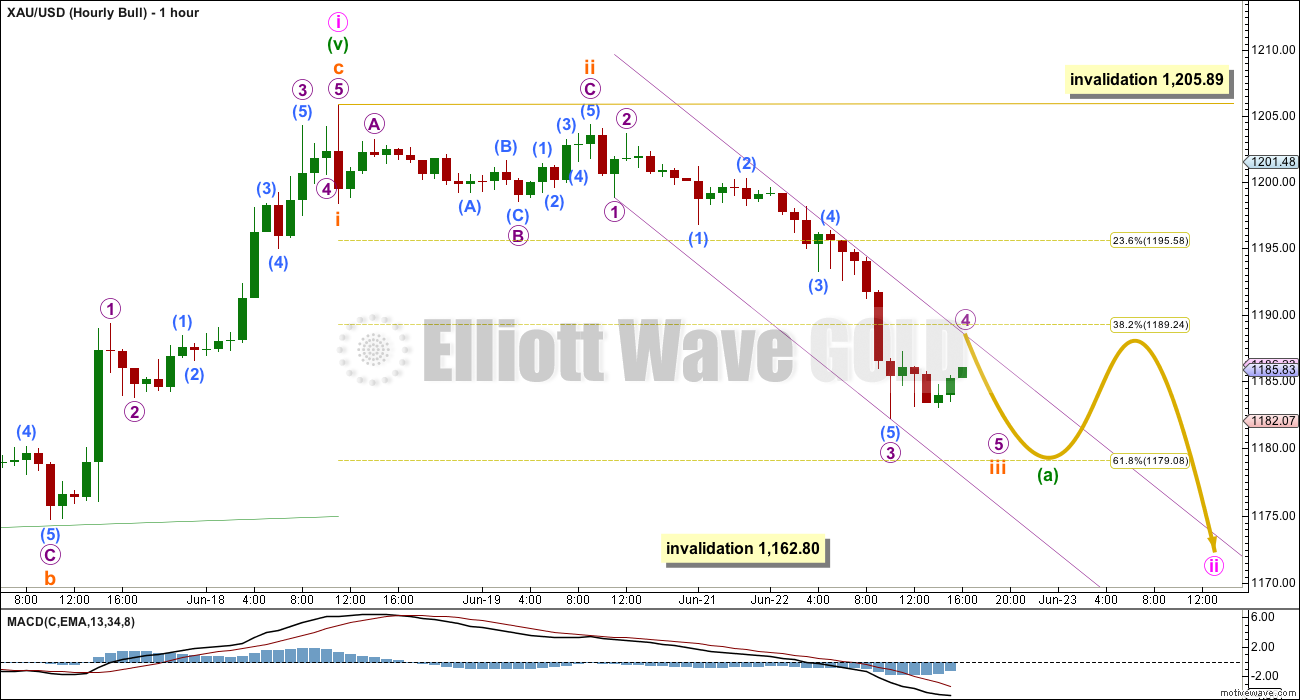
Minute wave ii looks like it is unfolding as the most likely structure, a zigzag.
Sometimes zigzags can look like impulses, if the B wave within them is quick and shallow, but more often zigzags have a clear three wave look to them because normally the B wave within a zigzag is somewhat in proportion to the A and C waves in terms of duration. It is likely that minute wave ii will have a clear three wave look to it at the daily and hourly chart level, which means when minuette wave (b) arrives it should show up as one or more green candlesticks or doji.
So far minuette wave (a) would be an incomplete impulse. It may end about the 0.618 Fibonacci ratio of minute wave i at 1,179.
Draw a best fit channel about minuette wave (a): draw the first trend line from the lows labelled micro waves 1 to 3, then place a parallel copy on the end of submicro wave (4). Micro wave 4 may end when price finds resistance at the upper trend line.
Micro wave 4 may not move into micro wave 1 price territory above 1,198.79.
When minuette wave (b) arrives, it may not move beyond the start of minuette wave (a) above 1,205.89. If minuette wave (a) completes as a five wave structure, then this invalidation point applies; but, if it completes only as a three, then the invalidation point does not apply because minute wave ii may yet unfold as a flat correction and minuette wave (b) within it may move beyond the start of minuette wave (a). A flat correction for minute wave ii has a lower probability than a zigzag.
Bear Wave Count
Click chart to enlarge.
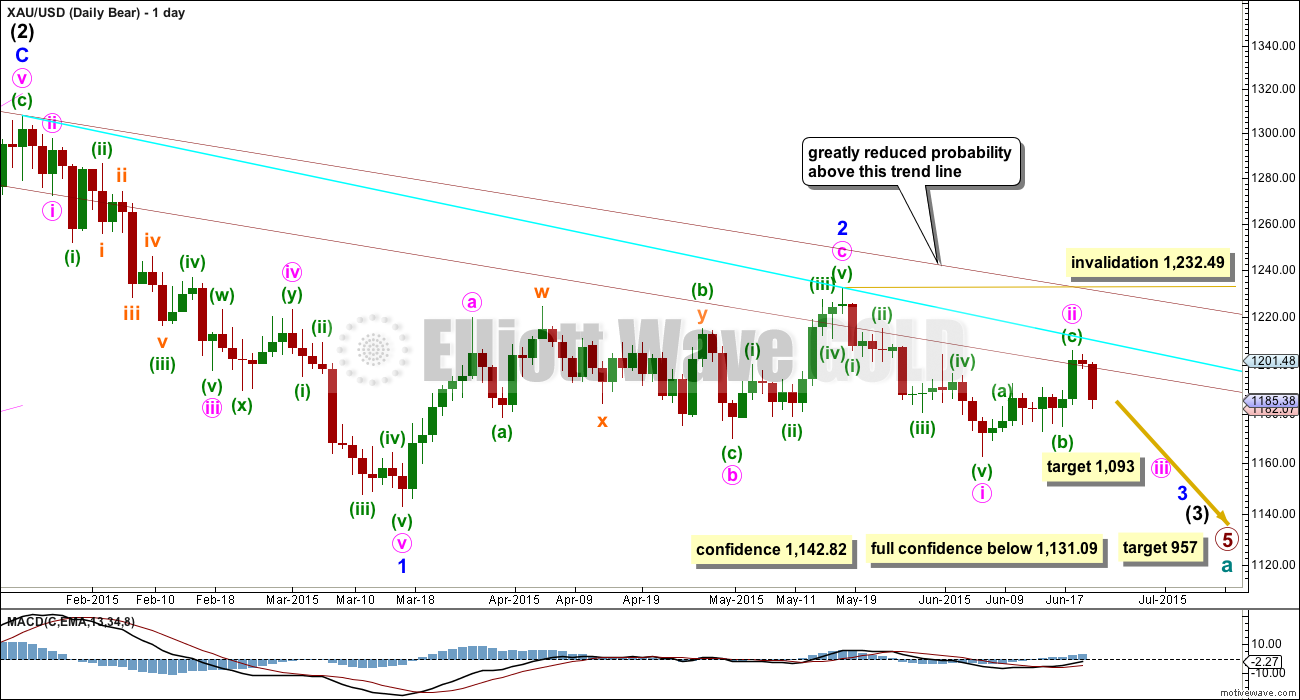
This wave count follows the bear weekly count which sees primary wave 5 within cycle wave a as incomplete. At 957 primary wave 5 would reach equality in length with primary wave 1.
Pros:
1. Intermediate wave (1) (to the left of this chart) subdivides perfectly as a five wave impulse with good Fibonacci ratios in price and time. There is perfect alternation and proportion between minor waves 2 and 4. For this piece of movement, the bear wave count has a much better fit than the bull wave count.
2. Intermediate wave (2) is a very common expanded flat correction. This sees minor wave C an ending expanding diagonal which is more common than a leading expanding diagonal.
3. Minor wave B within the expanded flat subdivides perfectly as a zigzag.
4. Volume at the weekly and daily chart continues to favour the bear wave count. Since price entered the sideways movement on 27th March it is a downwards week which has strongest volume, and it is downwards days which have strongest volume, five of them.
5. On Balance Volume on the weekly chart recently breached a trend line from back to December 2013. This is another bearish indicator.
Cons:
1. Intermediate wave (2) looks too big on the weekly chart.
2. Intermediate wave (2) has breached the channel from the weekly chart which contains cycle wave a.
3. Minor wave 2 is much longer in duration than a minor degree correction within an intermediate impulse normally is for Gold. Normally a minor degree second wave within a third wave should last only about 20 days maximum. This one is 44 days long.
4. Within minor wave 1 down, there is gross disproportion between minute waves iv and ii: minute wave iv is more than 13 times the duration of minute wave i, giving this downwards wave a three wave look.
Minor waves 1 and 2 are complete. Minute wave i within minor wave 3 may be incomplete on the hourly chart.
Minute wave ii may not move beyond the start of minute wave i above 1,232.49.
At this stage, a new low below 1,162.80 would provide a lot of confidence in the bear wave count. Further confidence would come with a new low below 1,142.82 and final confidence would come only with a new low below 1,131.09.
Minute wave ii is now very likely to be over here. If it moves any higher, then it should find strong resistance at the blue trend line.
Hourly Bear Wave Count
Click chart to enlarge.
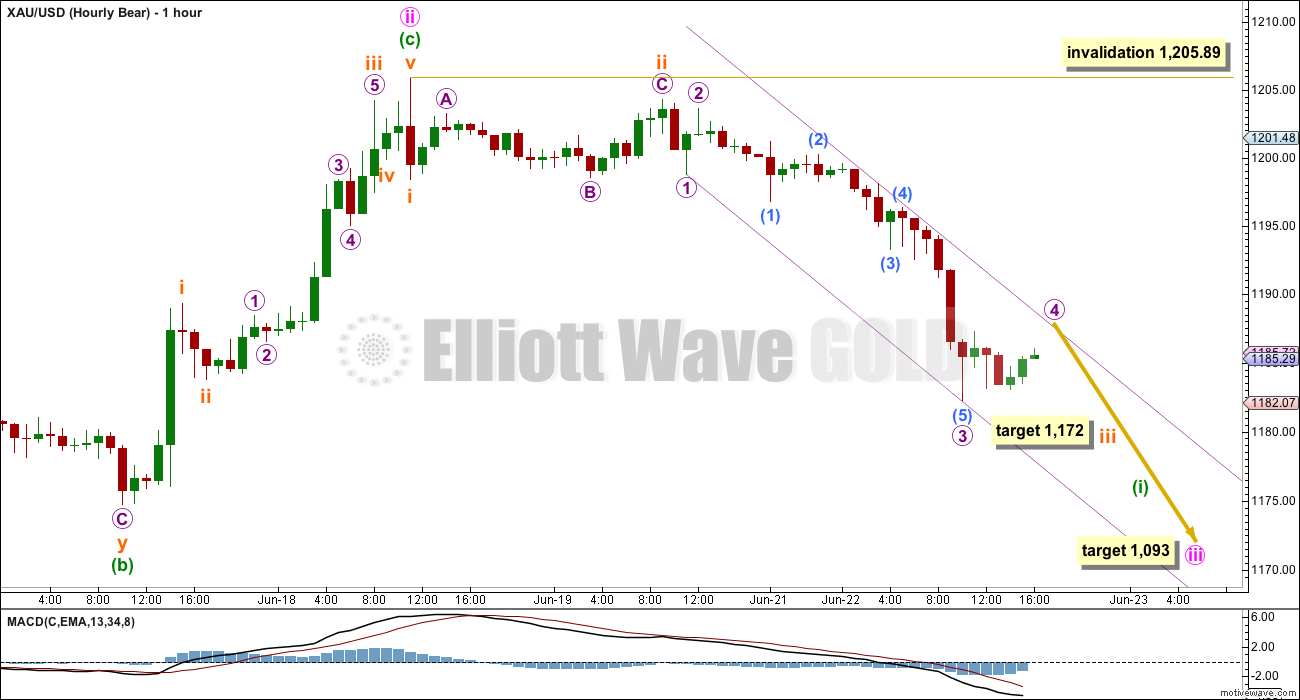
Downwards momentum has increased, but is not yet substantially stronger than that seen during minute wave i down. This bear wave count expects a further strong increase in downwards momentum.
For the bear wave count, minuette waves (i) and (ii) will subdivide 5-3, exactly the same as minuette waves (a) and (b) for the bull wave count. At this stage, the wave counts do not diverge in their short term expectations and they may not for another few days.
For this bear wave count, at 1,172 subminuette wave iii would reach 4.236 the length of subminuette wave i. Thereafter, another small correction for subminuette wave iv and a final wave down for subminuette wave v would complete an impulse for minuette wave (i). At that stage, both bull and bear wave counts would expect some upwards movement that may show up on the daily chart as a green candlestick or doji, which would be a second wave correction for this bear or a B wave for the bull.
At this stage, both wave counts require a five down to complete which may be achieved in one or possibly two days.
Minuette wave (ii) may not move beyond the start of minuette wave (i) above 1,205.89.
Technical Analysis
Click chart to enlarge.
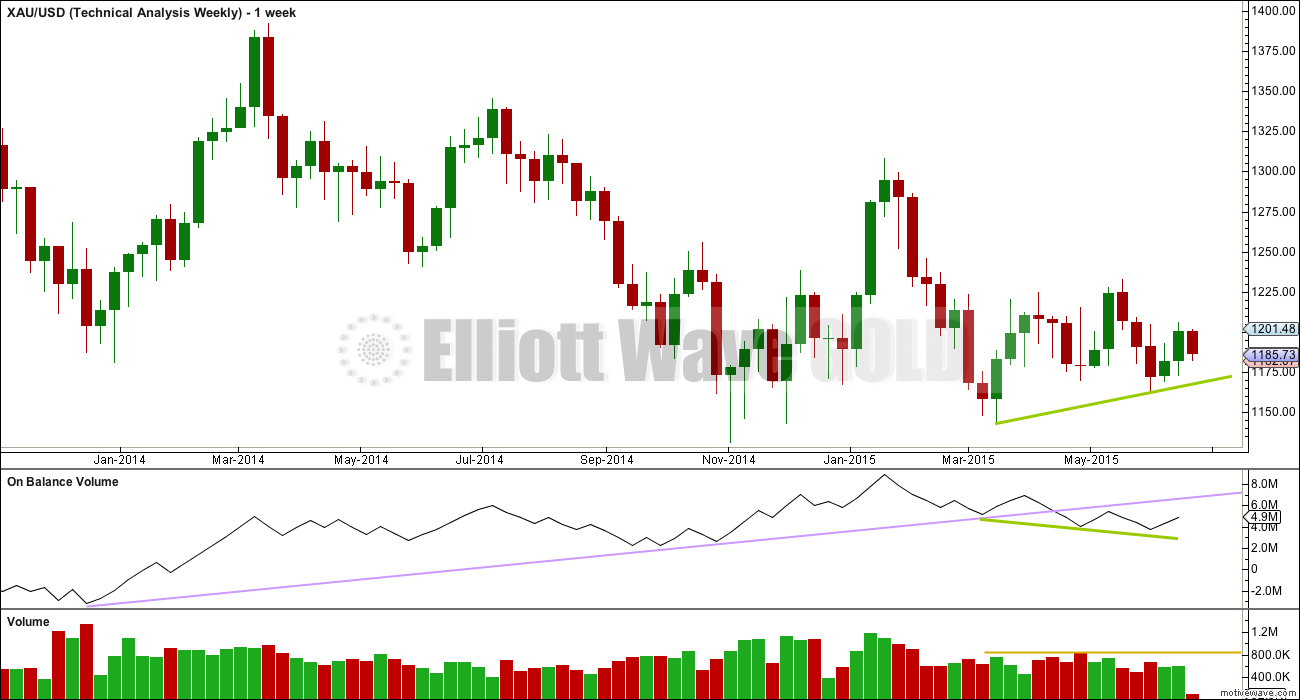
Weekly Chart: Overall volume still favours a downwards breakout eventually. During this sideways movement, it is still down days and a down week which have higher volume. On Balance Volume breaches a trend line (lilac line) which began in December 2013, and the breach is significant.
While price has made higher lows, On Balance Volume has made lower lows (green trend lines). This small rise in price is not supported by volume, and it is suspicious.
At the weekly chart level, volume consistently favours a bearish breakout: over the last three weeks, the two up weeks have lower volume than the prior down week; and, this pattern was also seen for prior moves within this sideways range, with the four down weeks from 29th March to 26th April stronger than the following two up weeks.
Click chart to enlarge.
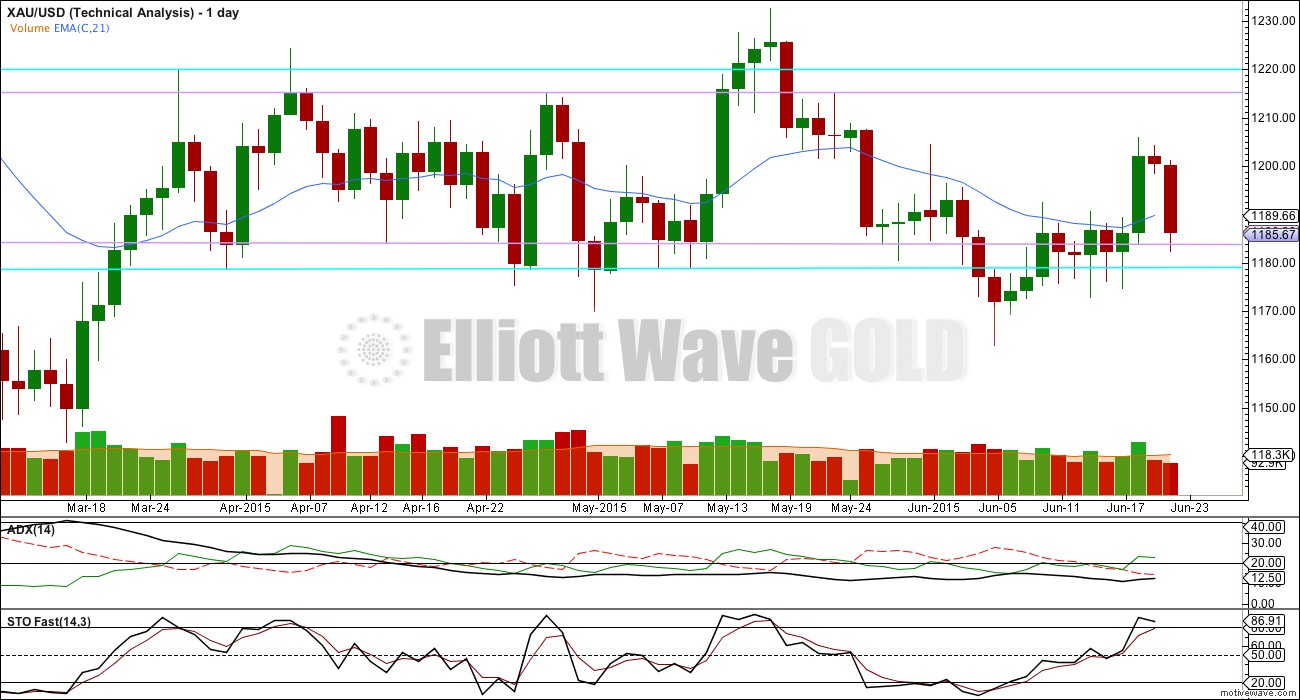
Daily Chart: ADX still indicates there is no clear trend. A range bound trading system would be better employed than a trend following system. Trading in a range bound market, as Gold has been in since the 27th of March, is inherently more risky than trading a trending market. Careful money management rules are essential to avoid wiping out your account. A good rule to follow would be to invest no more than 2% of the equity in your account on any one trade.
The range bound system illustrated here uses horizontal lines of support and resistance along with fast Stochastics to illustrate overbought and oversold. The idea is to expect the end of one swing and the start of another when price is at support or resistance and Stochastics is at oversold or overbought.
Stochastics is overbought, but price has not reached the upper horizontal trend lines providing resistance. A judgement must be made at this point: Should we expect this upwards swing to end only when price reaches resistance? And so expect Stochastics to remain overbought while price moves higher? Or is the upwards swing possibly over here?
The other consideration is that eventually price will break out of this range, of that we may be 100% confident. When it does, ADX may be slow to show the new trend and the breakout may come when this system would be expecting price to move in the opposite direction.
With the Elliott wave counts both expecting more downwards movement from here, and volume indicating a downwards breakout is more likely, I would advise extreme caution with this range bound trading approach. If price moves below the horizontal lines of support, then at this stage a downwards breakout may be more likely and the upwards swing this system expects may not happen.
There is slight cause for concern today in that volume is slightly lower than the prior down day. This is slightly suspicious because volume should be increasing if this downwards move is the start of something bigger. However, this is not absolutely necessary as the market can fall of its own weight.
This analysis is published about 05:58 p.m. EST.
Lara I was thinking gold might go up from 1176 to 1189 then down to 1172 or lower. Is that still in play but does gold have to drop to 1172 first before bouncing up maybe $20 before dropping lower?
I’m thinking so too Richard. I’ve just checked the five minute chart and I can now see a complete five wave impulse down.
I need to move the end of subminuette wave iii to 1,182. It was over yesterday. Today was the fifth wave down and it can be seen complete now. All the subdivisions fit perfectly on the 5 min chart.
So I’ll be expecting a second wave up for the bear, and a B wave up for the bull to about 1,188 or 1,195.
For the bear this up move may be quick and shallow, it is now very close to the middle of a third wave. There should be a really strong downwards pull now.
For the bull it should show up on the daily chart as one or more green candlesticks or doji so that minute wave ii has a clear three wave look to it on the daily chart.
I’m off to finish the analysis now.
I like the paths outlined Lara. It would see us move up for a few days as Silver options expire on Thursday, and then hard down into quarter end because metals always get slammed at quarter end.
Lara for a few days bear and bull were similar and now it seems like they will diverge.
They expect the same subdivisions next, the only divergence is in how quick or slow this correction may be.
But even if it lasts three days the bear is entirely valid still.
I’m just trying to offer a warning; if the bear count is correct then we may have surprises to the downside. The middle of a third wave is approaching.
On a rudimentary level – just looking at an hourly chart – doesn’t it appear that gold has just finished or is now finishing a clean 5 down from 1205? Wouldn’t that imply that a 2nd wave could be approaching soon? While I am assuming an eventual retracement to the 1180s, I don’t want to rule out that gold could make it as high as the low 1190s.
Looks to me as though we are in wave iv of 5 of 1
so one more low req IMO
The 1172 target looks very good
Yes, that’s what it looks like to me too. I’m going to take a close look at the 5 minute chart. Sometimes when Gold has swift strong fifth waves the fourth wave corrections are really quick. It makes Golds fives look like threes. So I’ll be checking for the fourth wave corrections on the 5 minute chart.
Edit: my reply is to Matt’s comment, not to Patrick’s comment.
I love this author and use it as a guide along with EW analysis. He suggests downside is very limited due to sentiment and COT data
http://www.safehaven.com/article/38044/gold-and-silver-update
This is my belief too, but it doesn’t mean we can’t drop another $100, I just don’t see it as likely, there are too many specs short right now.
The bear count seems much more plausible. I don’t think i of 5 will break below 1162. Market will
Keep us guessing. 1172 sounds perfect. I also except a string second wave. Atleast 50%
I think the gold will most likely continue its bullish elliot wave count, as you can see in the attached image, its showing a Wolf Wave pattern on the 4H chart, and it is trading exactly on the lower trend of the channel. i’m on the bullish side, with tight stops below the low, if my stops are done, i will buy again when the price goes back above the channel. good luck everyone 🙂
Was out most of the day. No changes in position today for me today, although I did by a small position in USLV on Friday and a small position in TMF which I am currently getting creamed on. Silver Options Sweet Spot for Thursday is $16.50 or maybe up to $17. GLD made the buying on weakness list. Metals futures open interest keeps rising. Interesting times!
Hi Ben. I think I know how to do this but just curious, what do you look at to determine options sweet spot for a given period?
Below is a link I go to, there is a graph somewhere that I find every once in a while, but this is where I usually check for futures. I look for the strike price that causes most options to expire worthless. Currently, that would be anywhere between $16.50 and $17.00, with a slight favor of $17. I added to my USLV this morning. I view this as a low risk trade, anything below $15.50-$15.75 will have too many put owners (specs) in the money.
I look here:
http://www.cmegroup.com/trading/metals/precious/silver_quotes_volume_voi.html?foi=O&marginsTab=INTRA&%3F%3F+SubSection%5B4%5D%2FSectionSublink%5B8%5D%2FExternal+=
Here is the open interest tool. Helps to visually see where the guard rails are. Make sure you click on the correct contract month (currently July for Silver this week)
http://www.cmegroup.com/tools-information/quikstrike/options-open-interest-profile-metals.html
Thanks very much Ben
Can anyone suggest what is the probable outcome when downward movement completes at 117x-116x and how far up Gold price can then be expected to go from there? As per above analysis clearly a break below 1162.80 suggests further downside. Thank you.
If the down move ends above 1162.80, then probabilities favor the bull scenario with targets 1288, 1320, and 1429 (per the daily bull chart).
Many thanks fencepost.
Well, in the bear count, iii target is 1172, and then it may only get a 23% or 38% retrace because of the downward pull. In the bull count, your first stop is probably in the 1230-1240 range that we have been talking about since there was snow on the ground. I will be long unless we break 1162. Way too many silver spec shorts right now.
Ben: Thanks for your views and input. For now 1182 appears to be holding the downside. A break below there would likely look to target 1168-67 but I am not too sure with the lower band at 1171-70…. The upside does not appear to be going anywhere with 1203-04 limiting (requires a break above 1188), but I am not too sure Gold price can get that far up with the upper band having dropped to 1200-1199…. Tight range~!
Bullish hourly in video Lara mentions (a) 1179 then (b) 1189 with invalidation 1205.89, then (c) maybe below 1170.
Syed. Just back. Seeing that the drop was lowest at 1176.84, and the next move up is a fourth wave, I will say the rise would reach 1184-1186 before dropping again. It is going to be a series of fourth and fifth waves for a while.
Sorry, only one fourth and one fifth wave. Thereafter it is the larger correction up as per the other replies to your query.
There is also the possibility that the third wave is not over yet at 1176.34.
Thank you so much for your help @Alan. I got that what you say about fourth and fifth wave… Doesn’t look to me that Gold price can get past 1180-81 with 1183-85 on the outside at this stage. Remains to be seen if 1168-67 can be taken out on the downside…. I would look to take money off the table at the lower band at 1171-70….
Lara, your analysis is a huge breath of fresh air in the confusion surrounding gold’s movement.
Thanks Richard!