
Both Elliott wave counts expected more downwards movement.
Price fell 4.35 short of the short term target on the hourly bear Elliott wave count.
Summary: A little upwards movement should now unfold for both bull and bear wave counts. Upwards movement for the bear wave count may be quick and shallow, and may not show up on the daily chart due to the strong downwards pull of the middle of a big third wave. Upwards movement for the bull wave count may show up on the daily chart as one to three green candlesticks or doji. For both bull and bear hourly wave counts, at this time the invalidation point is at 1,205.89.
To see the bigger picture and weekly charts go here.
Changes to last analysis are italicised.
Bull Wave Count
Click chart to enlarge.
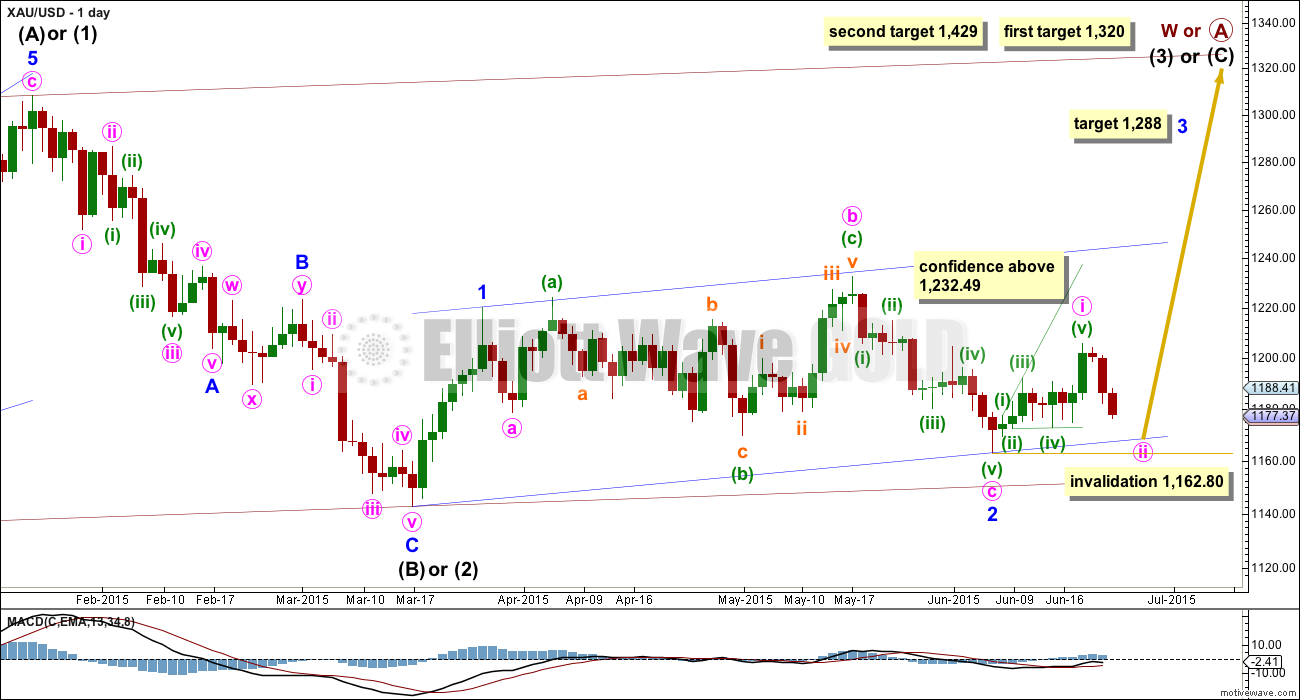
The bull wave count sees primary wave 5 and so cycle wave a a complete five wave impulse on the weekly chart.
Pros:
1. The size of the upwards move labelled here intermediate wave (A) looks right for a new bull trend at the weekly chart level.
2. The downwards wave labelled intermediate wave (B) looks best as a three.
3. The small breach of the channel about cycle wave a on the weekly chart would be the first indication that cycle wave a is over and cycle wave b has begun.
Cons:
1. Within intermediate wave (3) of primary wave 5 (now off to the left of this chart), to see this as a five wave impulse requires either gross disproportion and lack of alternation between minor waves 2 and 4 or a very rare running flat which does not subdivide well. I have tried to see a solution for this movement, and no matter what variation I try it always has a major problem.
2. Intermediate wave (5) of primary wave 5 (now off to the left of the chart) has a count of seven which means either minor wave 3 or 5 looks like a three on the daily chart.
3. Expanding leading diagonals (of which intermediate wave (A) or (1) is) are are not very common (the contracting variety is more common).
4. Volume does not support this bull wave count.
For volume to clearly support the bull wave count it needs to show an increase beyond 187.34 (30th April) and preferably beyond 230.3 (9th April) for an up day. Only then would volume more clearly indicate a bullish breakout is more likely than a bearish breakout.
Within cycle wave b, primary wave A may be either a three or a five wave structure. So far within cycle wave b there is a 5-3 and an incomplete 5 up. This may be intermediate waves (A)-(B)-(C) for a zigzag for primary wave A, or may also be intermediate waves (1)-(2)-(3) for an impulse for primary wave A. At 1,320 intermediate wave (C) would reach equality in length with intermediate wave (A) and primary wave A would most likely be a zigzag. At 1,429 intermediate wave (3) would reach 1.618 the length of intermediate wave (1) and primary wave A would most likely be an incomplete impulse.
Intermediate wave (A) subdivides only as a five. I cannot see a solution where this movement subdivides as a three and meets all Elliott wave rules (with the sole exception of a very rare triple zigzag which does not look right). This means that intermediate wave (B) may not move beyond the start of intermediate wave (A) below 1,131.09. That is why 1,131.09 is final confirmation for the bear wave count at the daily and weekly chart level.
Intermediate wave (C) is likely to subdivide as an impulse to exhibit structural alternation with the leading diagonal of intermediate wave (A). This intermediate wave up may be intermediate wave (3) which may only subdivide as an impulse.
Minor wave 2 is over here. Minute wave c is just 2.7 longer than 1.618 the length of minute wave a. At 1,288 minor wave 3 would reach 1.618 the length of minor wave 1.
Within minor wave 3, no second wave correction may move beyond its start below 1,162.80.
A new high above 1,232.49 would eliminate the bear wave count and provide full confidence in the targets.
Hourly Bull Wave Count
Click chart to enlarge.
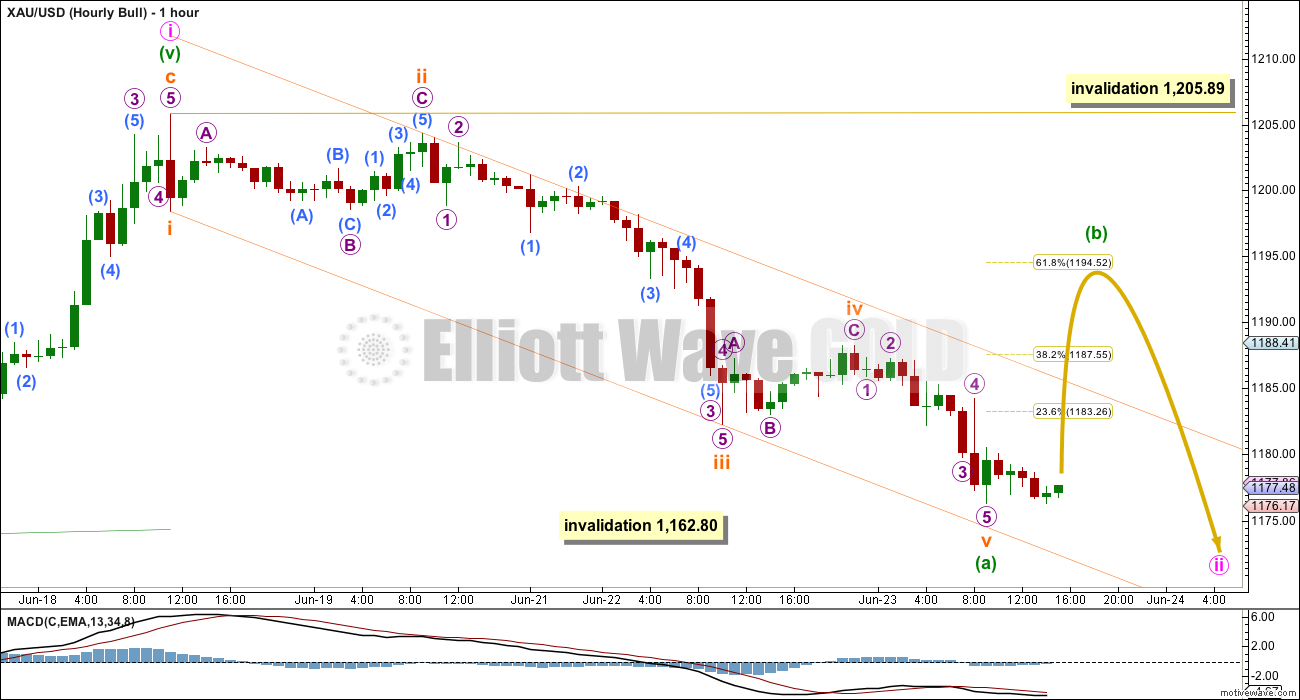
Minute wave ii is unfolding as a zigzag. Minuette wave (a) within it is now complete.
Ratios within minuette wave (a) are: there is no adequate Fibonacci ratio between subminuette waves i and iii, and subminuette wave v is 0.32 short of 1.618 the length of subminuette wave i.
Minuette wave (b) must subdivide as a corrective structure, and may not move beyond the start of minuette wave (a) above 1,205.89.
Minute wave ii should look like a clear three wave structure on the daily chart, so minuette wave (b) would be likely to last one to three days and show up as one or more green candlesticks or doji on the daily chart.
Minuette wave (b) would be most likely to end about the 0.382 or 0.618 Fibonacci ratios of minuette wave (a) at either 1,183 or 1,195.
Bear Wave Count
Click chart to enlarge.
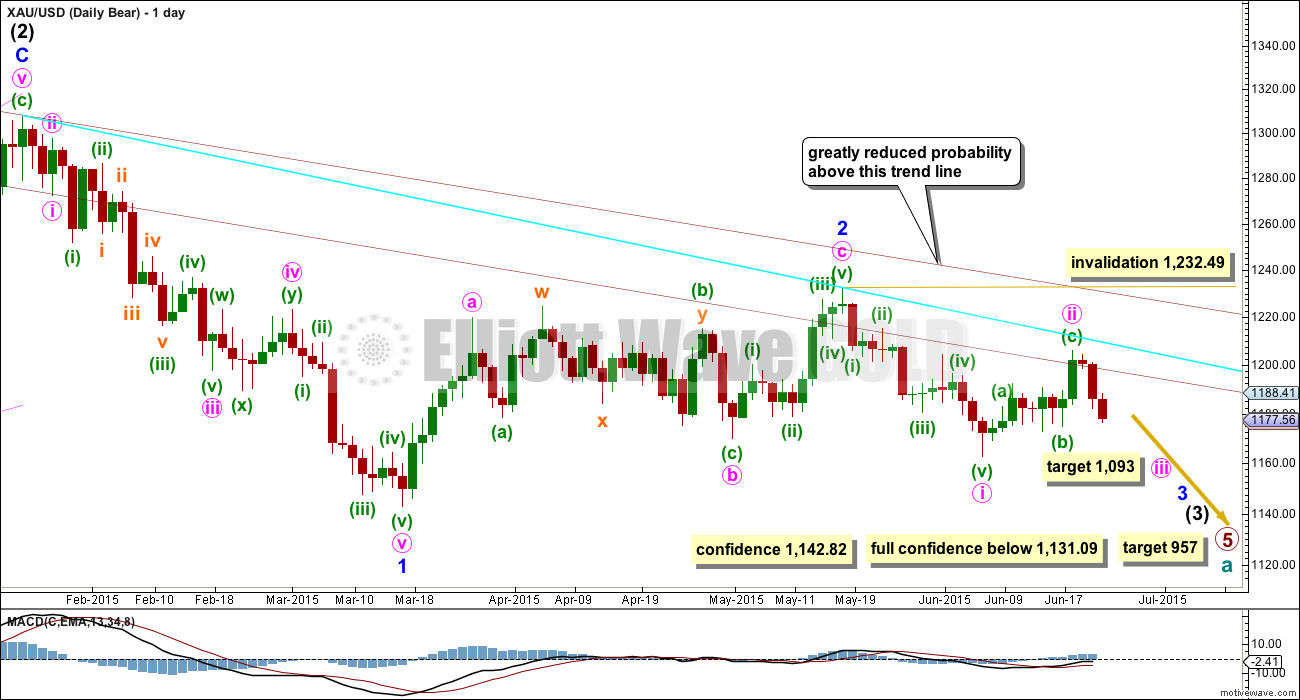
This wave count follows the bear weekly count which sees primary wave 5 within cycle wave a as incomplete. At 957 primary wave 5 would reach equality in length with primary wave 1.
Pros:
1. Intermediate wave (1) (to the left of this chart) subdivides perfectly as a five wave impulse with good Fibonacci ratios in price and time. There is perfect alternation and proportion between minor waves 2 and 4. For this piece of movement, the bear wave count has a much better fit than the bull wave count.
2. Intermediate wave (2) is a very common expanded flat correction. This sees minor wave C an ending expanding diagonal which is more common than a leading expanding diagonal.
3. Minor wave B within the expanded flat subdivides perfectly as a zigzag.
4. Volume at the weekly and daily chart continues to favour the bear wave count. Since price entered the sideways movement on 27th March it is a downwards week which has strongest volume, and it is downwards days which have strongest volume, five of them.
5. On Balance Volume on the weekly chart recently breached a trend line from back to December 2013. This is another bearish indicator.
Cons:
1. Intermediate wave (2) looks too big on the weekly chart.
2. Intermediate wave (2) has breached the channel from the weekly chart which contains cycle wave a.
3. Minor wave 2 is much longer in duration than a minor degree correction within an intermediate impulse normally is for Gold. Normally a minor degree second wave within a third wave should last only about 20 days maximum. This one is 44 days long.
4. Within minor wave 1 down, there is gross disproportion between minute waves iv and ii: minute wave iv is more than 13 times the duration of minute wave i, giving this downwards wave a three wave look.
Minor waves 1 and 2 are complete. Minute wave i within minor wave 3 may be incomplete on the hourly chart.
Minute wave ii may not move beyond the start of minute wave i above 1,232.49.
At this stage, a new low below 1,162.80 would provide a lot of confidence in the bear wave count. Further confidence would come with a new low below 1,142.82 and final confidence would come only with a new low below 1,131.09.
Minute wave ii is now very likely to be over here. If it moves any higher, then it should find strong resistance at the blue trend line.
Hourly Bear Wave Count
Click chart to enlarge.
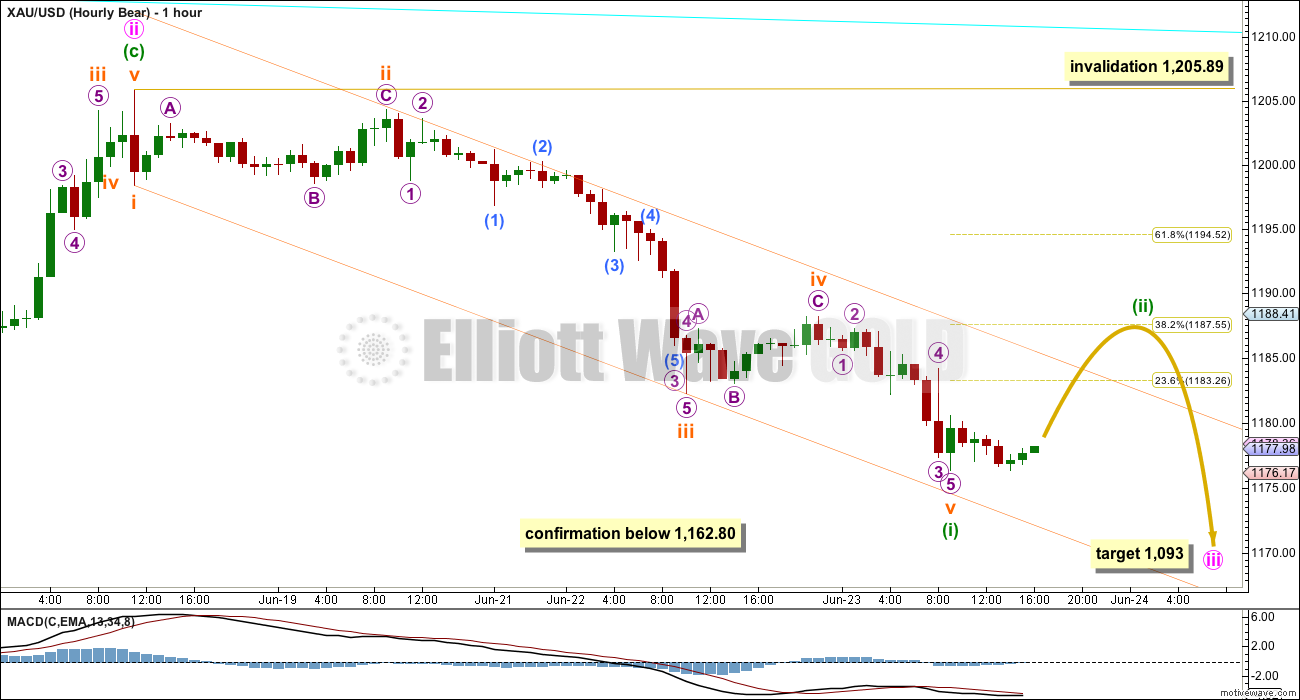
The subdivisions for A-B-C of a zigzag and the subdivisions of 1-2-3 within an impulse are exactly the same. Therefore, there is no divergence between the expected direction for hourly bull and bear wave counts at this stage.
This bear wave count expects to now see a small second wave correction move higher. There should be a strong downwards pull from the middle of intermediate wave (3), which is now very close and may be strong enough for minuette wave (ii) to be more brief and shallow than a second wave correction normally is. The small correction may show up on the daily chart as at least one green candlestick, but it does not have to and may be quick enough to not show on the daily chart.
Minuette wave (ii) may end about the 0.382 or 0.618 Fibonacci ratios, favouring the 0.382 Fibonacci ratio at 1,187 in this instance.
Minuette wave (ii) may not move beyond the start of minuette wave (i) above 1,205.89.
Draw a channel using Elliott’s technique about minuette wave (i) as shown. When this channel is clearly breached by upwards / sideways movement, that shall provide trend channel confirmation that minuette wave (i) was over and minuette wave (ii) is underway. Minuette wave (ii) must subdivide as a corrective structure (the only corrective structure a second wave may not be in its entirety is a triangle).
When the channel is breached and a clear three wave structure can be seen, then look out for the possibility that minuette wave (ii) could be over there. The next wave down for minuette wave (ii) must give confirmation of the bear wave count with a new low below 1,162.80, if indeed this is the correct count.
Technical Analysis
Click chart to enlarge.
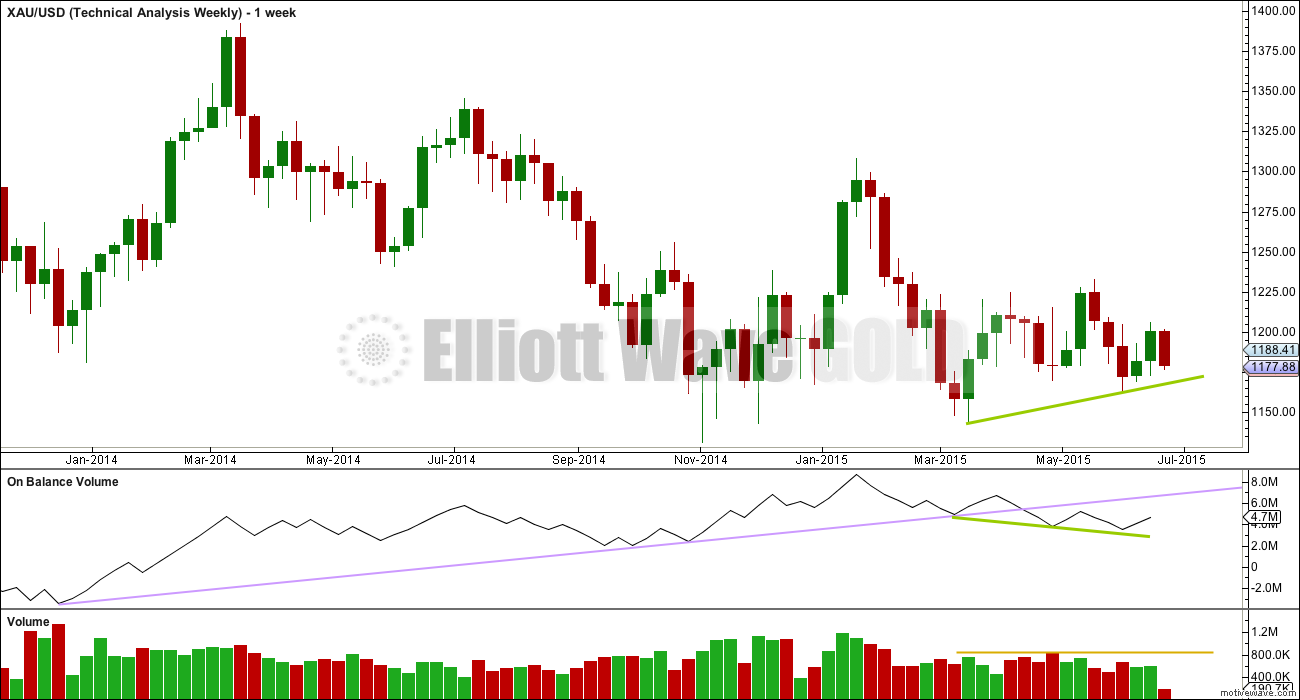
Weekly Chart: Overall volume still favours a downwards breakout eventually. During this sideways movement, it is still down days and a down week which have higher volume. On Balance Volume breaches a trend line (lilac line) which began in December 2013, and the breach is significant.
While price has made higher lows, On Balance Volume has made lower lows (green trend lines). This small rise in price is not supported by volume, and it is suspicious.
At the weekly chart level, volume consistently favours a bearish breakout: over the last three weeks, the two up weeks have lower volume than the prior down week; and, this pattern was also seen for prior moves within this sideways range, with the four down weeks from 29th March to 26th April stronger than the following two up weeks.
Click chart to enlarge.
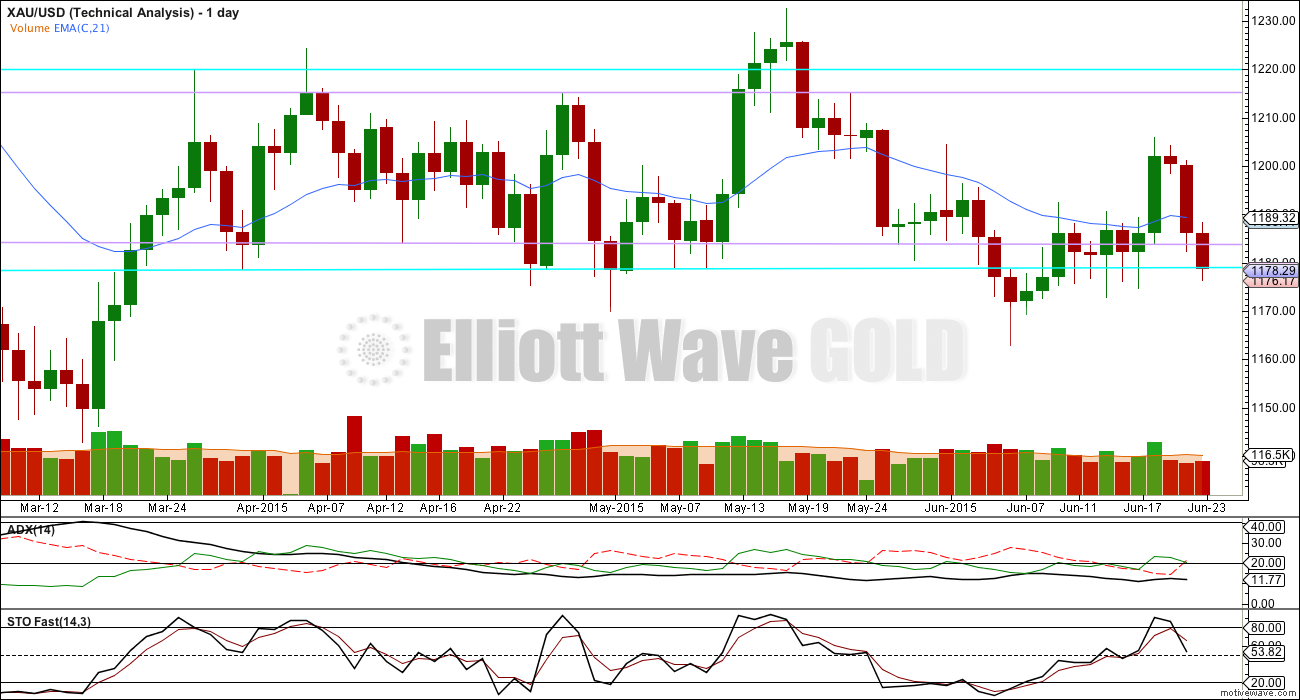
Daily Chart: ADX still indicates there is no clear trend. A range bound trading system would be better employed than a trend following system. Trading in a range bound market, as Gold has been in since the 27th of March, is inherently more risky than trading a trending market. Careful money management rules are essential to avoid wiping out your account. A good rule to follow would be to invest no more than 2% of the equity in your account on any one trade.
The range bound system illustrated here uses horizontal lines of support and resistance along with fast Stochastics to illustrate overbought and oversold. The idea is to expect the end of one swing and the start of another when price is at support or resistance and Stochastics is at oversold or overbought.
Stochastics reached overbought four days ago, but price did not reach resistance and has turned strongly down. Again, this illustrates why trading this market is so risky when using this method, because it is impossible to tell exactly where one swing ends and the other begins; it is only possible to get a general idea.
Eventually Gold will break out of this range it entered on 27th March; a breakout is 100% certain. What is uncertain is what direction the breakout will be. When the breakout comes, then this range trading system will be expecting a move in the opposite direction and the final swing will never come. Additionally, ADX may be slow to indicate the existence of a trend when it finally arrives, which again illustrates why trading this market is so risky.
Gold has been within this range now for 62 days. The longer price remains in this range the closer the breakout will be and the risker it is to expect the sideways swings to continue.
The weight of volume indicators is pointing to a downwards breakout as more likely. This is not definitive and only is indicative. Extreme caution is advised, particularly with any trades to the upside at this stage.
I am a little concerned that volume for the last three down days is low. This fall in price is suspicious and not supported by volume. However, it is not essential for downwards movements to be supported by an increase in volume, because the market may fall of its own weight, and the market does not require an increase in sellers so an increase in volume, because an absence of buyers can see price fall on low volume.
This analysis is published about 05:34 p.m. EST.
June 24th analysis is published about 06:44 p.m. EST.
I have two ideas this morning I’m working on, and this may change as I continue to look at the five and one minute charts.
Minuette wave (i) or (a) may be over at todays low. That does fit. But I’m concerned that last drop down to todays low fits so well on the one minute chart as a five, and doesn’t fit as a three. So I’m considering alternates.
Minuette wave (i) or (a) may be over as labelled in the charts above and todays low could be wave B or X within the correction for minuette wave (ii) or (b).
Either way, a correction against this downwards trend is due either now or very soon indeed.
It’s possible also that subminuette wave iii just ended at todays low.
Subminuette wave iv may be a complete triangle.
That would give a target for subminuette wave v to end a five wave impulse down at 1,168.
Overall of the various ideas I’ve worked on this morning this has the best fit at the hourly chart level.
Lara has minuette (i) completion target been lowered to 1169-68? Has it changed the time frame for below 1162.80? What is upper target range before and after 1162 area? Thank you, you’re the best!
Yes, it may now complete at 1,168.
The target for the following move up really shouldn’t be calculated until the downwards move is complete, confirmed and the length is known.
Way too much guesswork is involved otherwise.
I have another idea (lower probability) which sees the second or B wave underway now, to end up at 1,187.
I read you @Alan, thanks: I am just wondering, with 1170 holding, if Gold price will be able to break above 1176-80 to open up 1189 (and possibly higher if break above here)…. Waiting for Gold price to resolve itself; my bias remains for the downside for a break below 1161-60….
No Trend Channel Confirmation of upper orange trend line on hourly charts yet that minuette wave (b) or (ii) up has begun.
Today’s low of 1,170.29 at 8:44 am may have been the bottom of an extended 5th wave for minuette (a) or (i). Would need to see at least 1 hourly candlestick above the upper orange downslope trendline at about 1,180 to confirm minuette (b) or (ii) has begun, which may have started at 1,170.29 and go up to either 1,187.55 or 1,194.52 with neither preferred.
Any wave counts or opinions?
Yes, whether one is a bull or a bear, realize that the 0.618 retracement of 1205 to 1170 does not even reach 1194.52. Lara may lower that number today.
Richard. I think the low at 1170.29 was micro 3. Now, we are grinding along a triangle in micro 4, with its d wave underway. There should be one more drop to complete micro 5 / subminuette 5 / minuette 1. I can’t place the exact value of the drop as the triangle is not completed yet. It should be lower than 1170.29 but higher than 1162.80 as the bull count shouldn’t be invalidated so soon.
Alan Tham – Thanks for your wave count as I was thinking of buying GDX to move up to 1183.89 or 1192.29 based on 1170.29 being minuette (i).
Instead I’ll wait for gold to drop more in this extended wave v down to end minuette (i) between your 1170.29 and 1162.80 or else get Lara’s comments before close before that may happen. I wouldn’t want to hold anything bullish overnight as Lara’s warning of the risk of surprise breakout downward.
Richard. The long miners are rising very slowly these few days compared to the shorts. It is possible that demand for longs are not there. Maybe the bulk of the traders are bearish.
Tham, the momentum of the miners can be like turning around the Titanic. However they always end up following or occasionally leading gold. I’ve followed GDX and GDXJ and their 3X ETFs for 18 months and seen their idiosyncrasies. I like to take advantage of strong momentum or lack of it when I buy and sell. I’m still waiting to buy. Let’s see Lara’s comments today.
We’ll see what Lara says, but 1166 seems like a reasonable target. That would see the 5th wave equal the length of the 3rd wave.
Again, this is only if gold does move lower.
Lara’s count was correct, except that the fifth wave was extended. Proportions look healthy.
Matt, are you saying the aprox 1168 gold just made was the end of an extended 5th and now the move is up?
I really don’t like calling short term bottoms, but we are definitely nearing a time for a minor correction.
That said, any small bounce should be used as an opportunity to dump longs and add to shorts. After gold retraces some (probably 1180s) – 1190s looking less likely now – the next leg down will be swift and enormous. I wouldn’t be surprised in the near future if gold moved $30-50 while half of us were sleeping. Gold likely will blow right through 1162 this time.
Again, a small bounce may be coming soon. However, it should be seen as a last chance to get on or off the train.
Matt, thanks.
By the way, I never saw 1168. Depending on your datafeed, the current low is approx. 1170. After reviewing charts again, I would remain open to a drop as low as 1165 before gold turns up. Not saying for sure that gold will drop further right now, but, if it did, 1165 should be the limit.
Was that it the drop to 1173.60 or is there more downside expected to follow? It is my sentiment that the pullback (drop) should look to seek a break below 1169-68 thus still holding shorts…. Tricky situation~!
As I surmised yesterday, 1176.34 was not the final drop. That could have been 1173.98. Unless the fifth wave becomes extended, the drop should be done, and we are heading towards a slightly lowered 1186/1194. Let’s see how this plays out today.
Thanks Alan: Well if Gold price does rise past 1180-81, it ought not to get past 1190-93, if it does then likely will make a run for 1203-04….
Syed. Your prediction about a drop to as low as 1169-1168 proves to be accurate. I revised the count in the light of further developments. Please see my reply to Richard above.
The current low looks to me like it could hold. There was a good bounce too, which may continue to form a nice wick/tail to end a multi day drop. The pop won’t last long though!
See revised comment above.
Hi Lara,
I’d love a silver update when you have a chance. No rush, just wanted to get the request out there.
Thanks.
Here’s a Rambus public update on silver.
http://rambus1.com/?p=39544
Okay. Will try to do that today. And GDX.
Fabulous! Thanks!
Wednesday 8:30 am US GDP News
WEDNESDAY, JUNE 24
8:30 am GDP 1Q -0.2% -0.7%
http://www.marketwatch.com/Economy-Politics/Calendars/Economic