
Both Elliott wave counts expected a little upwards movement, which may have been quick and brief, but price moved lower after a little sideways movement.
Summary: A small correction is either underway or due very soon indeed. Today’s long lower wick on the red candlestick is slightly bullish. What is most likely is that a new low about 1,168 will be seen before the correction begins. If the correction has already begun, then the target for it to end is at 1,187. The channel on the hourly chart should be used to indicate when the correction arrives: assume the trend remains down until that channel is breached.
To see the bigger picture and weekly charts go here.
Changes to last analysis are italicised.
Bull Wave Count
Click chart to enlarge.
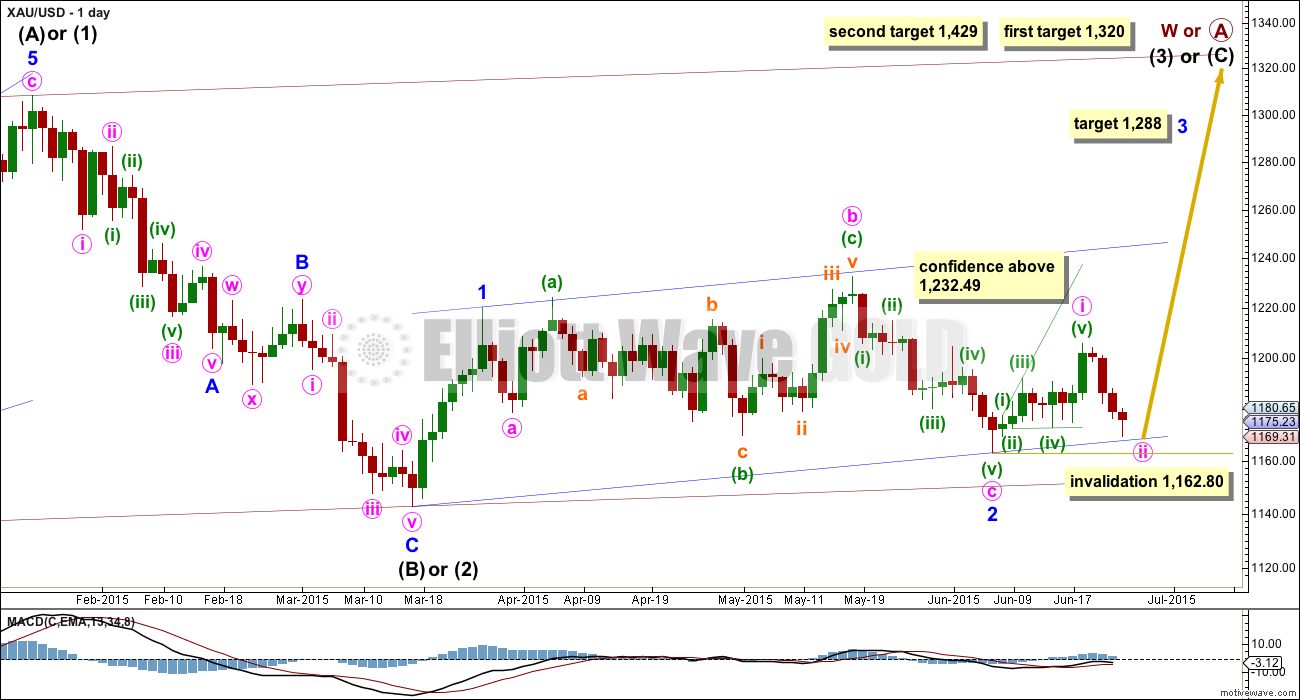
The bull wave count sees primary wave 5 and so cycle wave a a complete five wave impulse on the weekly chart.
Pros:
1. The size of the upwards move labelled here intermediate wave (A) looks right for a new bull trend at the weekly chart level.
2. The downwards wave labelled intermediate wave (B) looks best as a three.
3. The small breach of the channel about cycle wave a on the weekly chart would be the first indication that cycle wave a is over and cycle wave b has begun.
Cons:
1. Within intermediate wave (3) of primary wave 5 (now off to the left of this chart), to see this as a five wave impulse requires either gross disproportion and lack of alternation between minor waves 2 and 4 or a very rare running flat which does not subdivide well. I have tried to see a solution for this movement, and no matter what variation I try it always has a major problem.
2. Intermediate wave (5) of primary wave 5 (now off to the left of the chart) has a count of seven which means either minor wave 3 or 5 looks like a three on the daily chart.
3. Expanding leading diagonals (of which intermediate wave (A) or (1) is) are are not very common (the contracting variety is more common).
4. Volume does not support this bull wave count.
For volume to clearly support the bull wave count it needs to show an increase beyond 187.34 (30th April) and preferably beyond 230.3 (9th April) for an up day. Only then would volume more clearly indicate a bullish breakout is more likely than a bearish breakout.
Within cycle wave b, primary wave A may be either a three or a five wave structure. So far within cycle wave b there is a 5-3 and an incomplete 5 up. This may be intermediate waves (A)-(B)-(C) for a zigzag for primary wave A, or may also be intermediate waves (1)-(2)-(3) for an impulse for primary wave A. At 1,320 intermediate wave (C) would reach equality in length with intermediate wave (A) and primary wave A would most likely be a zigzag. At 1,429 intermediate wave (3) would reach 1.618 the length of intermediate wave (1) and primary wave A would most likely be an incomplete impulse.
Intermediate wave (A) subdivides only as a five. I cannot see a solution where this movement subdivides as a three and meets all Elliott wave rules (with the sole exception of a very rare triple zigzag which does not look right). This means that intermediate wave (B) may not move beyond the start of intermediate wave (A) below 1,131.09. That is why 1,131.09 is final confirmation for the bear wave count at the daily and weekly chart level.
Intermediate wave (C) is likely to subdivide as an impulse to exhibit structural alternation with the leading diagonal of intermediate wave (A). This intermediate wave up may be intermediate wave (3) which may only subdivide as an impulse.
Minor wave 2 is over here. Minute wave c is just 2.7 longer than 1.618 the length of minute wave a. At 1,288 minor wave 3 would reach 1.618 the length of minor wave 1.
Within minor wave 3, no second wave correction may move beyond its start below 1,162.80.
A new high above 1,232.49 would eliminate the bear wave count and provide full confidence in the targets.
Hourly Bull Wave Count
Click chart to enlarge.
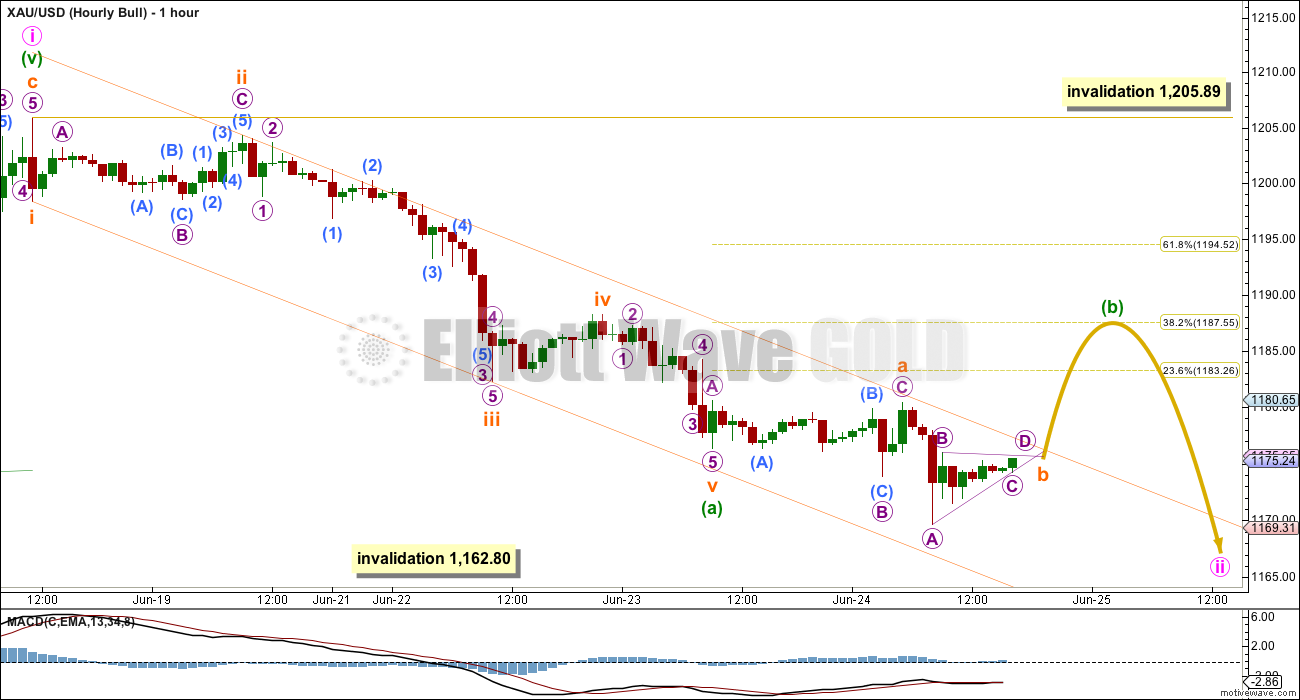
I have two ideas for the hourly chart for you today, and both of them work for the bull and bear wave counts in exactly the same way.
This first idea presented here has a lower probability, but I am considering it because the subdivisions fit absolutely perfectly on the five and one minute charts.
Minuette wave (a), or for the bear count minuette wave (i), may have been over as labelled for yesterday’s analysis. Minuette wave (b) may have begun there as an expanded flat correction.
Within minuette wave (b), subminuette wave a is itself an expanded flat. Because subminuette wave a subdivides as a three wave structure, the correction one degree higher at minuette wave degree must be a flat.
Within subminuette wave a, micro wave C is 0.23 short of 1.618 the length of micro wave A, and micro wave B is a 160% correction of micro wave A.
Subminuette wave b may be unfolding as a regular or barrier triangle which is very close to completion. I am considering this labelling because the subdivisions fit perfectly, particularly micro wave A on the five and one minute charts. Micro wave A will subdivide perfectly as a three, and I have not been able to see a solution where it subdivides as a five.
At its end, subminuette wave b may be about 120% of subminuette wave a indicating an expanded flat correction.
Subminuette wave c may end about the 0.382 Fibonacci ratio of minuette wave (a) at 1,188.
This idea requires confirmation with a breach of the trend channel containing minuette wave (a). Only then can we be confident that the downwards impulse is over and the correction to follow it is underway.
Minuette wave (b) may not move beyond the start of minuette wave (a) above 1,205.89.
Bear Wave Count
Click chart to enlarge.
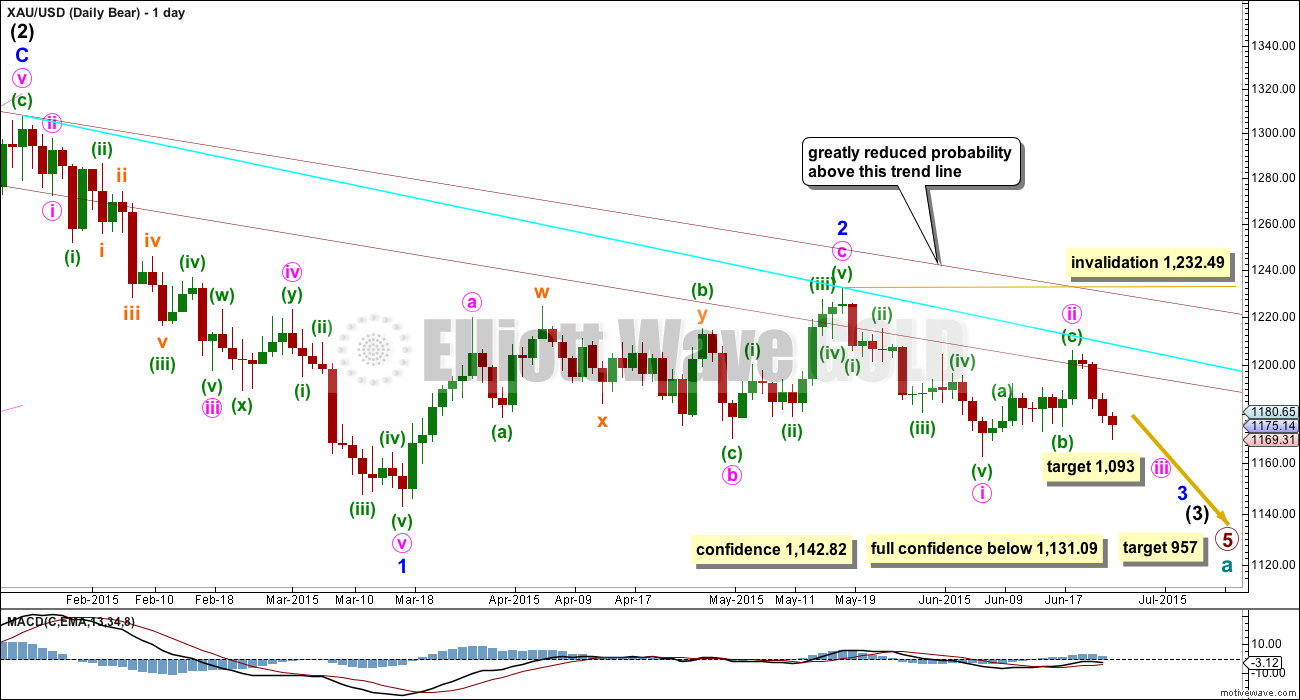
This wave count follows the bear weekly count which sees primary wave 5 within cycle wave a as incomplete. At 957 primary wave 5 would reach equality in length with primary wave 1.
Pros:
1. Intermediate wave (1) (to the left of this chart) subdivides perfectly as a five wave impulse with good Fibonacci ratios in price and time. There is perfect alternation and proportion between minor waves 2 and 4. For this piece of movement, the bear wave count has a much better fit than the bull wave count.
2. Intermediate wave (2) is a very common expanded flat correction. This sees minor wave C an ending expanding diagonal which is more common than a leading expanding diagonal.
3. Minor wave B within the expanded flat subdivides perfectly as a zigzag.
4. Volume at the weekly and daily chart continues to favour the bear wave count. Since price entered the sideways movement on 27th March it is a downwards week which has strongest volume, and it is downwards days which have strongest volume, five of them.
5. On Balance Volume on the weekly chart recently breached a trend line from back to December 2013. This is another bearish indicator.
Cons:
1. Intermediate wave (2) looks too big on the weekly chart.
2. Intermediate wave (2) has breached the channel from the weekly chart which contains cycle wave a.
3. Minor wave 2 is much longer in duration than a minor degree correction within an intermediate impulse normally is for Gold. Normally a minor degree second wave within a third wave should last only about 20 days maximum. This one is 44 days long.
4. Within minor wave 1 down, there is gross disproportion between minute waves iv and ii: minute wave iv is more than 13 times the duration of minute wave i, giving this downwards wave a three wave look.
Minor waves 1 and 2 are complete. Minute wave i within minor wave 3 may be incomplete on the hourly chart.
Minute wave ii may not move beyond the start of minute wave i above 1,232.49.
At this stage, a new low below 1,162.80 would provide a lot of confidence in the bear wave count. Further confidence would come with a new low below 1,142.82 and final confidence would come only with a new low below 1,131.09.
Minute wave ii is now very likely to be over here. If it moves any higher, then it should find strong resistance at the blue trend line.
Hourly Bear Wave Count
Click chart to enlarge.
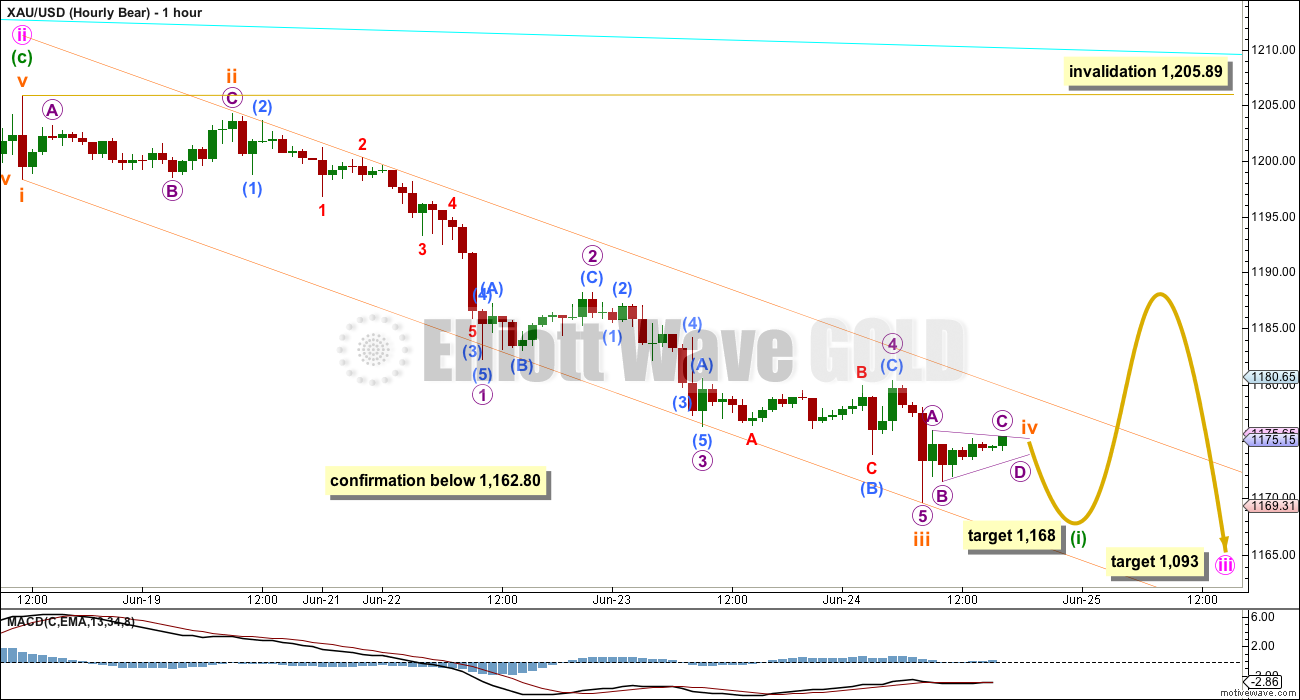
This second idea at the hourly chart level works in exactly the same way for the bull wave count. It has a higher probability only because the channel containing the downwards movement has not been breached. We should assume the trend remains the same until this channel is breached.
Subminuette wave iii may have been over at today’s low. Ratios within subminuette wave iii are: micro wave 3 has no Fibonacci ratio to micro wave 1, and micro wave 5 is 1.07 short of equality with micro wave 3.
Subminuette wave iii is 2.78 longer than 4.236 the length of subminuette wave i.
Subminuette wave iv may be an incomplete regular contracting or barrier triangle. Or it may yet morph into a combination. If it completes only sideways as a triangle ending about 1,174, then subminuette wave v would reach equality in length with subminuette wave i about 1,168.
When the channel about minuette wave (i) is clearly breached, that shall provide trend channel confirmation that minuette wave (i) is over and minuette wave (ii) is underway. Draw a Fibonacci retracement along the length of minuette wave (i). The most likely target for minuette wave (ii) would be the 0.382 Fibonacci ratio. For the bull wave count targets for minuette wave (b) are the 0.382 and 0.618 Fibonacci ratios, both equally as likely.
Minuette wave (ii) may not move beyond the start of mineutte wave (i) above 1,205.89.
Technical Analysis
Click chart to enlarge.
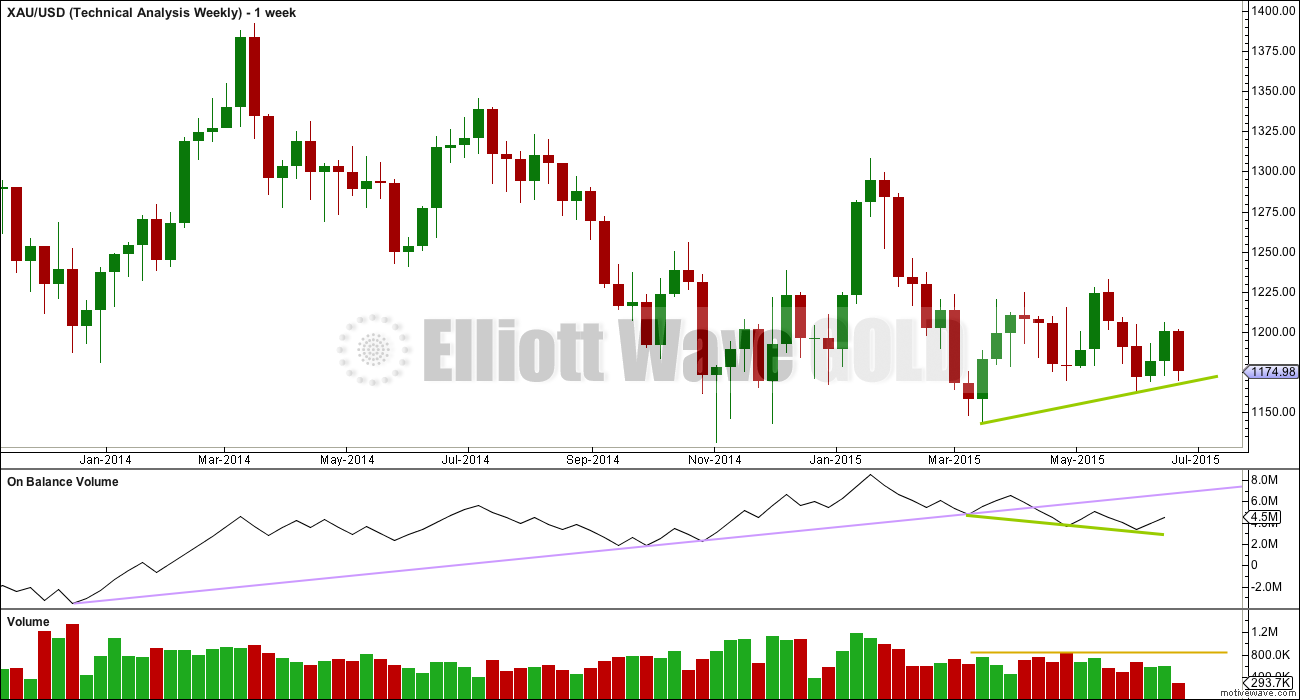
Weekly Chart: Overall volume still favours a downwards breakout eventually. During this sideways movement, it is still down days and a down week which have higher volume. On Balance Volume breaches a trend line (lilac line) which began in December 2013, and the breach is significant.
While price has made higher lows, On Balance Volume has made lower lows (green trend lines). This small rise in price is not supported by volume, and it is suspicious.
At the weekly chart level, volume consistently favours a bearish breakout: over the last three weeks, the two up weeks have lower volume than the prior down week; and, this pattern was also seen for prior moves within this sideways range, with the four down weeks from 29th March to 26th April stronger than the following two up weeks.
Click chart to enlarge.
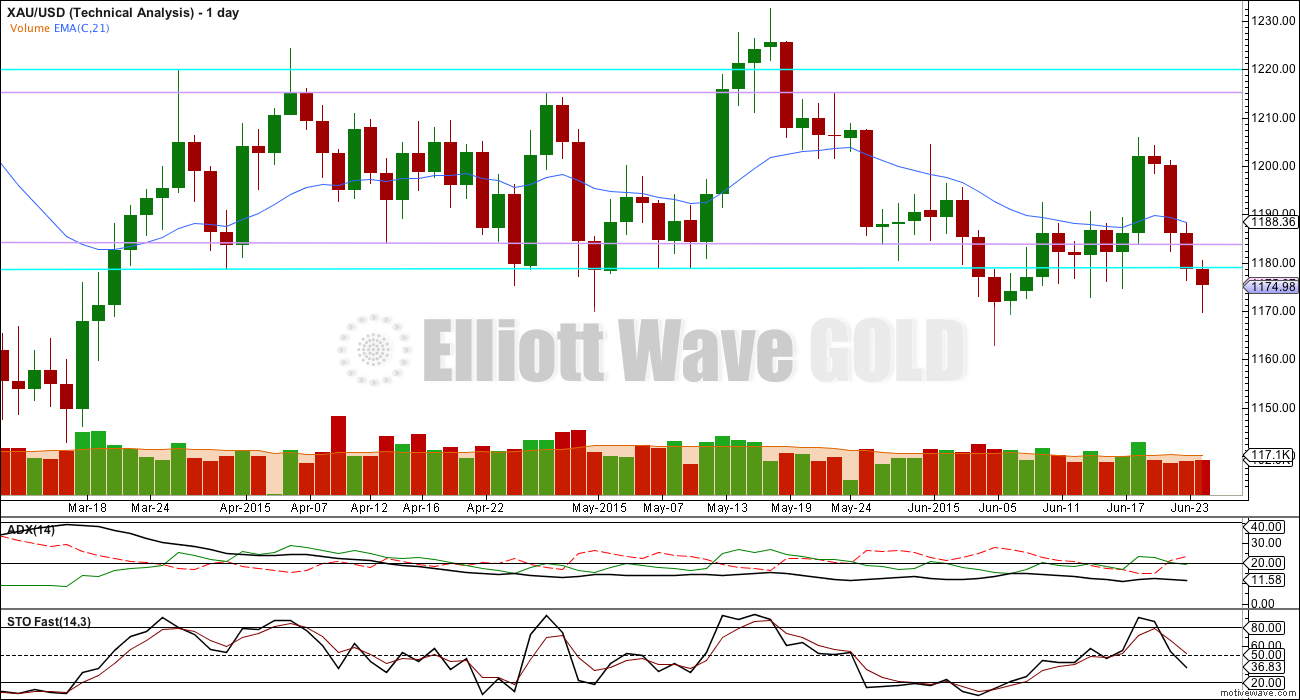
Daily Chart: ADX still indicates there is no clear trend. A range bound trading system would be better employed than a trend following system. Trading in a range bound market, as Gold has been in since the 27th of March, is inherently more risky than trading a trending market. Careful money management rules are essential to avoid wiping out your account. A good rule to follow would be to invest no more than 2% of the equity in your account on any one trade.
The range bound system illustrated here uses horizontal lines of support and resistance along with fast Stochastics to illustrate overbought and oversold. The idea is to expect the end of one swing and the start of another when price is at support or resistance and Stochastics is at oversold or overbought.
Stochastics reached overbought five days ago, but price did not reach resistance and has turned strongly down. Again, this illustrates why trading this market is so risky when using this method, because it is impossible to tell exactly where one swing ends and the other begins; it is only possible to get a general idea.
Eventually Gold will break out of this range it entered on 27th March; a breakout is 100% certain. What is uncertain is what direction the breakout will be. When the breakout comes, then this range trading system will be expecting a move in the opposite direction and the final swing will never come. Additionally, ADX may be slow to indicate the existence of a trend when it finally arrives, which again illustrates why trading this market is so risky.
Gold has been within this range now for 63 days. The longer price remains in this range the closer the breakout will be and the risker it is to expect the sideways swings to continue.
The weight of volume indicators is pointing to a downwards breakout as more likely. This is not definitive and only is indicative. Extreme caution is advised, particularly with any trades to the upside at this stage.
The last three days sees volume increasing very slightly each day: Wednesday’s session has ended with 102K, Tuesdays was 98.7K, and Monday was 92.9K. The decline in price is supported by volume (even though it remains lower than the prior up day of 18th June).
The long lower shadow on Wednesday’s candlestick is slightly bullish, which indicates a small correction may show up about here.
Price has now again breached the lower support line. This blue line may provide some resistance to upwards movement at this stage.
This analysis is published about 06:44 p.m. EST.
For the hourly wave count presented for the bear: the fifth wave down would have ended at Thursday’s low, but it is truncated. The probability of that idea is reduced.
With the channel drawn on the bear hourly chart it is not yet breached.
For the hourly wave count presented for the bull: a flat is unfolding, the B wave is a triangle. Yesterday’s labelling of the triangle was too tight, this sideways move for Thursday is a larger triangle which should now be very close to completion. So overall the idea is the same; sideways move to end the triangle followed by a C wave up to 1,188.
At this stage the hourly chart presented for the bull looks more likely, it has a higher probability because it doesn’t have a truncation. It also has a trend channel breach and the upper edge of the channel is now providing support.
Overall though both ideas now expect some upwards movement for Friday for a small correction.
Lara, which direction overnight and Friday for gold, which stalled today?
I think it’s going to go up for Friday to either 1,184 or more likely 1,188.
Thanks Lara. I will be closing some longs on this move.
Mixed signals from gold. Last night we had an upper trend channel breach with a gold high of 1178.20 at 12:47 am the high since Wednesday am. Gold opened down $2 then jumped up $3 to 1175.53 in 13 minutes at 9:43 am for today’s gold high of 1175.53 and miners highs. Then gold proceeded to bounce slowly down hill only $3 yet DUST moved from it’s low of 16.33 at 9:43 to its high of 17.01 at 12:50 pm. Gold’s afternoon’s low of 1172.39 a drop of only $3 is draining the miners with DUST up at 17.02 now at 2:23 pm up 3.00%.
Lara had suggested maybe 1,162.80 this week. That would require a surprise downward breakout. Meanwhile we are curious in which direction will be gold’s next move and perhaps we can trade it?
Ben, your thoughts on gold always interesting. Would you clarify your comments below? What are your upside targets for gold?
“It makes sense to me that Gold would attempt a move to the upside for a day or two, to the targets listed above, and then drop hard down to the 1163-1165 area for quarter end, printing yet another negative quarter for gold. This is what I am looking for over the next few days…what happens after that – I do not know.”
Hi Davey,
My targets would be whatever Lara gives for bear hourly target or bull hourly target.
Based on COT, which should look very interesting tomorrow as open interest is up 20K contracts for Gold and something like 10K contracts for silver, I expecting a move up…but, we could get a smash first, like we did in early March.
I don’t like the look of the fractals for GDX for early march compared to current though….GDXJ dropped $4.50 in 3 trading days.
I know there has been a lot of talk here about Gold correlation to USD….but I think Gold to Yen is tighter.
Some Scenarios I have rolling around in my head:
Scenario 1: ‘Bullish’ – Yields have topped, so has the dollar for now, and over the summer we get a big drop in yields, rise in gold and silver and oil, as well as stocks. A greek deal might be the viewed as the cause for this scenario as Euro rises and government bonds become viewed as lower risk again.
Scenario 2: ‘Bearish’ – Yields are finishing a corrective wave, same with the yen and dollar, and so this summer yields spike as government debt is viewed as more risky, dollar continues toward 110, euro crashes, all of this spells deflation causing gold and oil to crash. No greek deal might be viewed as the catalyst for this scenario.
Scenario 1 just puts off scenario 2 in my mind by a month or two. I feel like the current COT supports scenario 1.
I think that the dollar is headed to 120 via a 5 wave expanding diagonal and it just started a 3rd wave.
Gold, on the other hand, is on the doorstep of a $100+ move down by mid-July. Then comes a longer sideways/upward drift for a couple months, with a final low near the final months of 2015.
Good stuff Matt. Thanks for the update. I saw some analysis that had the dollar with 4 completing around 92, which would fit with my scenario 1. But like I said, scenario 2 is inevitable I think, just not sure when yet.
Matt, I subscribe to the concepts you laid out, especially dollar continuing move up over time and gold moving lower, below 1000 maybe down to 800 then over several years gold move considerably higher.
My big question is does bull or bear take gold where it needs to go (both lower and higher)? Lara previously indicated bull could take gold below 1000 in next 12 months and of course bull can then take gold considerably higher over next several years. Bear can certainly take gold below 1000 but….can bear take gold considerably higher (maybe 3-5000) over the next few years?
I think your timeframe for gold to reach a final bottom may be too long. There has been a very long period of sideways movement, which may be conditioning you to think that it will go on for an extended time. However, everything eventually comes to an end.
We can expect a distinct 5 wave structure down. This is the time to examine the structure of the first and third primary waves and how they played out. If gold drops $100 now, then it is safe to assume that the end is near. This will be the last substantial drop. Thereafter some sideways movement and a final dip below $1000, but only briefly.
$800 seems too low to me. Also, Lara quotes $1093 as the next bear target, but she is only referring to the end of this 3rd within a 3rd. The full drop at this time should take gold into the $1060s by next month.
With 1171 holding, gold price appears toppy at 1177-79 and remains to be seen if it can get above here with upside risk 1195-96. Gold is trading in a narrow trade range and also having an inside day – potential for a good breakout to occur…. I’d favor a breakout to the downside….
Dust is -$137M over that time frame while it has been rising.
GLD on the other hand is -$670M over that same time frame. But up $170M in the last 3 days.
I’ve been watching the ETF daily fund flows for GDX. Since May 18th, GDX fund flows are +$412M, while the price has dropped from ~$21 to ~$18.
What do you guys make of the movement so far?
It is possible that yesterday’s triangle by itself has been negated and the rise has been either a triangle in combination or an impulse. The highest point reached was 1178.20.
The price action following will determine whether price will first drop towards 1168 or rise towards 1188. At the moment, price rose to 1178.20 then pulled back. If it continues to rise, then it can be in 5 waves (the bull case, being subminuette c 3-3-5 flat), or in 3 waves (the bear case, being the continuation of subminuette 4). But, price could also drop from 1178.20 straight down towards 1168. That’s where the uncertainties lie, too many possibilities. Richard observed that the trendline has been breached. But, that only gives confidence, not confirmation of a rise. If it continues to rise, it has yet to present itself. The action in the past couple of hours has been too sluggish. (That’s why there are hardly any posts!)
I think a move up in gold is coming. This little dip in the miners was to run stops, all while yields, dollar, and yen began to drop. Miners bounced back up now and yields, dollar, and yen are dropping a little more.
We broke the orange trendline and came back down to test it again.
Thanks Ben for the enlightening input. That is also my preferred view. All it takes now is wait and monitor the rise, to see whether it is in 3 waves or 5.
One other data point for this path outlined above, I believe we head into the 4th of July under $18.50 on GDX. Someone sold an insane amount of weekly calls at that strike.
Kind of quiet out here today.
I am not seeing the bounce in Silver that I was looking for today with Silver Futures options expiring…maybe we get a run in the next hour….
It makes sense to me that Gold would attempt a move to the upside for a day or two, to the targets listed above, and then drop hard down to the 1163-1165 area for quarter end, printing yet another negative quarter for gold. This is what I am looking for over the next few days…what happens after that – I do not know.
The other thing I am looking for is for gold to stay in this range for eternity.
Upper trend channel confirmation. Gold has already breached the upper orange trend channel on the hourly bull with more than the required 1 hourly candlestick above it by this time at 2:30 am with at least 3 candlesticks.
“Subminuette wave c of minuette wave (b) may end about the 0.382 Fibonacci ratio of minuette wave (a) at 1,188. This idea requires confirmation with a breach of the trend channel containing minuette wave (a). Only then can we be confident that the downwards impulse is over and the correction to follow it is underway.”
With a H 1177.30 / L 1171.20 so far, what is your suggestion? Further downside to expect or not? Thank you. //// Gold price is in a very narrow trade range so far