
Upwards movement was expected for the bull and main bear Elliott wave counts, but downwards movement breached their invalidation points. The alternate bear Elliott wave count is now taken more seriously.
Summary: The last swing down will subdivide as either a three or a five. I have three wave counts. The first bull wave count needs upwards movement from here and it must move above 1,232.49. The new second bull wave count needs a little downwards movement, the target is 1,165. The only remaining bear wave count sees a second wave correction moving slowly higher for another day or so but not above 1,232.49. The price point to the upside which differentiates bull and bear is 1,232.49. The price point to the downside which differentiates bull and bear is 1,142.82.
To see the bigger picture and weekly charts go here.
Changes to last analysis are italicised.
First Daily Bull Wave Count
Click chart to enlarge.
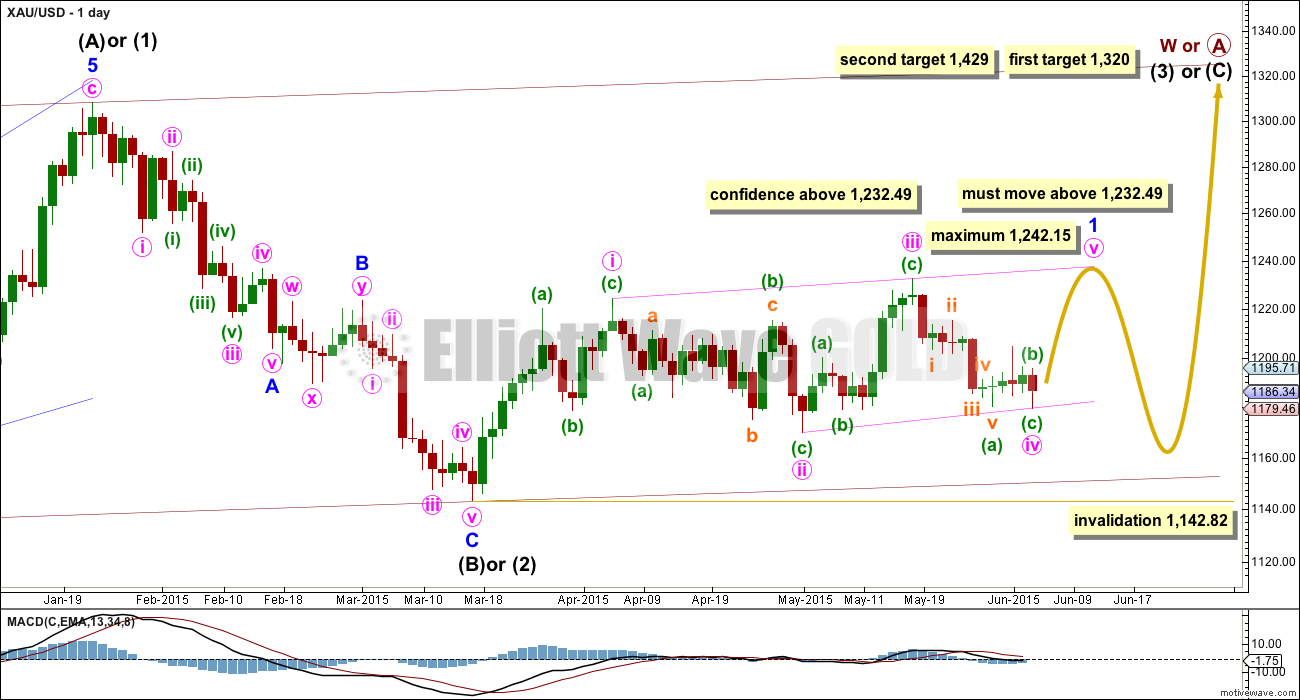
The bull wave count sees primary wave 5 and so cycle wave a a complete five wave impulse on the weekly chart.
Pros:
1. The size of the upwards move labelled here intermediate wave (A) looks right for a new bull trend at the weekly chart level.
2. The downwards wave labelled intermediate wave (B) looks best as a three.
3. The small breach of the channel about cycle wave a on the weekly chart would be the first indication that cycle wave a is over and cycle wave b has begun.
Cons:
1. Within intermediate wave (3) of primary wave 5 (now off to the left of this chart), to see this as a five wave impulse requires either gross disproportion and lack of alternation between minor waves 2 and 4 or a very rare running flat which does not subdivide well. I have tried to see a solution for this movement, and no matter what variation I try it always has a major problem.
2. Intermediate wave (5) of primary wave 5 (now off to the left of the chart) has a count of seven which means either minor wave 3 or 5 looks like a three on the daily chart.
3. Expanding leading diagonals (of which intermediate wave (A) or (1) is) are are not very common (the contracting variety is more common).
4. The possible leading diagonal for minor wave 1 and particularly minute wave ii within it look too large.
For volume to clearly support the bull wave count it needs to show an increase beyond 187.34 (30th April) and preferably beyond 230.3 (9th April). Only then would volume more clearly indicate a bullish breakout is more likely than a bearish breakout.
Within cycle wave b, primary wave A may be either a three or a five wave structure. So far within cycle wave b there is a 5-3 and an incomplete 5 up. This may be intermediate waves (A)-(B)-(C) for a zigzag for primary wave A, or may also be intermediate waves (1)-(2)-(3) for an impulse for primary wave A. At 1,320 intermediate wave (C) would reach equality in length with intermediate wave (A) and primary wave A would most likely be a zigzag. At 1,429 intermediate wave (3) would reach 1.618 the length of intermediate wave (1) and primary wave A would most likely be an incomplete impulse.
Intermediate wave (A) subdivides only as a five. I cannot see a solution where this movement subdivides as a three and meets all Elliott wave rules (with the sole exception of a very rare triple zigzag which does not look right). This means that intermediate wave (B) may not move beyond the start of intermediate wave (A) below 1,131.09. That is why 1,131.09 is final confirmation for the bear wave count at the daily and weekly chart level.
Intermediate wave (C) is likely to subdivide as an impulse to exhibit structural alternation with the leading diagonal of intermediate wave (A). This intermediate wave up may be intermediate wave (3) which may only subdivide as an impulse.
It is possible that the intermediate degree movement up for the bull wave count is beginning with a leading diagonal in a first wave position for minor wave 1. I have a new bull wave count today which sees minor waves 1 and 2 both over. I will favour neither bull wave count and with both expecting upwards movement from here it would be wisest to wait for price to tell us which is correct.
A leading diagonal must have second and fourth waves which subdivide as zigzags. The first, third and fifth waves are most commonly zigzags, but sometimes they may be impulses. The fourth wave must overlap first wave price territory.
Within diagonals, the most common depth of the second and fourth waves is between 0.66 and 0.81. Minute wave ii is 0.67 of minute wave i. Minute wave iv is now almost at its limit, at 0.97 of minute wave iii. Minute wave iv may not be longer than equality in length with minute wave ii so it cannot move below 1,178.08. The diagonal trend lines are now barely converging. This has today reduced the probability of this wave count to about even with the new bullish wave count below.
The diagonal of minor wave 1 is contracting so minute wave v may not be longer than equality in length with minute wave iii. The maximum for minute wave v is equality with minute wave iii at 1,242.15.
Second wave corrections following leading diagonals in first wave positions are commonly very deep. When this leading diagonal structure for minor wave 1 is complete, then minor wave 2 should unfold lower, may be expected to reach at least the 0.618 Fibonacci ratio of minor wave 1 or may be quite a bit deeper than that, and may not move beyond the start of minor wave 1 below 1,142.82.
First Hourly Bull Wave Count
Click chart to enlarge.
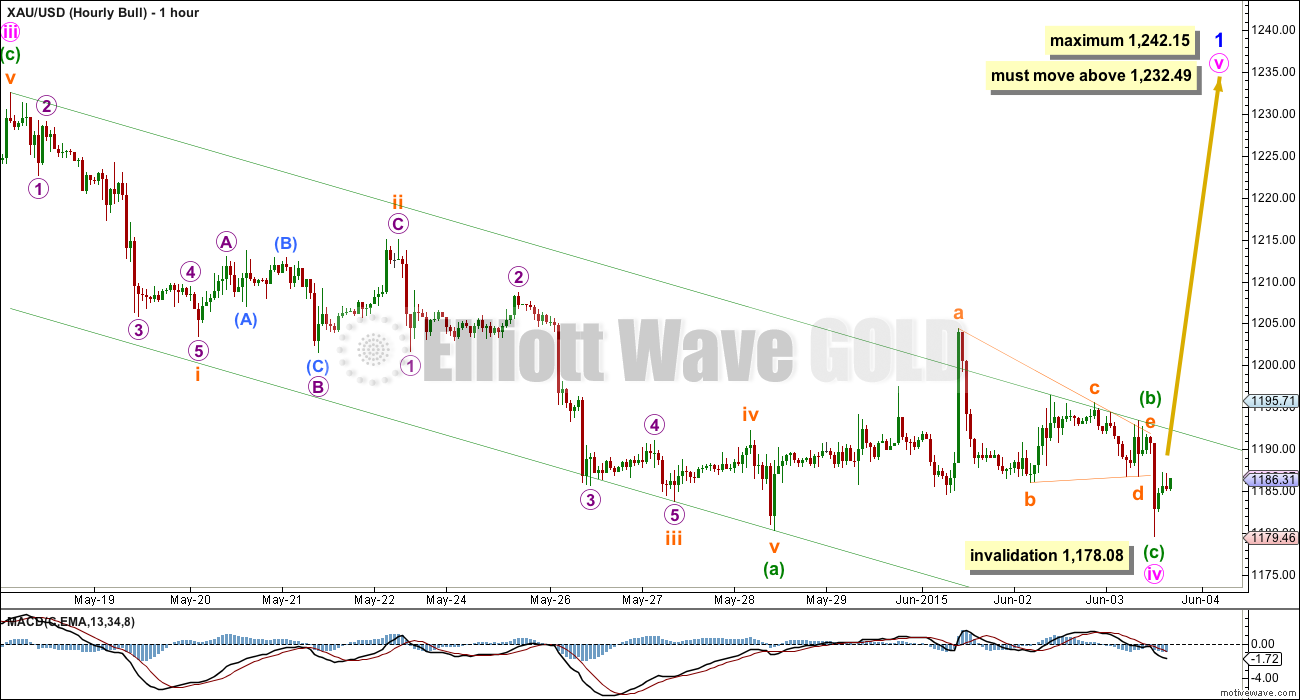
I had expected minute wave iv was complete, but it has moved lower. This wave down is here seen as a complete zigzag. This has slightly better proportions than seeing it as an impulse, but both ideas fit.
The fifth wave of a leading diagonal may not be truncated so minute wave v must move above the end of minute wave iii at 1,232.49. Minute wave v may not be longer than equality in length with minute wave iii because minute wave iii may not be the shortest wave and the diagonal is contracting. This gives a maximum limit for the next wave up at 1,242.15. A new high above 1,242.15 would discard this first bull wave count in favour of the second bull wave count below.
Within the zigzag of minute wave iv, minuette wave (c) is just 0.4 short of 0.236 the length of minuette wave (a).
Ratios within minuette wave (a) are: there is no Fibonacci ratio between subminuette waves iii and i, and subminuette wave v is just 0.01 longer than 0.382 the length of subminuette wave i.
Within minuette wave (a), subminuette wave ii is a shallow 0.40 expanded flat and subminuette wave iv is a more shallow 0.27 single or double zigzag (it will subdivide either way). There is very good alternation between subminuette waves ii and iv.
To see this downwards movement as a three has slightly better Fibonacci ratios and slightly better alternation than seeing it as a five.
Second Daily Bull Wave Count
Click chart to enlarge.
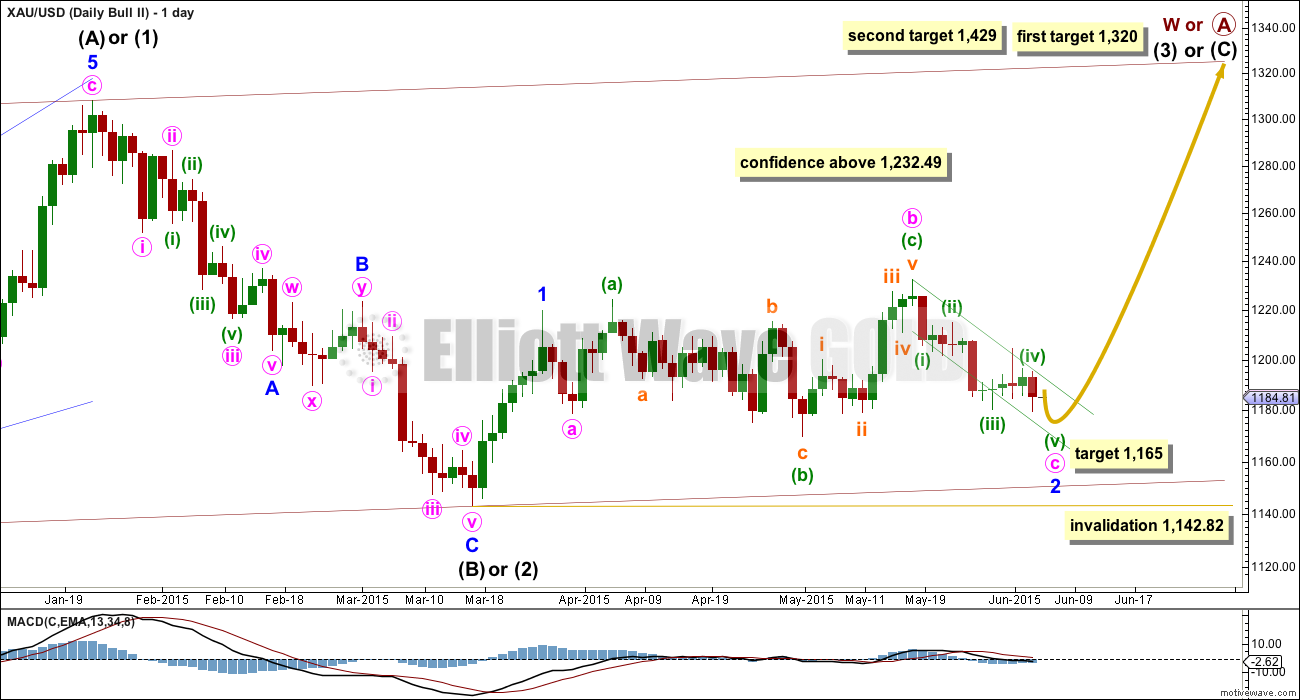
This bull wave count sees minor wave 1 a short brief impulse and minor wave 2 now an incomplete expanded flat correction. Within minor wave 2, minute wave c has not yet managed to move below the end of minute wave a at 1,178.59. It is highly likely to move at least below this point to avoid a truncation and a very rare running flat. At 1,165 minute wave c would reach 1.618 the length of minute wave a.
After completion of minor wave 2, then a new high above 1,142.82 would leave this as the only bull wave count. It requires a new high above 1,232.49 to eliminate a bearish alternate and for full confidence in the targets.
Second Hourly Bull Wave Count
Click chart to enlarge.
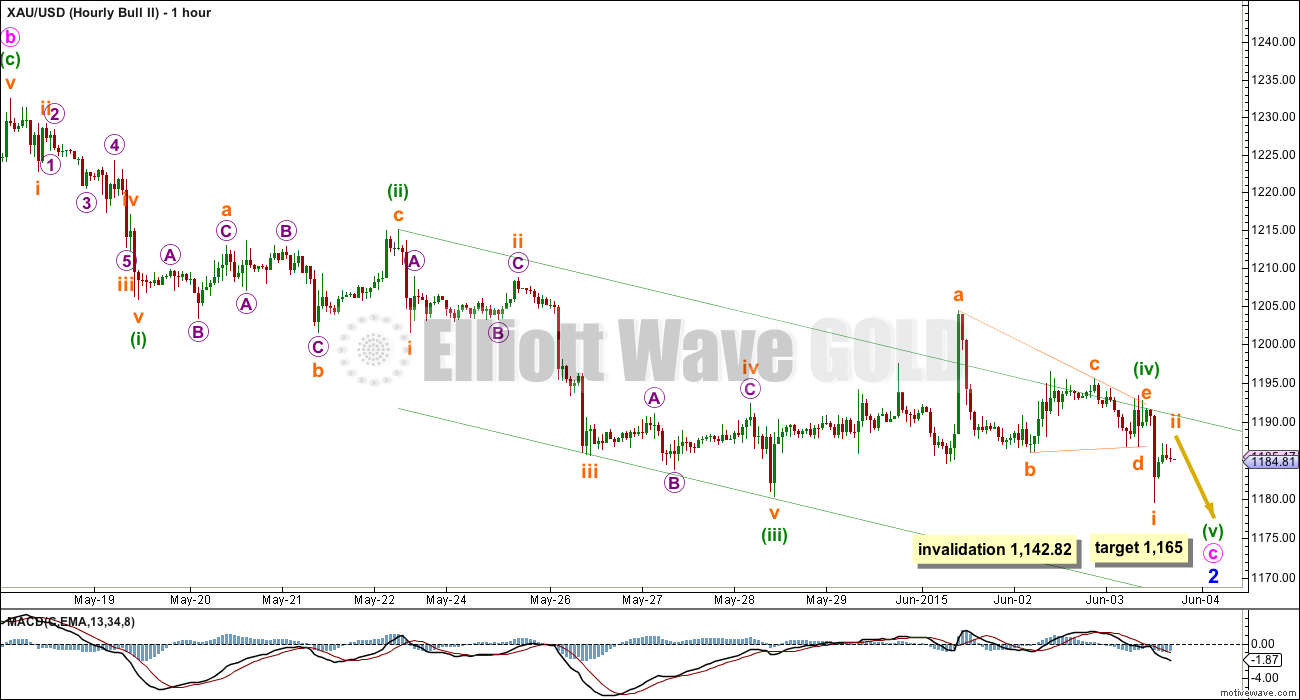
This last wave down may also fit as a five. Minuette wave (ii) was a shallow 0.34 expanded flat and minuette wave (iv) was a shallow 0.33 regular barrier triangle. There is alternation in structure, but not in depth.
There is no Fibonacci ratio between minuette waves (i) and (iii). At 1,165 minuette wave (v) would reach equality in length with minuette wave (i). As this is also exactly where minute wave c would reach 1.618 the length of minute wave a, this target has a good probability.
Minor wave 2 may not move below the start of minor wave 1 at 1,142.82.
In the short term, subminuette wave ii may not move beyond the start of subminuette wave i above 1,191.71. In the short term, if price moves up strongly from here without first making a new low below 1,178.59, then minor wave 2 may be complete but only as a very rare running flat. If that happens, this wave count would have an exceptionally low probability due to the rarity of running flats, but it would still be valid.
Daily Bear Wave Count
Click chart to enlarge.
This wave count follows the bear weekly count which sees primary wave 5 within cycle wave a as incomplete. At 957 primary wave 5 would reach equality in length with primary wave 1.
Pros:
1. Intermediate wave (1) (to the left of this chart) subdivides perfectly as a five wave impulse with good Fibonacci ratios in price and time. There is perfect alternation and proportion between minor waves 2 and 4. For this piece of movement, the bear wave count has a much better fit than the bull wave count.
2. Intermediate wave (2) is a very common expanded flat correction. This sees minor wave C an ending expanding diagonal which is more common than a leading expanding diagonal.
3. Minor wave B within the expanded flat subdivides perfectly as a zigzag.
Cons:
1. Intermediate wave (2) looks too big on the weekly chart.
2. Intermediate wave (2) has breached the channel from the weekly chart which contains cycle wave a.
3. Minor wave 2 is much longer in duration than a minor degree correction within an intermediate impulse normally is for Gold. Normally a minor degree second wave within a third wave should last only about 20 days maximum. This one is 44 days long.
4. Within minor wave 1 down, there is gross disproportion between minute waves iv and ii: minute wave iv is more than 13 times the duration of minute wave i, giving this downwards wave a three wave look.
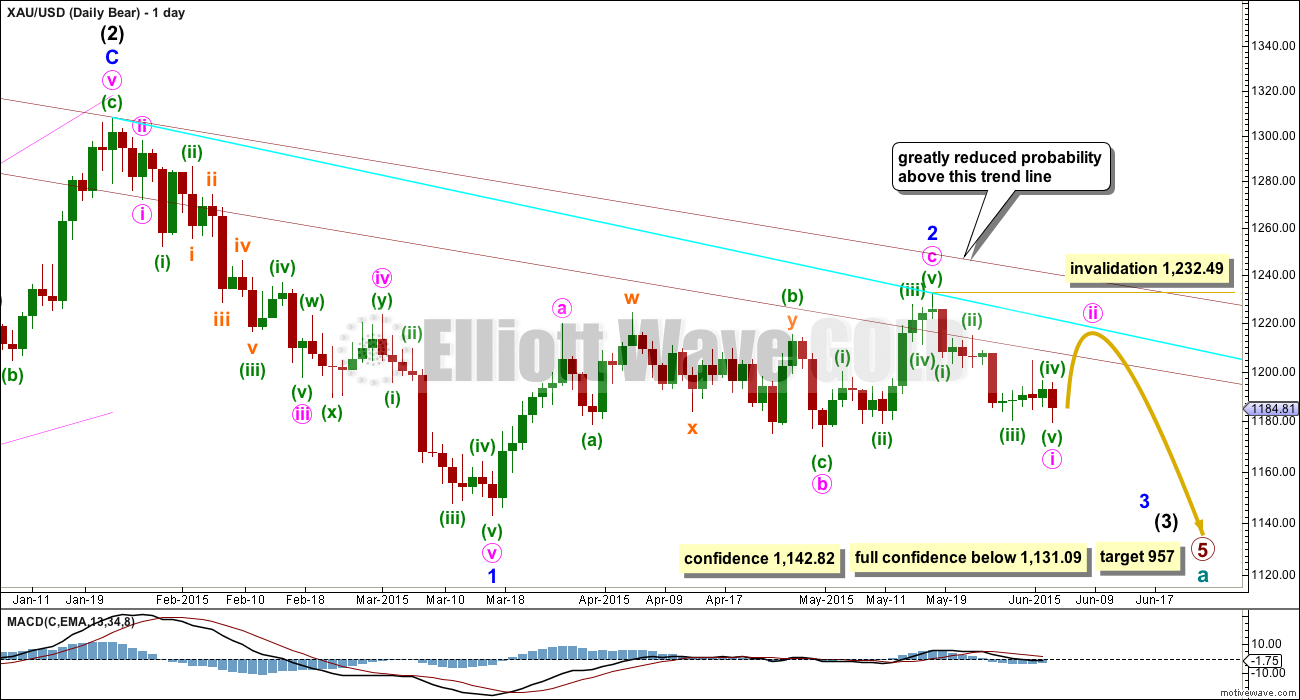
This is now the only remaining bear wave count. It sees minor waves 1 and 2 complete. The first wave down within minor wave 1 is now also likely to be complete and a smaller second wave correction for minute wave ii should unfold upwards. If it breaches the first maroon trend line, then it should find strong resistance at the aqua blue trend line.
Minute wave ii may not move beyond the start of minute wave i above 1,232.49.
Hourly Bear Wave Count
Click chart to enlarge.
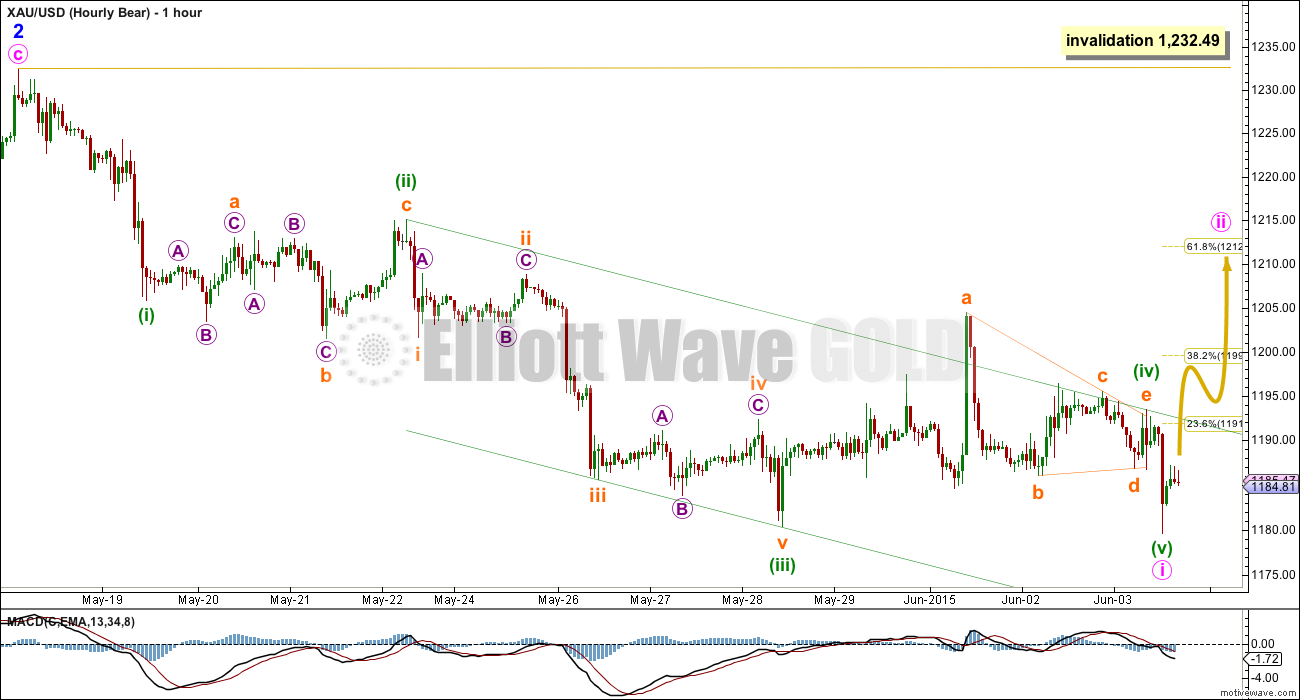
This bear wave count sees the downwards wave from the last high at 1,232 also as a five wave structure in the same way as the second bull wave count.
Minute wave ii may correct to either the 0.382 or 0.618 Fibonacci ratios. It should show on the daily chart as at least one green candlestick or doji.
Technical Analysis
Click chart to enlarge.
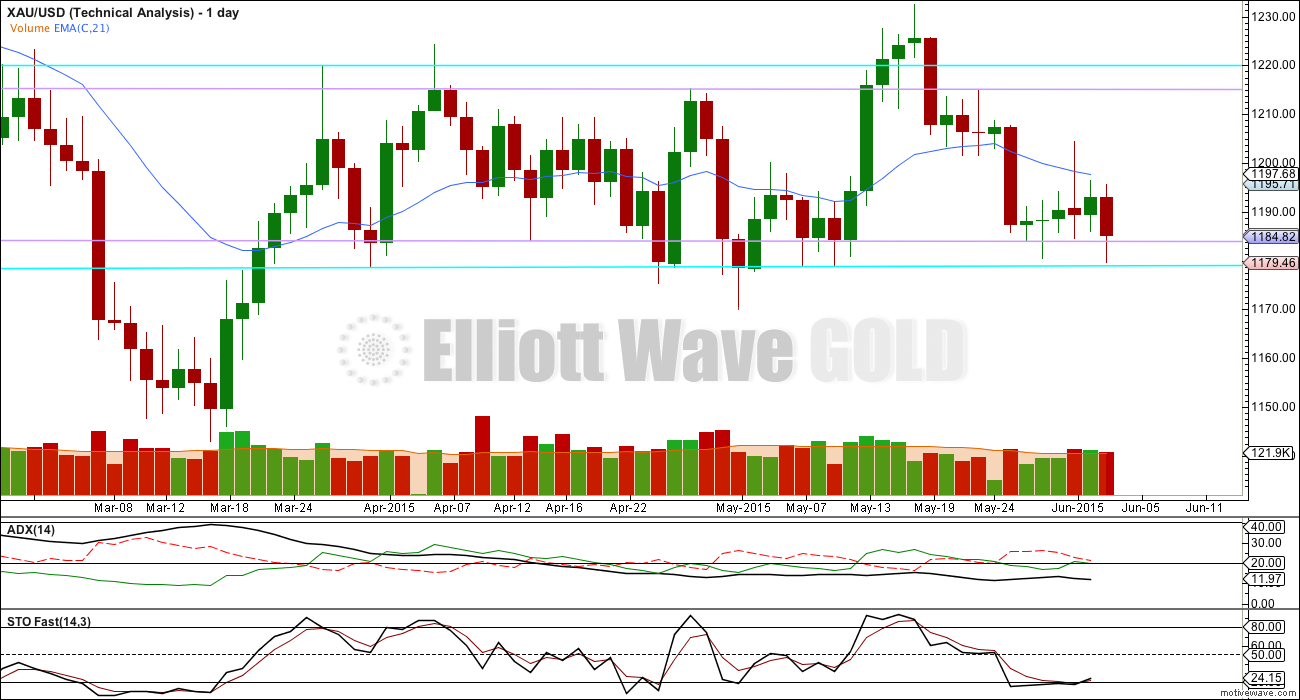
ADX remains below 15 and continues to slowly decline. The market is still very much range bound. Short swings and low volatility should be expected. I cannot stress enough (as I have been over these last few weeks) that trading range bound markets is best left to experienced traders because it involves higher risk than trading a trending market. If members insist on trading within a clearly range bound market, it is vital that good money management and careful placement of stops is practiced. There is a greater risk of loss in this market.
The approach outlined here uses fast Stochastics as an oscillator to indicate overbought and oversold, in conjunction with horizontal trend lines because they are working nicely for this particular consolidation period. The unexpected downwards swing of Wednesday has again bought price back down to almost touch the lower outer aqua blue horizontal line.
This trend line is long held, not only shallow but horizontal, and repeatedly tested. It is highly technically significant. The probability of another upwards swing from here is high. It is possible that this trend line could be overshot before the upwards swing begins, which has happened twice before during this trading range.
This approach now expects it is very likely an upwards swing will unfold and will end when price again finds resistance at one of the two upper trend lines and when Stochastics is again overbought.
This analysis is published about 05:54 p.m. EST.
Today I will have only two wave counts. Both see a five wave impulse moving lower, and it’s in it’s fifth wave. For the bear wave count this may possibly be a strong extended fifth wave, there is no downwards limit to it. For the bull wave count the target remains at 1,165. The structure is incomplete. Both counts expect more downwards movement to about 1,165, the bear count may be lower. Any new low below 1,142.82 invalidates the bull and confirms the bear.
I’m back from my self-imposed exile after a rather unpleasant altercation with a rude belittling individual in this forum early last week. During this absence, I was saddened by the fact that some of you folks were floundering while I was profiting from my swing trades, so I relented and decide to provide some help whenever I could.
This is how I see the movement today. Lara’s first bull count has been invalidated by the down move past 1178.08. So, the second bull prevails as the only surviving bull. So far, it is moving according to its schedule — more of that later. The bear count is still valid, but needs to be altered from Lara’s perceived movement. It will move precisely the same as the bull until the low. That low, at 1165-1166, marks the end of minor 2 at a perfect 0.618 retrace.of minor 1. It will also be minute 1 of minor 3 of the bear. Following the low, the bull count will rise strongly in its minor 3 wave, while the bear count makes its second wave correction (minute 2). And that is when the two wave counts are differentiated.
Now, the movement has completed two of five impulse waves down. It is in the midst of the fourth wave of the third if it is a zigzag, or it has completed that fourth (and now going on to complete the fifth wave of the third). I estimate the third wave to complete at 1169-1170.
I would not be putting in any trade at the moment as the miners have been moving very sluggishly. I’m waiting for the low at 1165-1166 to put in some longs. But I reckon that may not happen today. I am conjecturing that tomorrow’s NFP report may stir some life into the market. Good luck everyone.
P.S. This version of WordPress uses a shortened name I sign on with, not Tham Kwok Liang as in Disqus.
Thanks guys. I don’t see any strong moves for the rest of today, so maybe it’s off to bed.
By the way, this version of WordPress does not allow (a) editing, (b) paragraphing, so I’ll have to work around and post paragraphs separately, and (c) cannot reply using an iPad, only from a computer. Not to mention the extremely small font.
and you know what else? you can’t collapse the older comments that you’ve read already. And can’t always reply to someone’s comment– think its the third indentation in that stops replies. But we’re getting used to it Tham. Guess we have to. [Bend to what is or ….not break, morph into something else!]
or maybe you just can’t reply to someone who has replied to themself. God this is crazy.
You can reply from an iPad on some posts. Just touch the post and the reply link will show. Also, send an email to Lara and she can change your moniker.
you can ask Lara to change your handle name back to TKL or just Tham or whatever you like. They can do that.
YEAHHHH! (Alan) / Tham’s back!
Hello and welcome back TJL. Thank you for your valuable input~!
Sorry typo. Welcome back TKL,,,,
Tham good to see you back. Your opinion is valuable. If altercation was with me I apologize.
Richard. Definitely not with you. You have always been cordial, polite and friendly, and I admire you for that.
Hi Tham, Glad your back, it appears some people only appreciate
views that align with there own. For me trading involves entering everyday with no baggage and an open mind, so I hope you will keep your much appreciated counts coming.
Hi ROBERT. I totally agree with you. I always keep an open mind about price movements. In order not to lose money, it does not pay to be too set in one’s ways. Flexibility and the speed to adapt to changing circumstances will always keep us on top of the game.
Both you and Lara have a target below the price from May 1st. My experience has been that once some major low like that is taken out, price cascades in that direction. Are you not concerned about that? I think there is a good chance that gold stays above this threshold. Otherwise, once you open that door, the next real support is the 1130-40 area.
Hi Matt. I’m more concerned about the low of 1142.82 set on March 17. You are absolutely right about price cascading below a major low, and that is precisely the case with 1142.82. When that happens, the bull is slaughtered, and price will gravitate towards 1000. I think most of us will be very happy as we can short gold and watch it move all the way down, without worrying about the choppy action in the past few weeks.
Tham I’m so sorry to hear you had an altercation on this site. That is certainly not something that ever should happen here. It’s why I have strict comment guidelines. But I don’t catch everything, obviously. If that ever happens again to anyone here on this site please LET ME KNOW. I will moderate forcefully. Much of the internet is a horrible nasty confrontational place. I will not allow this site to be part of that. I will expect it is collegial and respectful. Please, anyone uncomfortable with the tone here email me. Immediately. Thank you so much.
And I agree with your assessment exactly. So unfortunately, it means that these two wave counts will not diverge for quite some time yet. But at least it tells us what direction to expect for the next week or so, and so hopefully I’ll have a reasonable accuracy rate over that time. Good to see you back Tham. Do you want me to change your handle? (and BTW we’re updating the theme this weekend with a view to fixing the problems with the comments)
Thanks Lara. There is no need to change the handle. It will be only for one more day. It is not worth spending the time to do that.
Tham I think I’ve found the altercation. And if I’m right that person is no longer a member here.
Hi Lara, don t worry about it. We’ll let bygones be bygones and move on. Life is too short to bear grudges. Whenever anything unoleasant happens, I always reflect and see whether I am to blame in any way, and learn from it. It is enriching and good for the soul.
It’s not that I want to hold a grudge, I just wanted to keep an eye out that the same person didn’t do it again. It’s because I really do want this to be a respectful polite place because it’s that kind of environment that will get more people sharing their ideas. Otherwise we devolve to the lowest common denominator in teh internetz, of which I consider YouTube comments to be indicative (that’s why I’ve turned them off on my channel).
This is exciting. I can just see/feel a bullish move coming. Whether its a tiny Bear correction within a Down wave or a Blast off from Bull Hrly II count into wave 3.
I’m sure Lara is working very hard to get these counts as accurate as possible because I remember she personally likes entries at wave 2 ends. (and who wouldn’t?)
Any ideas how NFP will push price in the AM? / \ ///, please no ~~
🙂 🙂
Although I’m neutral until either the bull or the bear gets invalidated, I do have a slight inclination towards the bear at the moment based on the fundamentals (central bank price manipulation, investors’ disinterest in gold, putdown by the media etc). So I’ll be nimble for the trade following the low at 1165-1166. A rough estimation puts the bear minute 2 at 1206-1207, at a 0.618 retrace of minute 1. This should happen in a 3-wave zigzag. The bull case is more straightforward, a strong 3rd wave (must be a 5-wave impulse) towards 1290 at 1.618 fibonacci ratio.
Matt–you are firmly a gold bear. How low do you think gold must go to hit bottom, the 950 level in Lara’s bear analysis or lower or higher?
I think Lara’s targets are within reason. However, I think it will take until at least October for the final low. The 1050-1080 area could be hit by July, then a shallow sideways drift (4th wave) before dipping briefly into the 900s.
I hope we get one last chance to enter shorts. It would be great if gold made one last pop over 1200 before heading lower. Provided gold can hold today’s low, I think a move to somewhere slightly above the high from a few days ago is doable. The best we can hope for is 1205-2012, before gold collapses. Again that is only if today’s low holds. Otherwise the next pause will be 1130-40.
Matt, thanks, I follow your posts as you have well thought out position. I can agree with either Lara’s bear or bull as either can take gold below 1000 in next 12 months. Big question is which (bear or bull) can turn from low and take gold back up (over several years) to $2000 – $5000 ?
Ok so Gold price has made a low of 1172.50, where does one go from here now?
Lara: I subscribe to the bear count. Could gold have had an extended 5th wave to today’s low? Thanks.
I see one more wave down in nugt to a new low to end the 5th of a 5th
Actually it looks like we completed a 5th of a 3rd at today’s low
Or perhaps today’s low – if it holds – could be a complete 5 down marking the end of minute i (bear count).
Yes, most certainly. It could even get below 1,142.82 invalidating the bull count, but I think that’s unlikely. I think we shall not have full clarity between bull and bear for a while yet. But the positive note is they’ll both expect the same direction for at least a week.
Hourly bull was invalidated below 1178.08 at 8:31 am
New hourly bull charts will be issued tonight.
It looks like Hourly Bull II is in play and gold may drop to 1165 target area. I’ll buy back my GDX then that I sold higher up at 1 pm Thursday.
Any update from yr friend on super momentum indicator??
Super indicator guy said last night.
Big down before big up.
Said gold dropped down to 1169 on May 1st before it went up to 1230 May 18th.
USD down and Gold down????? Pls explain!!!!!
This has been going on for a few days already. I think the way that you can view the relationship between the two is that gold will go in the direction that it chooses. However, the USD has the ability to amplify or restrict gold’s natural movement. For example, while the dollar was plummeting, gold was barely rising. This was proof that gold was weak, as we’ve seen this week. on the flipside, if gold is falling, and the dollar is moving up (even if just in that moment), gold will drop even faster.
It looks to me like the USD is finishing up a 2nd wave correction and may soon start a 3rd up. This will make any sustained rise in gold rather unlikely over the coming weeks. What happens before the weekend is a whole other story.
Second though, I think it wi need to make one more low 1174. GLD needs to make a new low intra day 129.96 target
OR gold may be cascading down to 1131 -1141???
Patrick, Gold seems to be bouncing on 1174 support.
Lara mentions 1165 as a lower target with no mention of 1174. Any particular reason you said “we need to make one more low 1174”?
Gold just made low 1173. Good call.
Papudi. Looks like 5 of C cOmpleted. Or. It could be 1 of 5 of C just completed
Lara: “After completion of minor wave 2, then a new high above 1,142.82 would leave this as the only bull wave count.”
Lara for second daily bull count above did you mean “1242.15” rather 1142.15????
Lara: “Within minor wave 2, minute wave c has not yet managed to move below the end of minute wave a at 1,178.59. It is highly likely to move at least below this point to avoid a truncation and a very rare running flat. ”
Gold just moved below 1178 and trading at 1177.
#rd of 3rd of 3rd bear count in effect. SHORT.!!!!
Gold price has repeatedly been rejected from between 1183-85 but the drops have invariable been held between 1182-80…. What do we get now – an impulse move up or an impulse move down? Gold price has not yet played out the red herring (decoy) of a break below 1178-77 which could then see Gold price run down to 1172 or maybe Gold price makes a U-turn from 1178-77 to go blasting through 1191-93++…. ?? Dang~!
There really seems to be no strength in gold
Rambus $HUI chart shows we are right on support. A breakdown here could mean much more down for the miners. My bet is a bounce up is due, then we’ll see what happens.Rambus public post
The Physical demand for gold is massive. You cannot see this on the chart. The eco news was poor. Without central bank intervention gold would be well into the 1200’s. Large bullion buyers are having a field day at these prices so it cannot be maintained.
Price has been positioned lower prior to NFP release on Friday so i except poor figures which will be bullish for the metals.
You cannot see any of this on the charts.
Sentiment: Gold price will be lucky to get past pivot 1186-87 for 1191-93 likely to be driven down to 1177-72 and possibly lower…. I would look to take my money off the table at the lower band though…. On a weekly outlook basis, 1151 is the take down price I would be looking for~! //// Good luck everyone. It is great to have Lara’s analysis which only gives me growing confidence on how I trade this. Thank you Lara.
Lara: your knowledge of EW is amazing. To day I was clueless what happen. Today’s analysis requires deep knowledge of EW.
Thanks for your hard work and great effort to make it right.
For members here is a video of Rick Akerman;s gold forecast
:
Rick Ackerman Gold target
What happened today was there was concerted intervention by COTS and the bullion banks/central banks to push price down as often happens prior to the release of non farm payroll data. Traders are on the sidelines prior to NFP. Price was driven down, so expect poor NFP results (bullish for GC and SI). The market will be dominated by HFT algos until NFP released.
What happened to the Alt bear count from yesterday wh ere a new low below 180 would merit serious consideration?
Paul the Alternate Daily Bear count from yesterday is now the main Daily Bear count and yesterday’s main daily bear count is gone.
The main bear count had an invalidation point at 1,180.36. It was invalidated. So that left just one bear wave count. It’s the one which was an alternate, now is the sole bear count.