
A small inside day fits both Elliott wave counts at the hourly chart level. The Elliott wave counts remain the same.
Summary: Structure indicates it is still more likely we shall see a little more downwards movement before this wave is over; the target is now calculated at two degrees to a small zone of 1,157 – 1,154. However, the green candlestick for Monday’s session is slightly concerning, although it does have lower volume than prior down days so it may be a correction against this trend. A new high above 1,179.60 would indicate the downwards wave is over and the next wave up is underway. A new low below 1,162.80 would indicate the final fifth wave is incomplete and downwards movement should continue towards the target zone.
To see the bigger picture and weekly charts go here.
Changes to last analysis are italicised.
Bull Wave Count
Click chart to enlarge.
The bull wave count sees primary wave 5 and so cycle wave a a complete five wave impulse on the weekly chart.
Pros:
1. The size of the upwards move labelled here intermediate wave (A) looks right for a new bull trend at the weekly chart level.
2. The downwards wave labelled intermediate wave (B) looks best as a three.
3. The small breach of the channel about cycle wave a on the weekly chart would be the first indication that cycle wave a is over and cycle wave b has begun.
Cons:
1. Within intermediate wave (3) of primary wave 5 (now off to the left of this chart), to see this as a five wave impulse requires either gross disproportion and lack of alternation between minor waves 2 and 4 or a very rare running flat which does not subdivide well. I have tried to see a solution for this movement, and no matter what variation I try it always has a major problem.
2. Intermediate wave (5) of primary wave 5 (now off to the left of the chart) has a count of seven which means either minor wave 3 or 5 looks like a three on the daily chart.
3. Expanding leading diagonals (of which intermediate wave (A) or (1) is) are are not very common (the contracting variety is more common).
4. The possible leading diagonal for minor wave 1 and particularly minute wave ii within it look too large.
For volume to clearly support the bull wave count it needs to show an increase beyond 187.34 (30th April) and preferably beyond 230.3 (9th April) for an up day. Only then would volume more clearly indicate a bullish breakout is more likely than a bearish breakout.
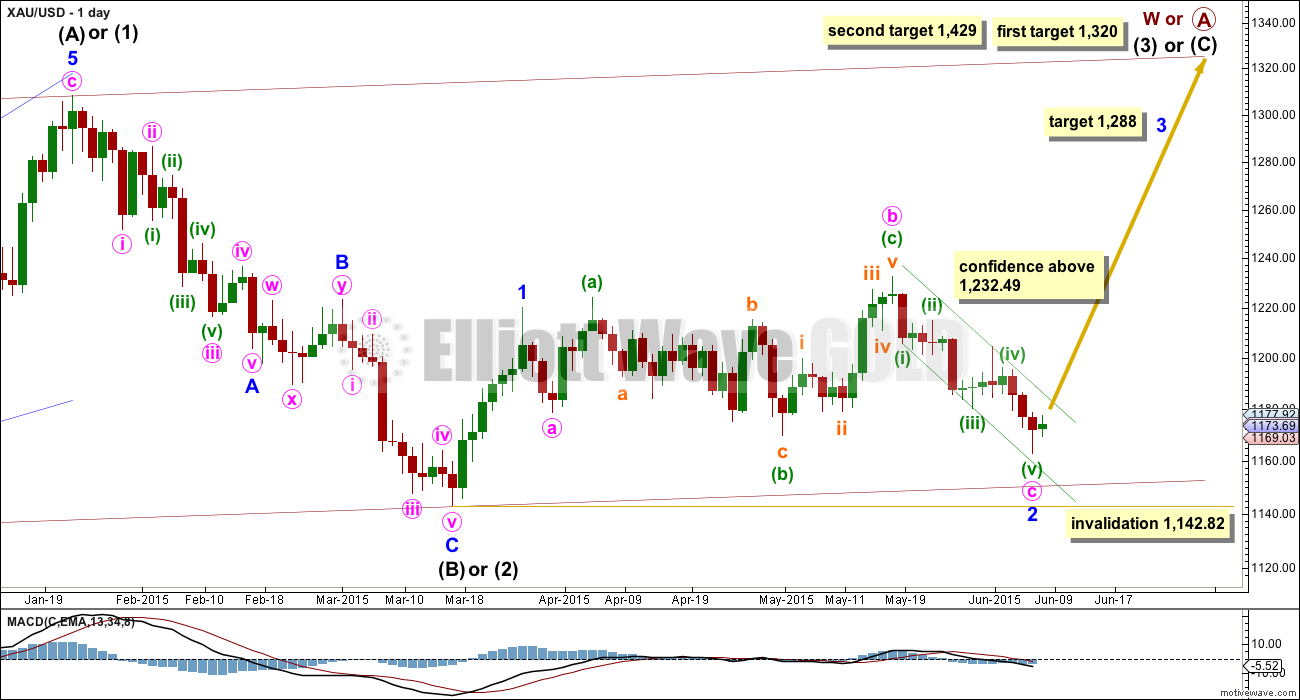
Within cycle wave b, primary wave A may be either a three or a five wave structure. So far within cycle wave b there is a 5-3 and an incomplete 5 up. This may be intermediate waves (A)-(B)-(C) for a zigzag for primary wave A, or may also be intermediate waves (1)-(2)-(3) for an impulse for primary wave A. At 1,320 intermediate wave (C) would reach equality in length with intermediate wave (A) and primary wave A would most likely be a zigzag. At 1,429 intermediate wave (3) would reach 1.618 the length of intermediate wave (1) and primary wave A would most likely be an incomplete impulse.
Intermediate wave (A) subdivides only as a five. I cannot see a solution where this movement subdivides as a three and meets all Elliott wave rules (with the sole exception of a very rare triple zigzag which does not look right). This means that intermediate wave (B) may not move beyond the start of intermediate wave (A) below 1,131.09. That is why 1,131.09 is final confirmation for the bear wave count at the daily and weekly chart level.
Intermediate wave (C) is likely to subdivide as an impulse to exhibit structural alternation with the leading diagonal of intermediate wave (A). This intermediate wave up may be intermediate wave (3) which may only subdivide as an impulse.
This bull wave count sees minor wave 1 a short brief impulse and minor wave 2 now an expanded flat correction. Within minor wave 2, minute wave c has now moved below the end of minute wave a at 1,178.59 avoiding a truncation and a very rare running flat.
It is possible that minor wave 2 is over here. If it is, then minute wave c is just 2.7 longer than 1.618 the length of minute wave a. At 1,288 minor wave 3 would reach 1.618 the length of minor wave 1. If minor wave 2 moves lower, this target must also move correspondingly lower.
Minor wave 2 may not move beyond the start of minor wave 1 below 1,142.82.
After completion of minor wave 2, then a new high above 1,232.49 would eliminate the bear wave count and provide full confidence in the targets.
Click chart to enlarge.
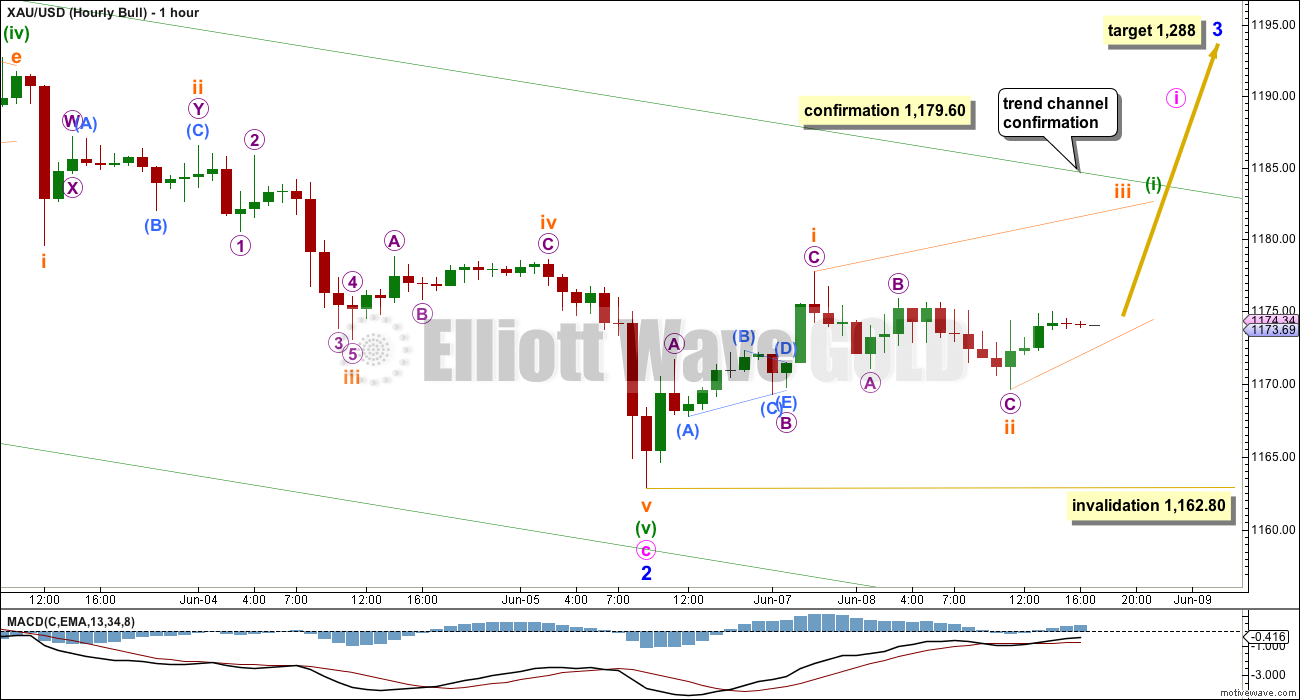
As for last analysis, both hourly charts work for the bull and bear wave counts in exactly the same way. This first hourly chart looks again at the possibility that this downwards movement is over and the next wave up has begun.
On the five minute chart, I cannot see the wave up labelled subminuette wave i as a five, but it does fits nicely as a three with a running contracting triangle for micro wave B.
The following wave down for subminuette wave ii also looks like a three on the hourly chart.
If downwards movement is over now, then a leading diagonal may be unfolding in a first wave position for minuette wave (i). For the bear count this would be minuette wave (a).
Leading diagonals are not rare but they are not very common either. Any wave count which sees a three in the expected direction of trend and so reverts to a diagonal is often suspect in my experience. This is the main reason why today I consider it more likely that we shall see yet a little more downwards movement as per the hourly chart for the bear count below.
Within a leading diagonal, sub waves 1, 3 and 5 are most commonly zigzags and sub waves 2 and 4 must be zigzags. The most common depth for waves 2 and 4 is between 0.66 to 0.81 the prior wave. Here subminuette wave ii is just 0.54 of subminuette wave i, which is shallower than normal.
This wave count absolutely requires confirmation before confidence may be had in a trend change. A new high above 1,179.60 would provide price confirmation. A breach of the best fit channel would provide trend channel confirmation, which may come second.
Subminuette wave ii may not move beyond the start of subminuette wave i below 1,162.80.
Bear Wave Count
Click chart to enlarge.
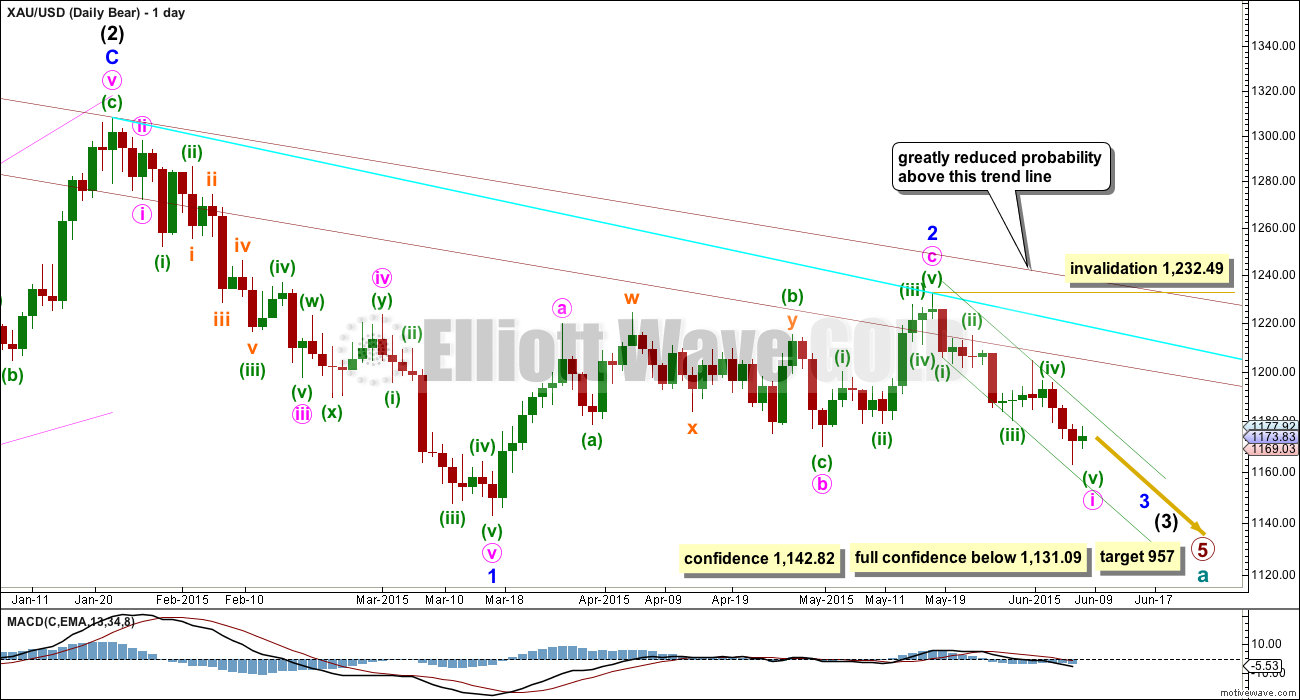
This wave count follows the bear weekly count which sees primary wave 5 within cycle wave a as incomplete. At 957 primary wave 5 would reach equality in length with primary wave 1.
Pros:
1. Intermediate wave (1) (to the left of this chart) subdivides perfectly as a five wave impulse with good Fibonacci ratios in price and time. There is perfect alternation and proportion between minor waves 2 and 4. For this piece of movement, the bear wave count has a much better fit than the bull wave count.
2. Intermediate wave (2) is a very common expanded flat correction. This sees minor wave C an ending expanding diagonal which is more common than a leading expanding diagonal.
3. Minor wave B within the expanded flat subdivides perfectly as a zigzag.
4. Volume at the weekly and daily chart continues to favour the bear wave count. Since price entered the sideways movement on 27th March it is a downwards week which has strongest volume, and it is downwards days which have strongest volume.
5. On Balance Volume on the weekly chart recently breached a trend line from back to December 2013. This is another bearish indicator.
Cons:
1. Intermediate wave (2) looks too big on the weekly chart.
2. Intermediate wave (2) has breached the channel from the weekly chart which contains cycle wave a.
3. Minor wave 2 is much longer in duration than a minor degree correction within an intermediate impulse normally is for Gold. Normally a minor degree second wave within a third wave should last only about 20 days maximum. This one is 44 days long.
4. Within minor wave 1 down, there is gross disproportion between minute waves iv and ii: minute wave iv is more than 13 times the duration of minute wave i, giving this downwards wave a three wave look.
Minor waves 1 and 2 are complete. Minute wave i within minor wave 3 may be incomplete on the hourly chart.
Minute wave ii may not move beyond the start of minute wave i above 1,232.49.
The bull and bear wave counts both see a five wave impulse down either incomplete and requiring a final fifth wave, or complete at Friday’s low.
If this impulse takes price below 1,142.82, then the bull wave count would be invalidated. But only a new low below 1,131.09 would invalidate any variation of a bull wave count and provide full and final confirmation for a bear wave count.
When this five wave impulse is complete, then the bull wave count will expect a third wave up and this bear wave count will expect a second wave correction. At that stage, the bear wave count would be invalidated with a new high above 1,232.49 and the bull wave count would be confirmed.
Click chart to enlarge.
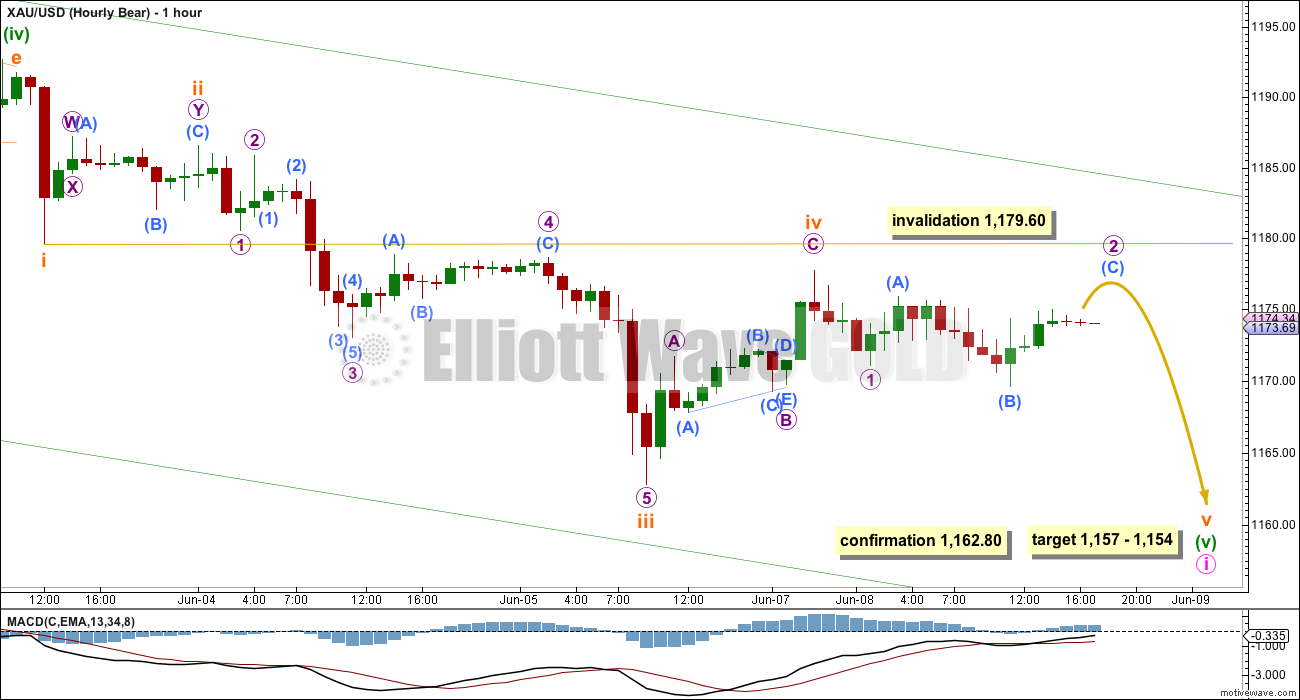
This hourly chart works in the same way also for the bull wave count. For both bull and bear wave counts it remains likely that we shall yet see more downwards movement for Tuesday.
If minuette wave (v) is not over, then at 1,157 it would reach equality in length with minuette wave (iii). Both minuette waves (iii) and (v) would be extended.
At 1,154 subminuette wave v would reach equality in length with subminuette wave iii. This gives a $3 target zone calculated at two wave degrees.
Subminutte wave ii was a deep 0.57 combination. Subminuette wave iv may be complete now as a deep 0.65 single zigzag. There is reasonable alternation between them.
It is also possible that subminuette wave iv may be continuing further sideways as a contracting triangle. This idea would expect sideways movement in an ever decreasing range yet for several hours, maybe even another whole day, before downwards movement resumes. This would introduce a problem of gross disproportion and so it is more likely that subminuette wave iv is over.
Subminuette wave iv may not move into subminuette wave i price territory above 1,179.60. At any stage a new high above 1,179.60 would indicate that minute wave i is over and minute wave ii would be underway for this bear wave count. For the bull wave count it indicates a third wave up would be underway.
Technical Analysis
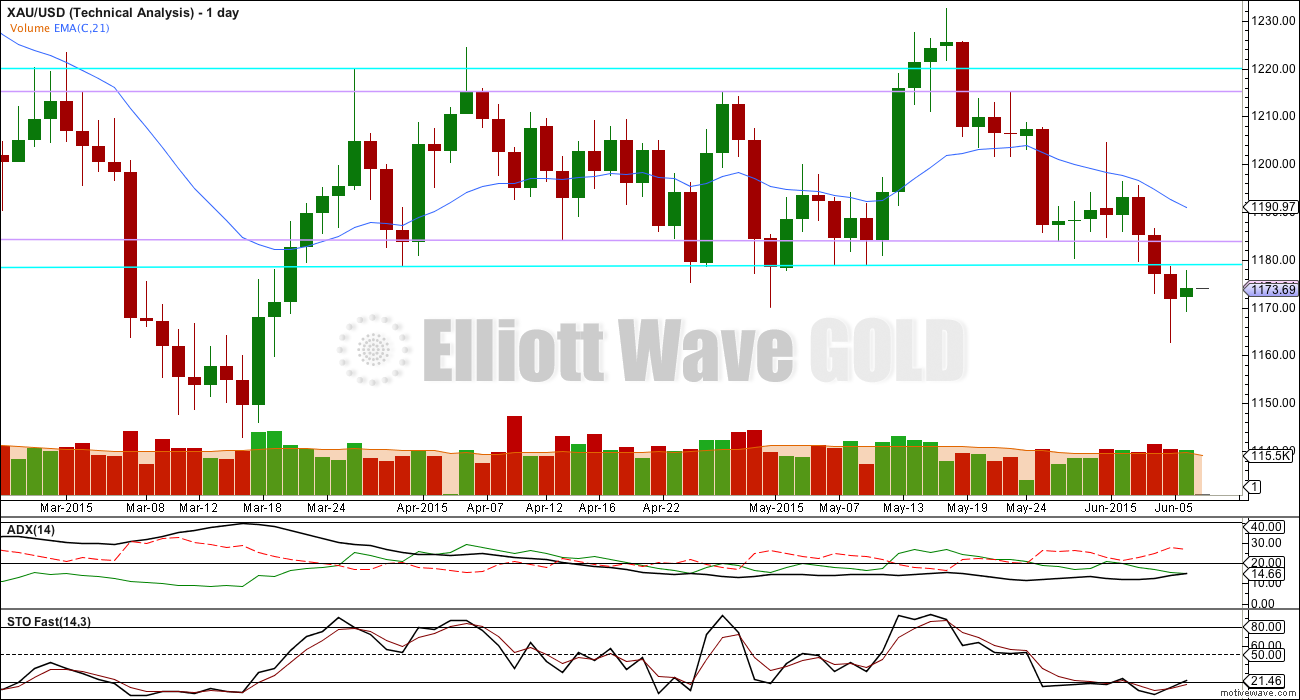
Click chart to enlarge.
ADX is turning up, but is still below 15 at 14.66 for Monday. This indicates there is still no clear trend. For a trend to be indicated ADX must be at 15 or greater, and this indicator is clearer if ADX is at 20 or higher and rising.
The long lower wick of Friday was a slightly bullish indicator, and the small green candlestick fits this picture. This TA approach uses horizontal lines of support and resistance, with fast Stochastics to indicate overbought and oversold. This approach indicates an upwards swing has begun from here.
Price seems to be finding resistance at the lower aqua blue trend line which previously provided support. It is very important to wait for this trend line to be breached by upwards movement before having any confidence that an upwards swing is underway. While price remains below that trend line ADX should be watched carefully; if Tuesday’s session forces ADX to rise to 15 or greater than a downwards trend would be indicated and the start of a new bear market could be underway.
Volume continues to indicate a downwards breakout is more likely than an upwards breakout. Since price entered this sideways consolidation phase back on 27th March, it is downwards days and downwards weeks which have the strongest volume which is significant. A bearish breakout may be unfolding, but is still unconfirmed. Caution is advised until the picture becomes clearer.
For the lower aqua blue trend line to indicate a bear breakout it should be breached by a CLOSE of 3% or more of market value. That price point would be at 1,143.23.
This analysis is published about 06:39 p.m. EST.
I’m leaving comments now to write that up and finish charts.
For the bear wave count also two ideas at the hourly chart level: main idea minuette wave (v) is incomplete and unfolding as a very long extension, target still 1,157 but may be too high. The last two days upwards movement a double zigzag for subminuette wave ii, so it’s not moving into subminuette wave iii down. Upwards movement should end here, it’s finding resistance at the upper edge of the green channel. The second idea sees minute wave i over and minute wave ii now underway. Within it minuette wave (a) is a complete double zigzag which means minute wave ii is a flat, which means minuette wave (b) within it must be 90% of minuette wave (a) so it must move down to 1,164.82 or below, and may make a new low. Choppy overlapping movement in a reasonably big range for another two to three days to complete minute wave ii. Invalidation point 1,232.49.
I’m going to present a chart for main and alternate ideas for bull and bear hourly now, not try to have two ideas fitting both counts. For the bull count: hourly main sees a leading contracting diagonal unfolding up for minuette wave (i). Minor wave 2 is over. The leading diagonal is incomplete, it’s either just in or just finished the fourth wave which can’t be longer than the second so can’t move below 1,174.91. For the bull count an alternate sees minor wave 2 down incomplete, minuette wave (v) unfolding as a very long extension and moving now into subminuette wave iii. The last two days may have been a second wave correction for subminuette wave ii which can’t move above 1,191.71. It’s now a complete double zigzag.
Lara,
The miners are in the red about 1% yet gold is in the green about $5, might that foretell of a down day Tuesday as they say the miners often lead gold?
Hourly bull got price confirmation but couldn’t get through the upper trend channel. So it appears we have a weak bull so far.
I take it gold is still working on minuette wave (i).
Is your lower range of 1157 – 1154 gone?
Yes, most definitely. This upwards movement is either the early stages of a third wave (bull) or a second wave correction (bear). It can’t be a fourth wave correction, the final fifth wave is over. There are now two green candlesticks on the daily chart. This is not a smaller subminuette degree correction, it should be something a bit bigger. A channel breach and finally a new high above the start of minuette wave (v) at 1,191.71 would provide further confirmation if you need it. A new high above 1,191.71 may not be a second wave correction within minuette wave (v) and so at that point minuette wave (v) could not continue as a very long extension.
good question. based on miners, DXY, and slow XAU looks to be prepping for drop. (look what DUST did today) Hopefully Lara will clarify.
Both bull and bear and still possible.
Richard: we (or I) were just getting lost in semantics. What I was stating was what Lara just confirmed. The bear count is very much alive and creating a last chance opportunity over these next few days for us to be a part of the last bigger wave down. I believe that gold will correct up for a few days (probably to end on or around June 17th), followed by a 3-5 week plunge of $120-150.
Matt gold bullish maybe until June 17th would be great. I just bought some GDX at the day low, and almost Monday’s low, very cheap IMO.
Richard, I should be clearer. My “yes” was in response to your last point; Gold hourly bull was invalidated. My answer was actually all wrong!
The hourly bull wave invalidated. The only way this fifth wave of minuette wave (v) (works for both bull and bear daily counts) could continue will be if this upwards movement of the last two days is a second wave correction within a very long extending fifth wave. This is a possibility I must consider, but I also consider it to have a low probability because this two day rise is a bit long in duration for subminuette degree. So what’s more likely now is Gold is in either a second wave correction up (bear count) or the start of a third wave up (bull count)
Thanks for clarifying.
Lara you just mentioned “The hourly bull wave invalidated.”
Lara your hourly bear had invalidation at 1179.60 and gold went above and invalidated that. Your hourly bull confirmed above 1179.60.
You mention there is a low probability minuette wave (v) may continue. …what’s more likely now is Gold is in either a second wave correction up (bear count) or the start of a third wave up (bull count).
Lara that sounds near term bullish to me. I just bought some GDX.
The hourly bull has been playing out since the hourly bear is invalidated. Was 1184.54 high today the top of bull wave iii or wave (i)? If we take 7:39 am high today of 1183.07 less 1162.83 low Friday 9:25 am, .618 down of that would give a retrace low of 1170.56 IF my calculations are correct?
Alan mentioned first drop of 1172.
1174.76 is retrace 0.618 target of todays high 1183.07 at 7:39 am less 1169.62 Monday low 11:05 am
Expecting Gold price to drop deeper to 1170-69 with a break below here likely to seek 1165….
I have the first drop at around 1172.
I’d be curious to know what you are basing this short term lower movement on, Syed and Tham?
Tham: you made the case below that subminuette iv could be a double zigzag, but don’t you still have the problem of a 4th wave moving into 1st wave price territory?
Thanks. I always appreciate your contributions.
Maththias: With 1177-79 now seen as resistive expecting downside 1170-69 and 1165 based on Parabolic SAR and 1st level / 2ns level pivot… I haven’t a clue about wave counts, and learn every day from the posts here; the wave counts help supplement my own assessments; am just a newbie…. 🙂
Hi Matt. I consider that the fifth wave down is moving in a channel, as shown in Lara’s graph of the bear count. It could be an ending diagonal, in which case wave 4 would need to move into wave 1 territory, as you pointed out. The wave count I use for the fifth wave continues from the channel idea.
Thanks Syed. If you subscribe to the daily bear count, then gold should be trying to form an ABC correction to the .382 – .618 retracement of the movement from 1232.49 to 1162.80. The target zone would then be 1189.42 – 1205.86.
On an intraday level, I am personally lost at the moment. 🙂
Matthias: Thanks for your help. On monthly cycle basis, I am bearish Gold for >>1158>>1146>>1129>>lower… Presently it would take a break above 1182-83 to seek higher with upside risk no more than 1199-1200… Somehow, just need to see confirmation from Gold price that an interim top has been made at 1204-05 lol….
You are spot on!
Any wave count, curious how low this retrace can go now around 10:12 am EST before continuing bull up, since hourly bear invalidated? Looking to buy GDX near a low on the way up today.
Thanks Richard.
You’re welcome. Matt
The Gold price conundrum for me: Looking difficult to see Gold price land on its feet below 1179 at 1175/68… hmmm
i like the bear count
re label orange iii to = 1 down
orange iv = a and we are completing c of 2 ~ 1185, top of the downward sloping trent line to kickoff 3 down. timing works well with yellins upcoming speech. too slow, to weak, too choppy for the start of 3 up imo
You describe a zigzag up. The a wave would need to be a 5, but it looks like a 3. That may be a problem for this idea.
COT data and sentiment have issued buy signals which have generally initiated decent bounces.
http://safehaven.com/article/37900/gold-and-silver-update
Gary Savage : GOLD: SURVIVING THE LAST FEW MONTHS OF THE BEAR MARKET PART II—————- Read More
Gary Savage——surviving next bear market in gold. ——————-Read more
Gold trading at 1181. Bear hour wave count invalidated and Bull hour wave count is confirmed. Gold is going higher to 1232 from here. —————–
Thanks Lara.
Hi. 1200 still seen as limiting the upside…. I am not too sure if Gold price will take flight for 1232~!
Looking at Gold price go, the retracement .50 of H1204.7 / L 1162.10 at 1183-84 expecting with Lara has upside target 1188 that’s .618 of the H/L… I expect a huge drop from these levels.. Will just have to wait until Lara’s next analysis~!
I tend to agree with Syed. The market sentiment is still rather bearish as gold needs to complete the larger bear trend at sub-1000. The current upwards movement is seen as a correction to the short term bear trend. The hourly bear is invalidated, but the daily bear count is still valid as Lara says it is invalidated only above 1232.49. As Lara has not yet come out with an alternative bear count, I need to look at possibilities for the day’s trade. I surmise that subminuette 4 is a double zigzag instead of Lara’s simple zigzag. It goes 1162.83 – 1177.75 (Lara’s original subminuette 4) – 1169.62 – today’s high, currently 1182.41. Based on Fibonacci ratios, this upwards move ought to terminate slightly higher at 1184.54. Let’s see whether it would go higher or drop from here. Subminuette 5 then would drop by the same length as subminuette 3 (Lara says it is an extended fifth).
Tham: For some reason, I didn’t see your comment when I replied to Papudi. Gold is definitely weak and any movement above 1190 is a great opportunity to short, if you ask me. However, gold is not there now.
Have you considered that gold could just be in some kind of B wave correction, instead of looking much lower? We know how nasty and confusing those B waves can be.
Hi Matt. The other possibility is the bull case that Lara posted. This will still be a diagonal. It now requires a fifth wave to complete, with a target around 1184-1186. But, this is a bull wave and targets 1232 which I don’t think gold can attain (unless the US dollar plunges for whatever reason).
Hi Matt. You are right. The fourth wave is actually a WXY with 3-3-5 structure.
I have never subscribed to the daily bull, so that rules that one out for me. As for the bearish diagonal that you mention above, I think that the 2nd wave could look better. Also, I would tend to use the spike to the 1204-5 area at that time as the end of that 2nd wave. This, in turn, would make the 4th wave too short. To me this all doesn’t look right. I don’t have a better idea, but do now believe that a correction started at 1262.
Matthias – I believe you mean a correction started at 1162 and not 1262.
Matt, if the correction has begun at 1162, it would imply that the “downwards movement is over”. That would correspond to the bull case scenario with a target of 1232. If you do not subscribe to the bull case, same as me, then you will need to work with the case that the “downwards movement is NOT over”. I presented one possibility which seems to fit the current movement so far. Lara may have other ideas.
I thought that the hourly charts work for both bull and bear counts? Upward movement from 1162 would be the start of a 3rd wave for the bull case and a small 2nd wave correction for the bear.
Matt, June 4th was the last day that the hourly charts for bull and bear were the same. June 5th they were very different. June 8th hourly charts headed in opposite directions.
Richard and Tham: if it is as you say, then how do you interpret what Lara says from the 1:40 – 2min portion of the latest video?
Lara mentions at about 1:30 in video any movement above 1179.60 means the downwards wave is over and bear is in a 2nd wave up and bull is in a 3rd wave up and the price that differentiates them is 1232.49. (Which would invalidate the Daily bear wave count and provide confidence to the Daily bull wave count.)
Lara will provide a new hourly bear wave count.
Lara still leaves price to show us the way by confirming 2 or 3 levels of confidence in either bull or bear counts as gold is still in range bound, trend less territory.
Alan, I’m really struggling to see a diagonal unfolding and in it’s fourth wave for minuette wave (v). It would have to be expanding? My problem is with the second wave. It may only be a zigzag, it can’t be a combination or any other corrective structure. I’d really need a chart of your idea to see exactly what I mean. But I know that’s a major hassle without that upload button this week!
Hi Lara. I assume the case in which the downwards movement is not over, and attempted to modify the hourly bear wave count that you presented, because as is it has been invalidated by the rise to 1183.07. The first three waves are exactly the same: 1191.66-1179.60-1187.09-1162.83. I reckon one possibility is to have subminuette 4 as a 3-wave structure 1162.83-1177.75-1169.62-1183.07. Subminuette 5, if at the same length of subminuette 3 (to avoid a truncation), would reach 1158.81.
The Bear wave count has not been invalidated.
Gold is not going to 1232. Lara was referring to an hourly chart when she talked about the break above 1179. Gold should retrace to 1190-1205 area. At that point, I would much rather be short.
This is also a pretty weak start to upward movement, indicating that gold could more likely be correcting.
The DSI or Daily Sentiment Index DSI for Gold was only 15% Bullish Gold June 4th.
Sentiment / Socionomics
The Daily Sentiment Index based upon %BULLS polled as of June 4th (Thursday’s Close):
see Gold it is 20th down the list on the left side
http://www.tag618.com
Gold Mining Bulls Stage Important Reversal – Tradeable Rally Next? Jun 09, 2015 04:26AM GMT – Good GDX charts & Sentiment
http://www.investing.com/analysis/goldies-stage-important-reversal-%E2%80%93-what%E2%80%99s-next-254368