
I have the same two Elliott wave counts for GDX. I favour the bear wave count.
GDX does not appear to have sufficient volume for Elliott wave analysis of this market to be reliable. It exhibits truncations readily, and often its threes look like fives while its fives look like threes. I will let my Gold analysis lead GDX, and I will not let GDX determine my Gold analysis for this reason.
Changes to last analysis are bold.
MAIN ELLIOTT WAVE COUNT
Click chart to enlarge.
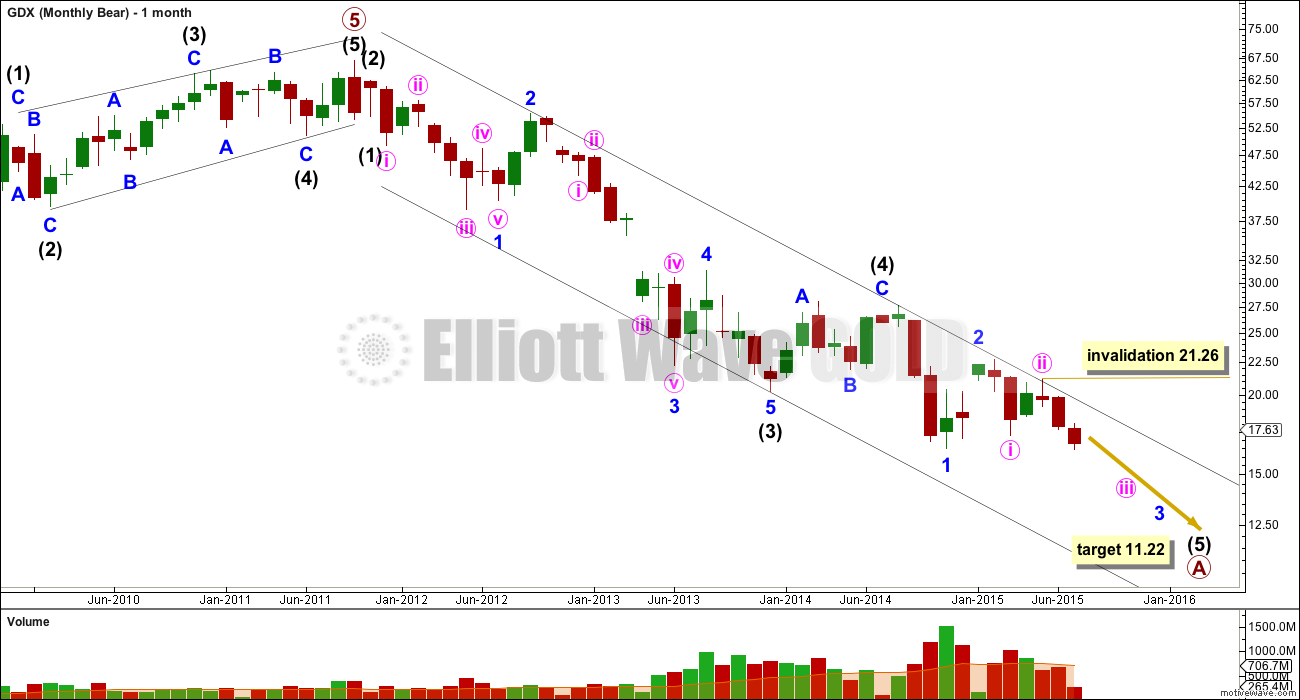
Price remains within the best fit channel on the monthly chart. A five wave structure down is completing, which may be an A wave within a larger correction.
Within minute wave iii, a second wave correction may not move beyond its start above 21.26.
At 11.22 intermediate wave (5) would reach equality in length with intermediate wave (1).
At this stage, regular technical analysis strongly favours the bear wave count. A downwards trend is clear and strong.
Click chart to enlarge.
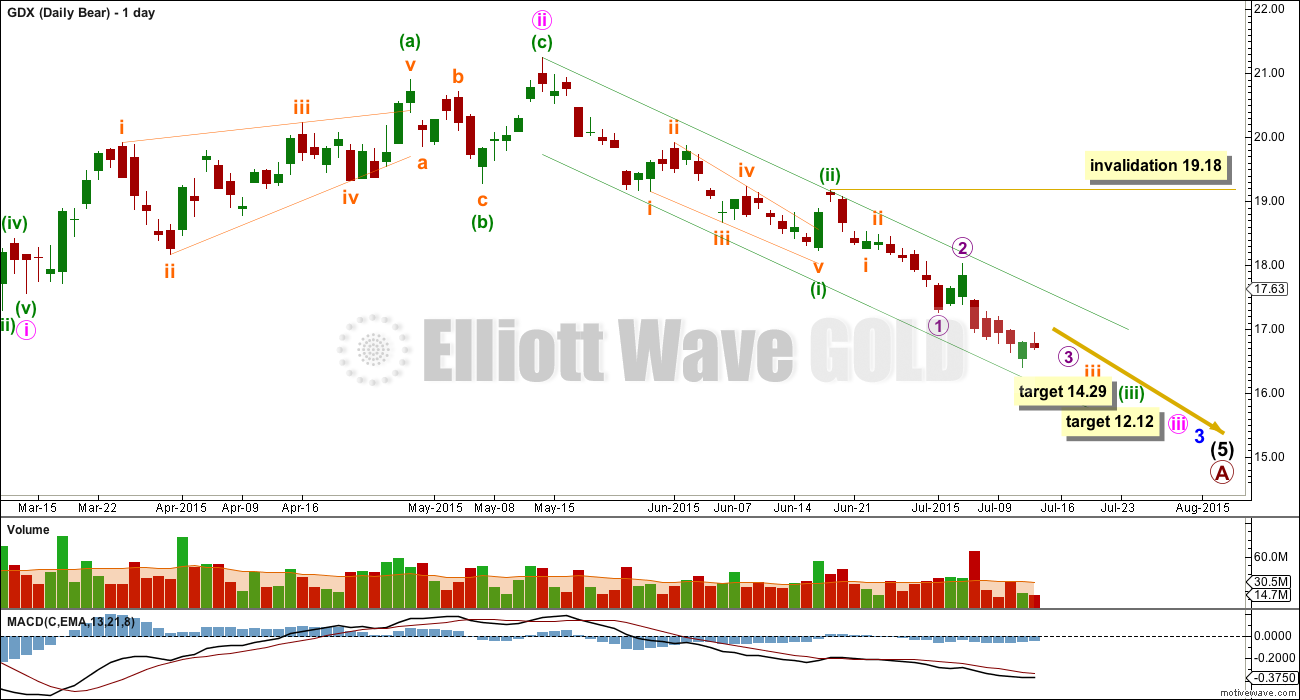
Intermediate wave (5) has now five overlapping first and second waves. This indicates strong downwards movement ahead.
I do not think the middle of this third wave has yet passed because downwards momentum has not yet shown an increase beyond that seen for minute wave i, or minor wave 1 (off to the left of the chart now) which was stronger still. Minor wave 3 may be expected to have stronger momentum than minor wave 1.
At 14.29 minuette wave (iii) would reach 1.618 the length of minuette wave (i). Minuette wave (iii) should have the power to break below support at the lower edge of the base channel. The strongest downward momentum may come for subminuette wave v within minuette wave (iii).
At 12.12 minute wave iii would reach 1.618 the length of minute wave i.
ALTERNATE ELLIOTT WAVE COUNT
Click chart to enlarge.
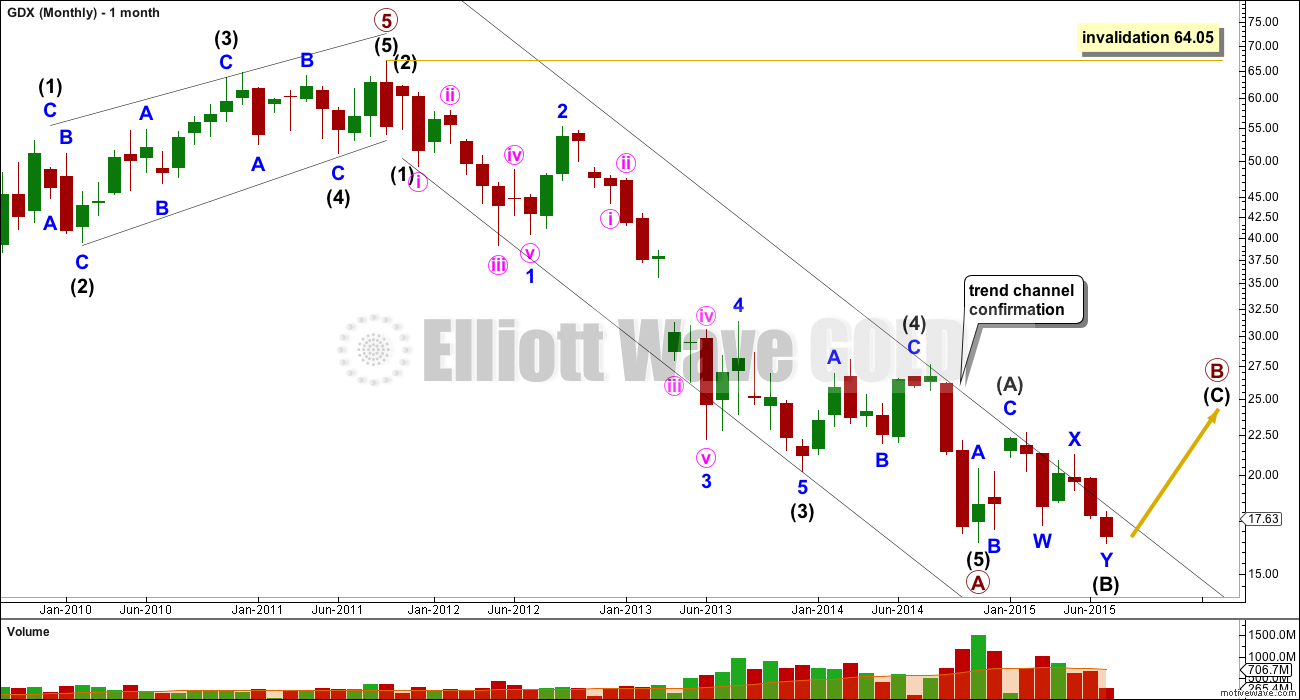
The alternate wave count expects that the five wave impulse is complete for primary wave A down. Within it, the extended wave is intermediate wave (3). Intermediate wave (3) is 0.11 longer than 2.618 the length of intermediate wave (1), and there is no Fibonacci ratio between intermediate wave (5) and either of (1) or (3).
The channel drawn about primary wave A down is a best fit. The upper edge is still providing resistance. For the main count (or any variation of it) to be discarded this trend line must be breached. That would provide trend channel confirmation that primary wave A is over and the next wave of primary wave B would then be underway.
Because primary wave A subdivides as a five, primary wave B may not move beyond its start above 64.05.
Primary wave B must subdivide as a corrective structure. At this stage, it looks now like it may be unfolding as a flat correction and within it intermediate wave (A) is a three, a zigzag, and intermediate wave (B) now a complete double zigzag.
Click chart to enlarge.
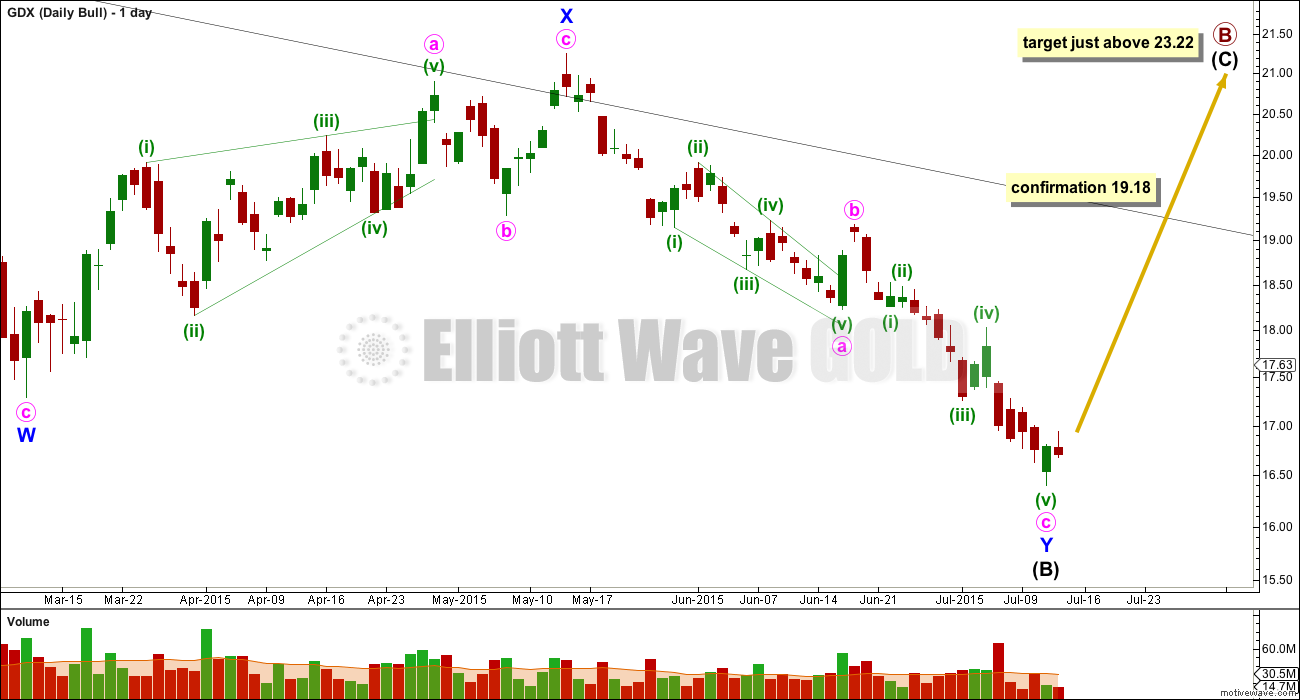
Intermediate wave (B) has reached below the minimum requirement of 90% of intermediate wave (A) for a flat correction, which was at 17.13.
There is no maximum length for a B wave within a flat, and there is no downward invalidation point for this wave count for that reason. The difference is in structure. Intermediate wave (B) must subdivide as a corrective structure, where the main wave count requires an impulse to complete downward.
Minuette wave (v) may yet continue lower.
A new high above 19.18 is required to confirm this wave count. At that stage the main wave count would be invalidated.
Intermediate wave (B) is a 101% correction of intermediate wave (A), at this stage, indicating a regular flat. If intermediate wave (B) does not move lower, then intermediate wave (C) may be expected to end at least slightly above the end of intermediate wave (A) at 23.22 to avoid a truncation and a very rare running flat.
TECHNICAL ANALYSIS
Click chart to enlarge.
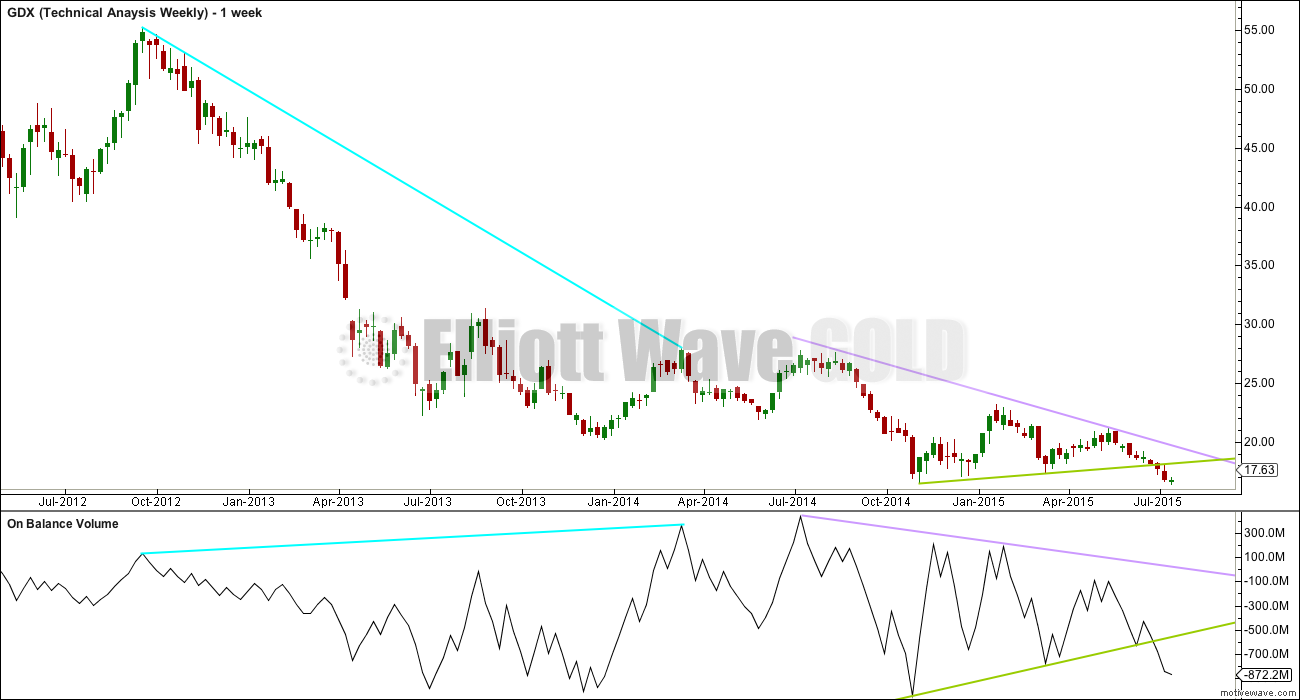
Blue Lines: from the high at 55.25 to the high at 28.03 price moved lower while On Balance Volume moved higher. This negative divergence may indicate a larger fall to come.
Lilac Lines: More recently, as price has made lower highs, OBV has also made lower highs. There is no divergence, so the fall in price is supported by a fall in volume.
Green Lines: Recently price has also made higher lows. Again OBV agrees. There is no divergence. Both price and OBV have broken below these lines, another bearish indicator.
Click chart to enlarge.
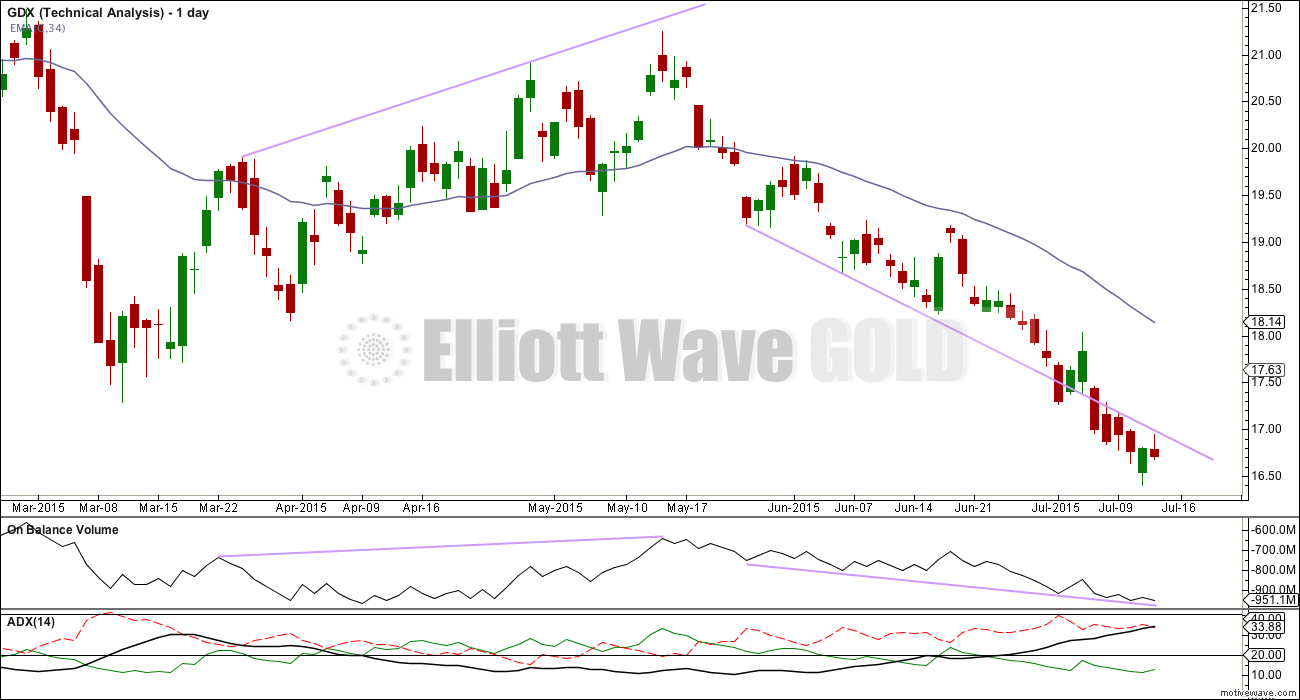
ADX continues to indicate a strengthening downward trend for GDX. On Balance volume continues to move lower along with price, the trend is supported by volume.
Price is below the 34 day EMA indicating a downward trend.
GDX is at this time clearer than Gold: there is a trend and it has been down for some time.
Click chart to enlarge.
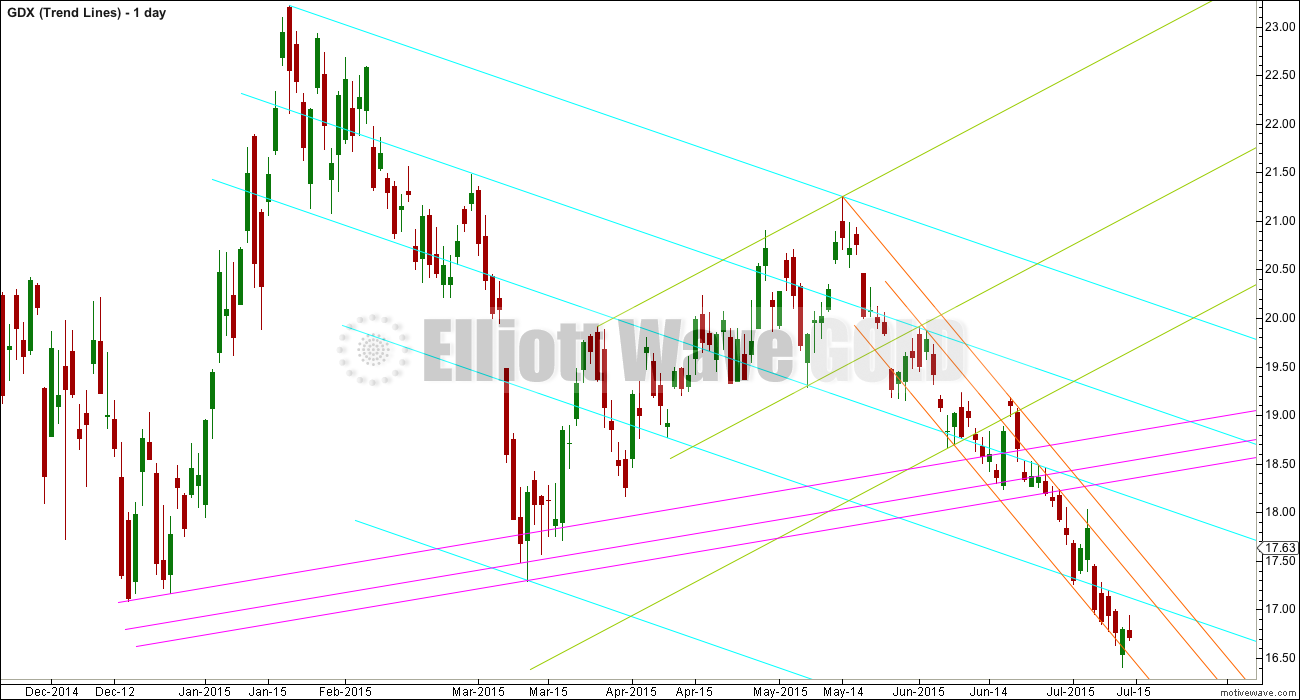
This is my own particular method of trend line analysis.
Each series of parallel lines is coded with a different colour. I use this approach to suggest potential areas of support and resistance.
Lara, your bearish count came back right on time, good warning for the huge drop we had today (and some more in the next few days). Many were expecting a nice bounce and got in yesterday. Ouch! Kudos to you.
Lara, thanks for the update. Very helpful to see that we are in an extended 3rd wave. Bob