
I have the same two Elliott wave counts for GDX. I still favour neither.
GDX does not appear to have sufficient volume for Elliott wave analysis of this market to be reliable. It exhibits truncations readily, and often its threes look like fives while its fives look like threes. I will let my Gold analysis lead GDX, and I will not let GDX determine my Gold analysis for this reason.
Changes to last analysis are bold.
BEAR ELLIOTT WAVE COUNT
Click chart to enlarge.
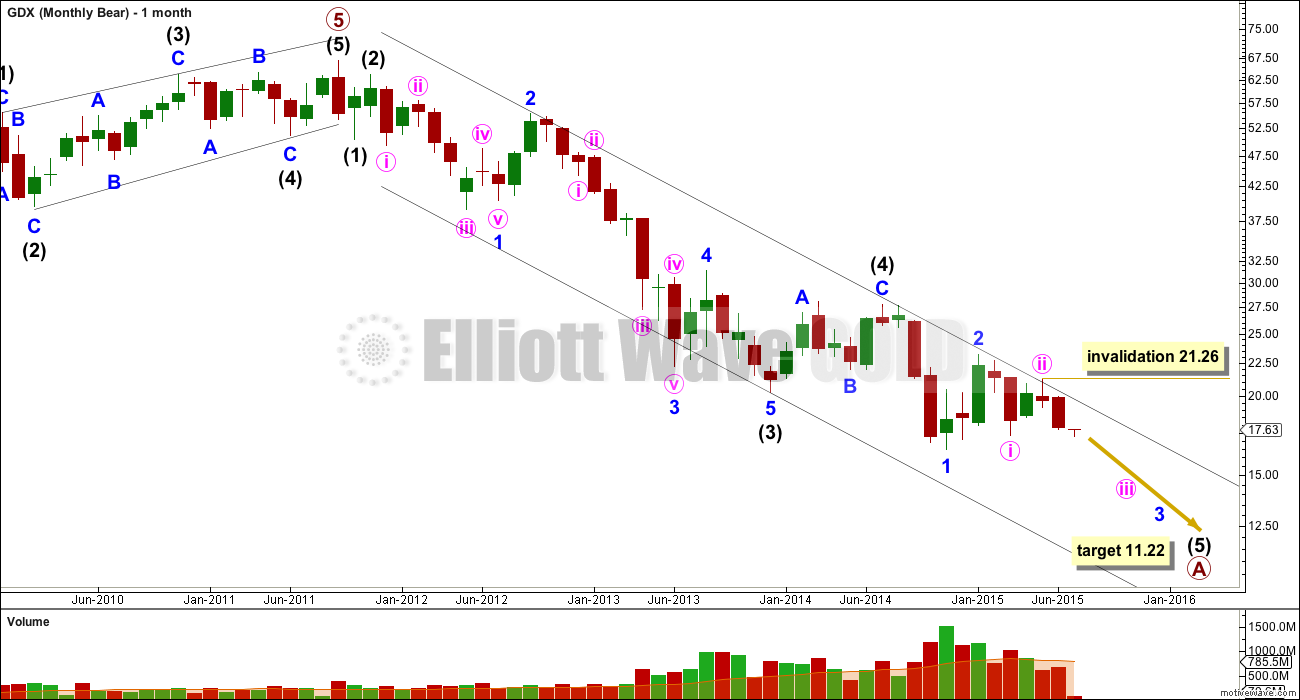
Price remains within the best fit channel on the monthly chart. A five wave structure down is completing, which may be an A wave within a larger correction.
Minute wave ii may not move beyond the start of minute wave i above 23.22.
At 11.22 intermediate wave (5) would reach equality in length with intermediate wave (1).
At this stage, regular technical analysis strongly favours the bear wave count. A downwards trend is clear and strong.
Click chart to enlarge.
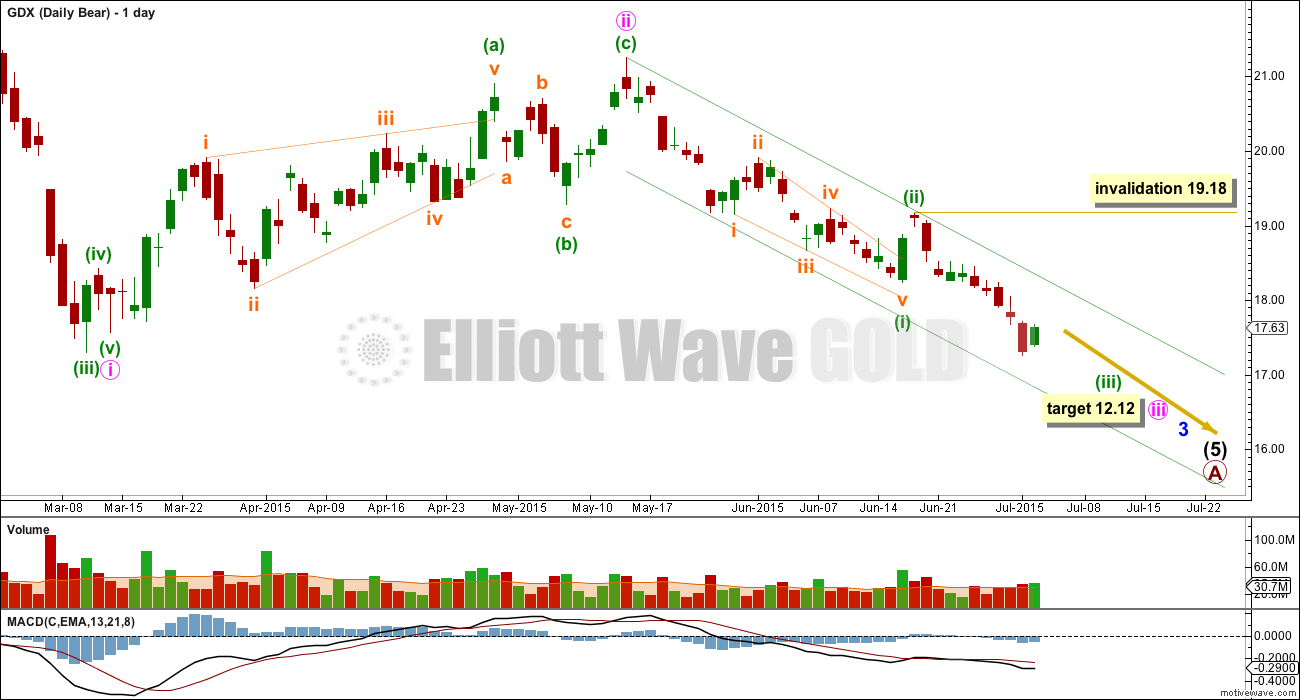
Intermediate wave (5) has now three overlapping first and second waves: minor waves 1 and 2, minute waves i and ii, and now also minuette waves (i) and (ii). This indicates strong downwards movement ahead.
At 12.12 minute wave iii would reach 1.618 the length of minute wave i.
Within minuette wave (iii), upwards corrections should find resistance at the upper green trend line. No second wave correction may move beyond the start of its first wave above 19.18.
Downwards momentum has not yet shown an increase beyond that seen for minute wave i, and so it should be expected to increase further in the next few weeks.
BULL ELLIOTT WAVE COUNT
Click chart to enlarge.
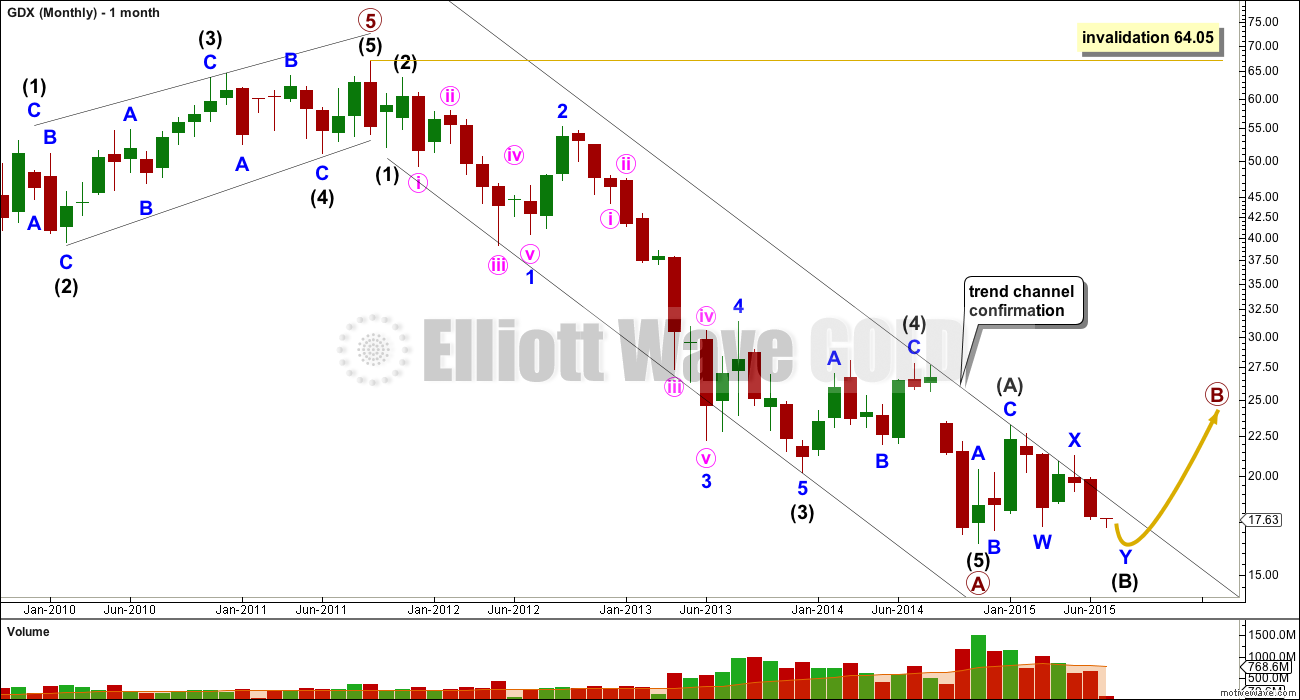
The bull wave count expects that the five wave impulse is complete for primary wave A down. Within it, the extended wave is intermediate wave (3). Intermediate wave (3) is 0.11 longer than 2.618 the length of intermediate wave (1), and there is no Fibonacci ratio between intermediate wave (5) and either of (1) or (3).
The channel drawn about primary wave A down is a best fit. The upper edge is still providing resistance. For the bear count (or any variation of it) to be discarded this trend line must be breached. That would provide trend channel confirmation that primary wave A is over and the next wave of primary wave B would then be underway.
Because primary wave A subdivides as a five, primary wave B may not move beyond its start above 64.05.
Primary wave B must subdivide as a corrective structure. At this stage, it looks now like it may be unfolding as a flat correction and within it intermediate wave (A) is a three, a zigzag, and intermediate wave (B) is an incomplete double zigzag.
Click chart to enlarge.
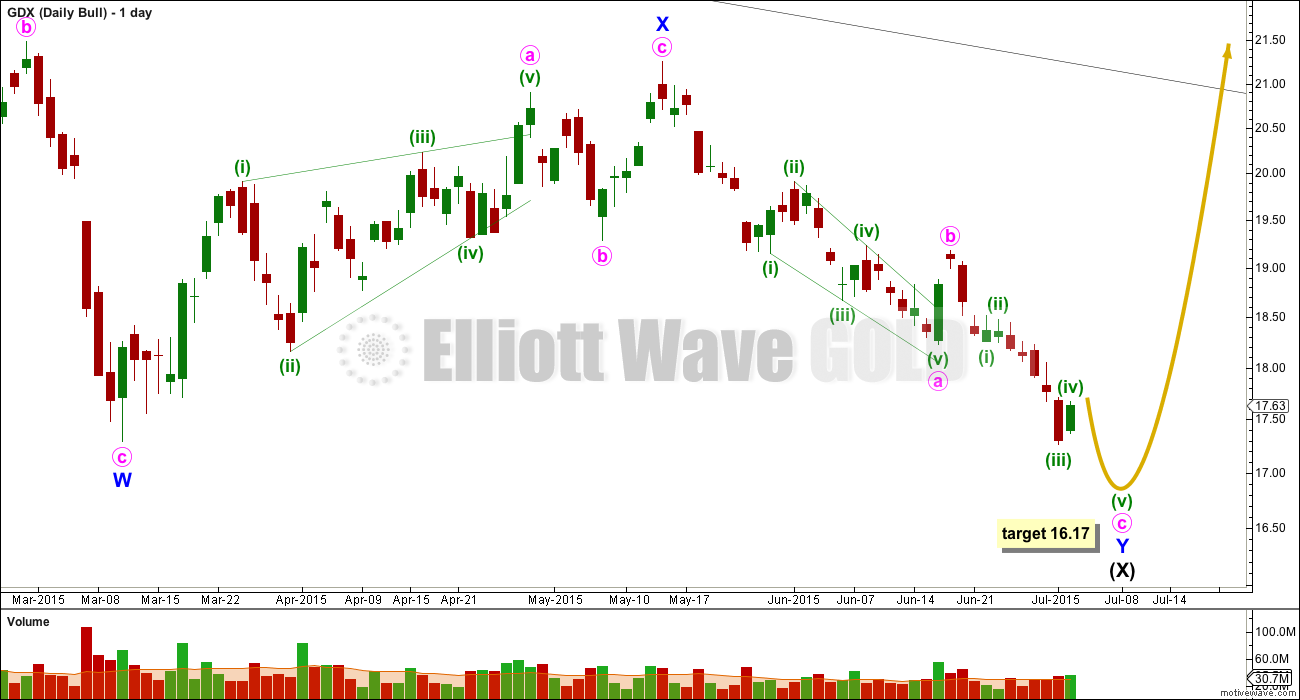
If intermediate wave (B) reaches 17.13 or below, then the minimum requirement for it to correct to 90% of intermediate wave (A) for a flat correction would be met. Because the downwards structure within intermediate wave (B) is incomplete, it looks very likely that this minimum would be met.
Intermediate wave (B) is unfolding as a double zigzag. The second zigzag labelled minor wave Y is deepening the correction.
The normal depth for a B wave within a flat correction is between 1 to 1.38 times the A wave. This gives a range for the normal depth of intermediate wave (B) between 16.45 to 11.85.
At 16.17 minute wave c would reach equality in length with minute wave a.
TECHNICAL ANALYSIS
Click chart to enlarge.
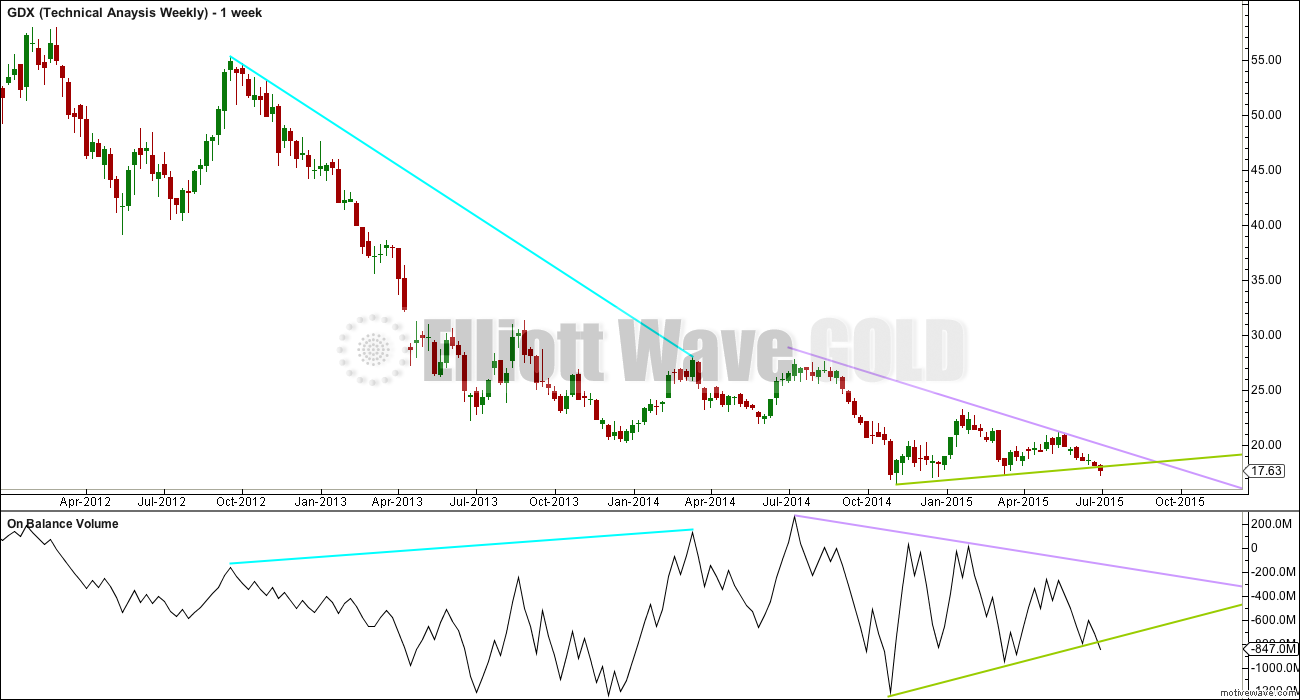
Blue Lines: from the high at 55.25 to the high at 28.03 price moved lower while On Balance Volume moved higher. This negative divergence may indicate a larger fall to come.
Lilac Lines: More recently, as price has made lower highs, OBV has also made lower highs. There is no divergence, so the fall in price is supported by a fall in volume.
Green Lines: Recently price has also made higher lows. Again OBV agrees. There is no divergence.
Price is now breaking below support of its green trend line, as is OBV. This is a further bearish indicator.
Click chart to enlarge.
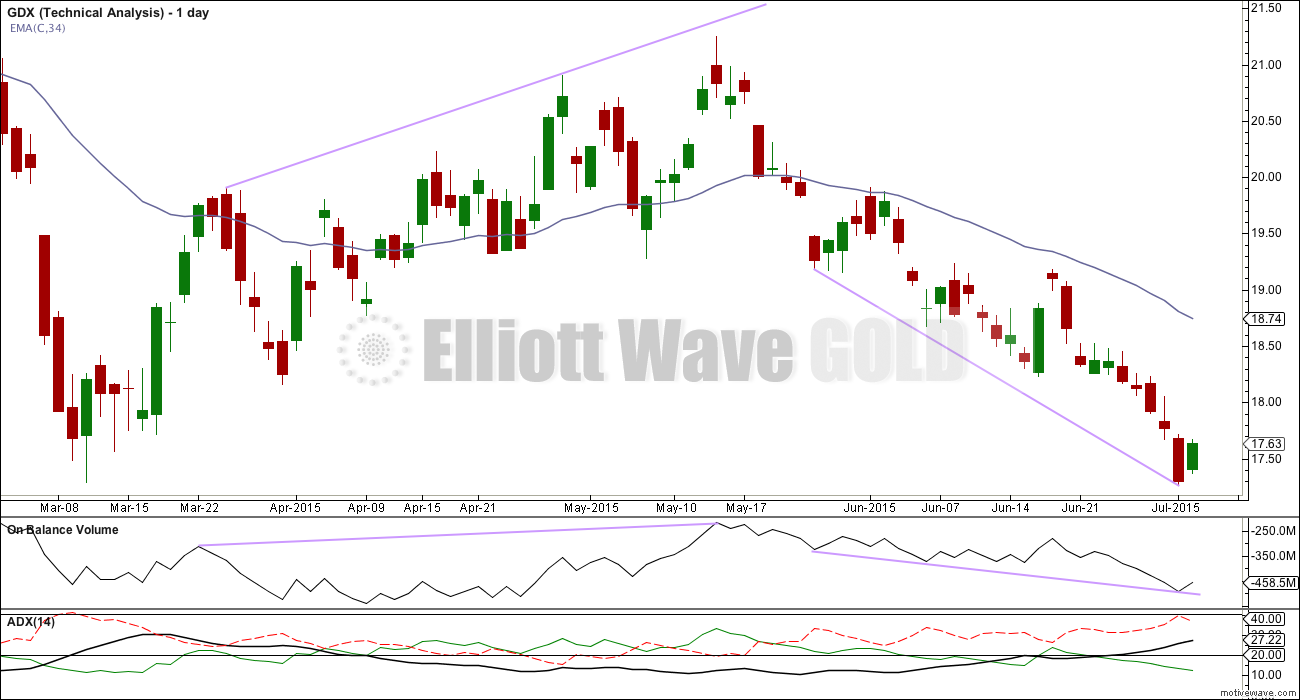
ADX now indicates a clear and strengthening downwards trend.
OBV agrees with the fall in price. Price remains below the 34 day EMA. All regular TA indicators point to a strong downwards trend at this time for GDX. The bear wave count is favoured.
Click chart to enlarge.
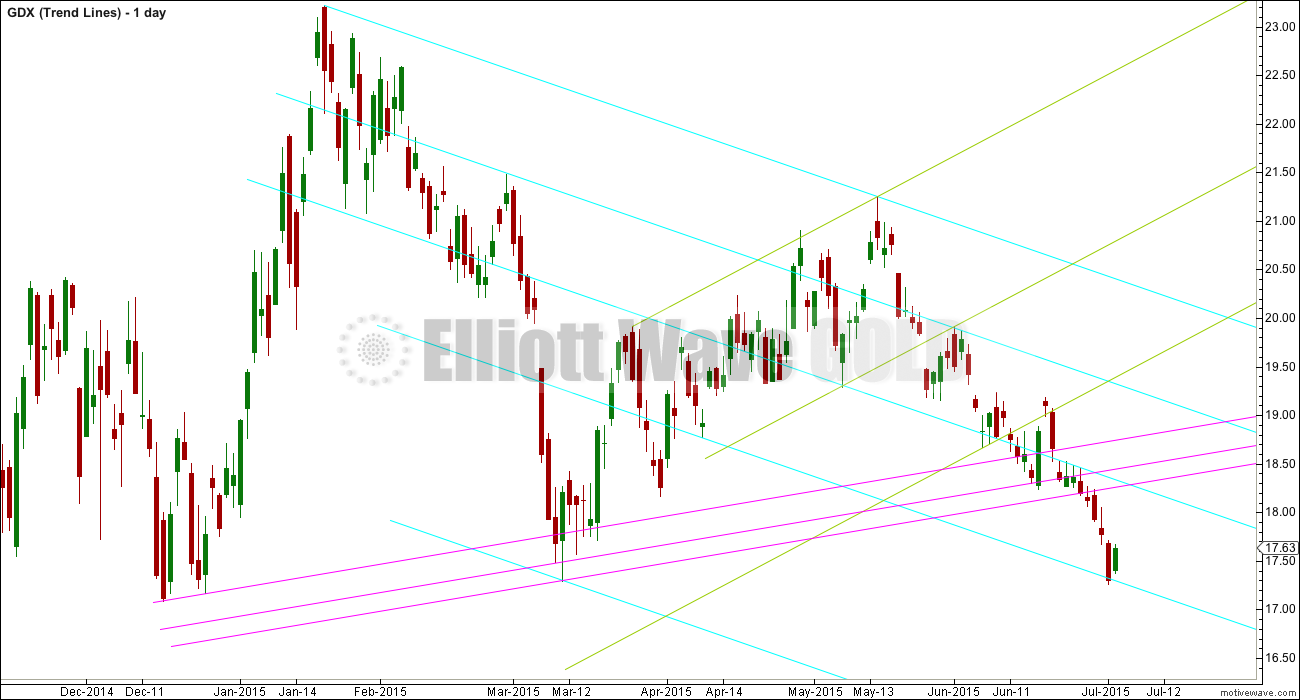
This is my own particular method of trend line analysis.
Each series of parallel lines is coded with a different colour. I use this approach to suggest potential areas of support and resistance.
Lara thanks for this GDX chart. I always appreciate the extra effort you give to your subscribers.
As always, You are the best and with a Professional touch from the Heart.
You’re welcome Richard.
Very helpful Lara. Thank you.
You’re welcome.
At this time GDX does seem a little more clearly bearish than Gold.