Both Elliott wave counts expected downwards movement, which is what has happened for Monday’s session.
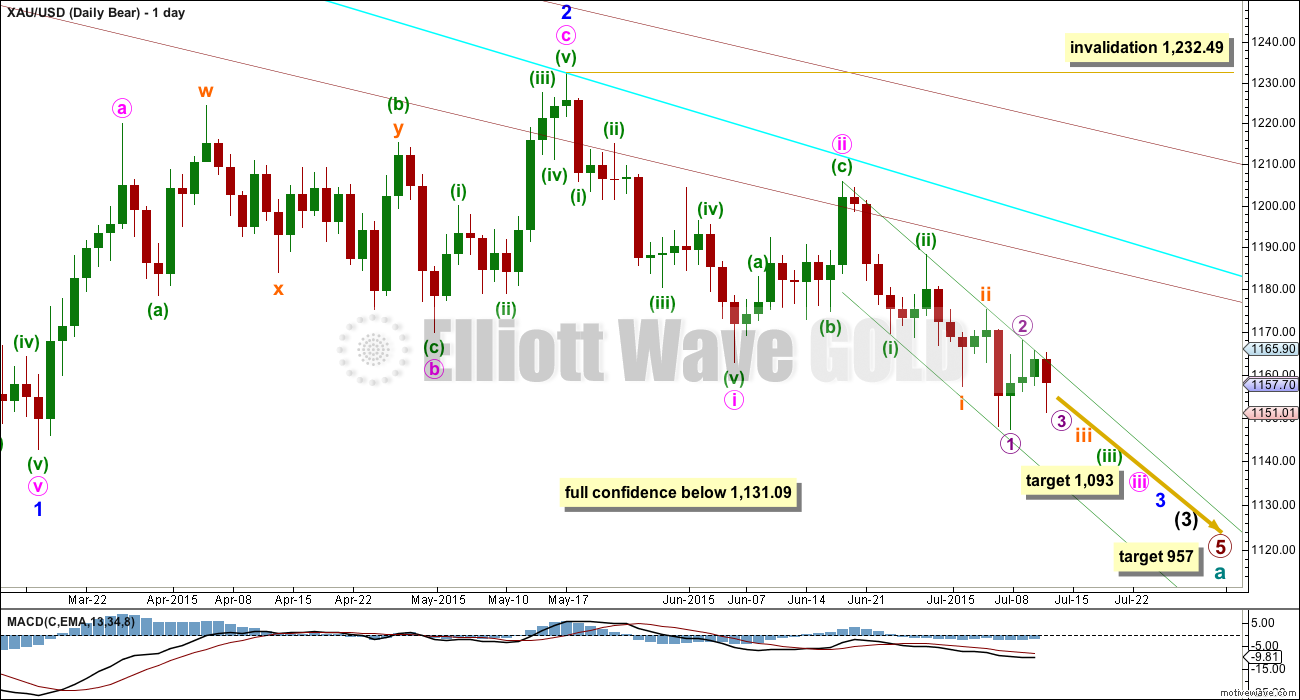
Summary: The main wave count remains the same: it expects downwards movement this week to a target at 1,123 which may be met in three days time.
To see weekly charts click here.
Changes to last analysis are bold.
MAIN ELLIOTT WAVE COUNT
The main wave count expects that cycle wave a is an incomplete impulse.
Within primary wave 5, the daily chart focuses on the middle of intermediate wave (3). Intermediate wave (3) has yet to show an increase in downwards momentum beyond that seen for intermediate wave (1).
This wave count has increased in probability with a new low below 1,162.80. Full confidence may be had in this wave count with a new low below 1,131.09.
Pros:
1. Intermediate wave (1) (to the left of this chart) subdivides perfectly as a five wave impulse with good Fibonacci ratios in price and time. There is perfect alternation and proportion between minor waves 2 and 4. For this piece of movement, the bear wave count has a much better fit than the bull wave count.
2. Intermediate wave (2) (to the left of this chart) is a very common expanded flat correction. This sees minor wave C an ending expanding diagonal which is more common than a leading expanding diagonal.
3. Minor wave B (to the left of this chart) within the expanded flat subdivides perfectly as a zigzag.
4. Volume at the weekly and daily chart continues to favour the bear wave count. Since price entered the sideways movement on 27th March, it is a downwards week which has strongest volume and the downwards day of 9th April which still has strongest volume.
5. On Balance Volume on the weekly chart breached a trend line from back to December 2013. This is another bearish indicator.
Cons:
1. Intermediate wave (2) (to the left of this chart) looks too big on the weekly chart.
2. Intermediate wave (2) (to the left of this chart) has breached the channel from the weekly chart which contains cycle wave a.
3. Within minor wave 1 down, there is gross disproportion between minute waves iv and ii: minute wave iv is more than 13 times the duration of minute wave i, giving this downwards wave a three wave look.
4. Minor wave 2 is much longer in duration than a minor degree correction within an intermediate impulse normally is for Gold. Normally a minor degree second wave within a third wave should last only about 20 days maximum. This one is 44 days long.
Minor waves 1 and 2 are complete. Minute waves i and ii are also complete. Gold may be ready to move to the strongest middle of intermediate wave (3).
Minute wave ii may not move beyond the start of minute wave i above 1,232.49.
Minute wave ii is now very likely to be over here. If it moves any higher, then it should find strong resistance at the blue trend line.
At 1,093 minute wave iii would reach 1.618 the length of minute wave i. If minute wave iii ends in a total Fibonacci twenty one days, then this target may be reached in another four days time.
Draw a base channel about minuette waves (i) and (ii) as shown (green trend lines). Look for upwards corrections along the way down to continue to find resistance at the upper edge of that channel. When the strongest part of downwards movement arrives, then it may have the power to break through support at the lower edge of the channel. For now this channel is perfectly showing where price is finding support and resistance. This channel is drawn in the same way on the daily and hourly charts, but the daily chart is on a semi-log scale and the hourly is arithmetic. Use the channel on the daily chart as a guide.
HOURLY ELLIOTT WAVE COUNT
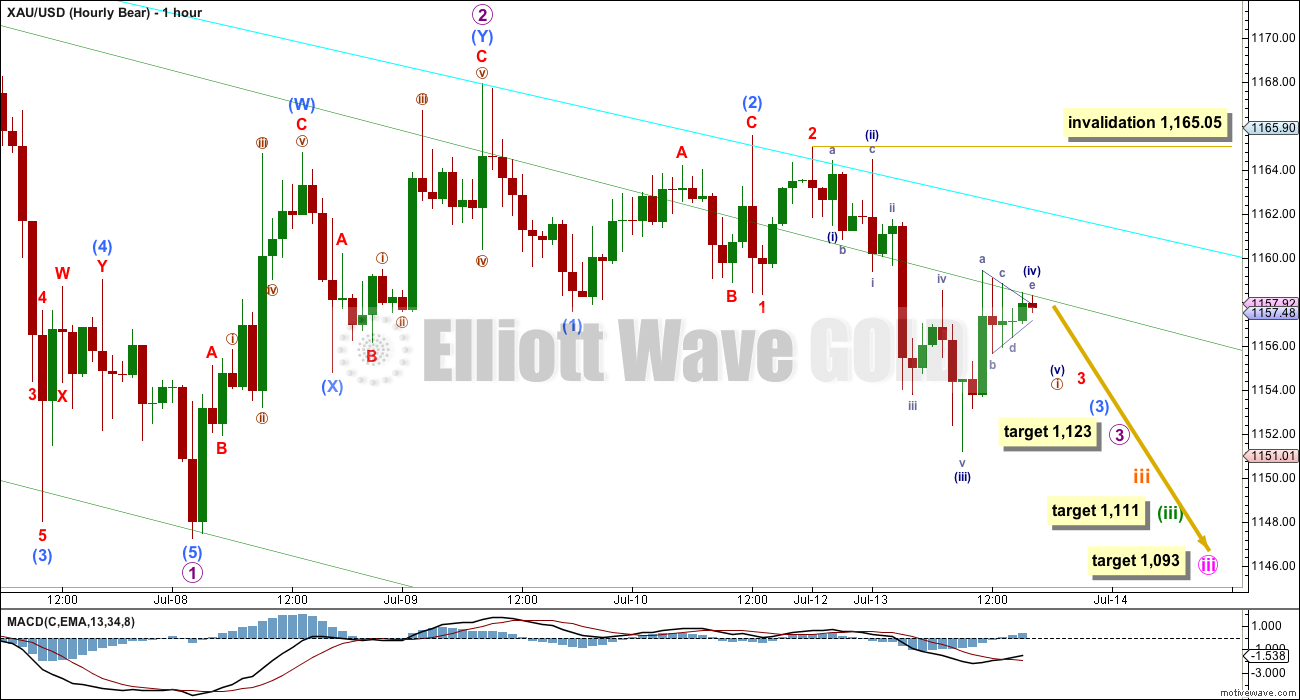
This hourly chart works in exactly the same way for the alternate wave count. The only difference for the alternate wave count is the degree of labelling would be one degree lower.
Downwards movement continues to look clearer as fives, with upwards movement still clearer as threes.
At 1,123 micro wave 3 would reach 1.618 the length of micro wave 1. If micro wave 3 lasts a total Fiboancci five days, then this target may be met now in another three days time.
The aqua blue trend line continues to show fairly well where upwards movement is finding resistance. I have drawn it across the last two swing highs on the hourly chart.
There is now a series of eight overlapping first and second waves (up to and including intermediate degree). Within the third wave of minute wave iii, there are a series of five overlapping first and second waves.
This scenario is very common. Third waves are the most commonly extended waves. When they extend, then it is normally the middle of the wave that is stretched out and extended which necessarily begins with a series of first and second waves (not always overlapping, but often they are).
I will be expecting the fifth wave within one or more of subminuette wave iii, minuette wave (iii) and minute wave iii to be a swift strong extension. We may not see a very strong increase in downwards momentum until a strong fifth wave arrives. Until then, we may see a reasonable increase in downwards momentum.
When nano i is over, then the following correction for nano wave ii may not move beyond the start of nano wave i above 1,165.05.
At 1,111 minuette wave (iii) would reach 2.618 the length of minuette wave (i).
ALTERNATE ELLIOTT WAVE COUNT
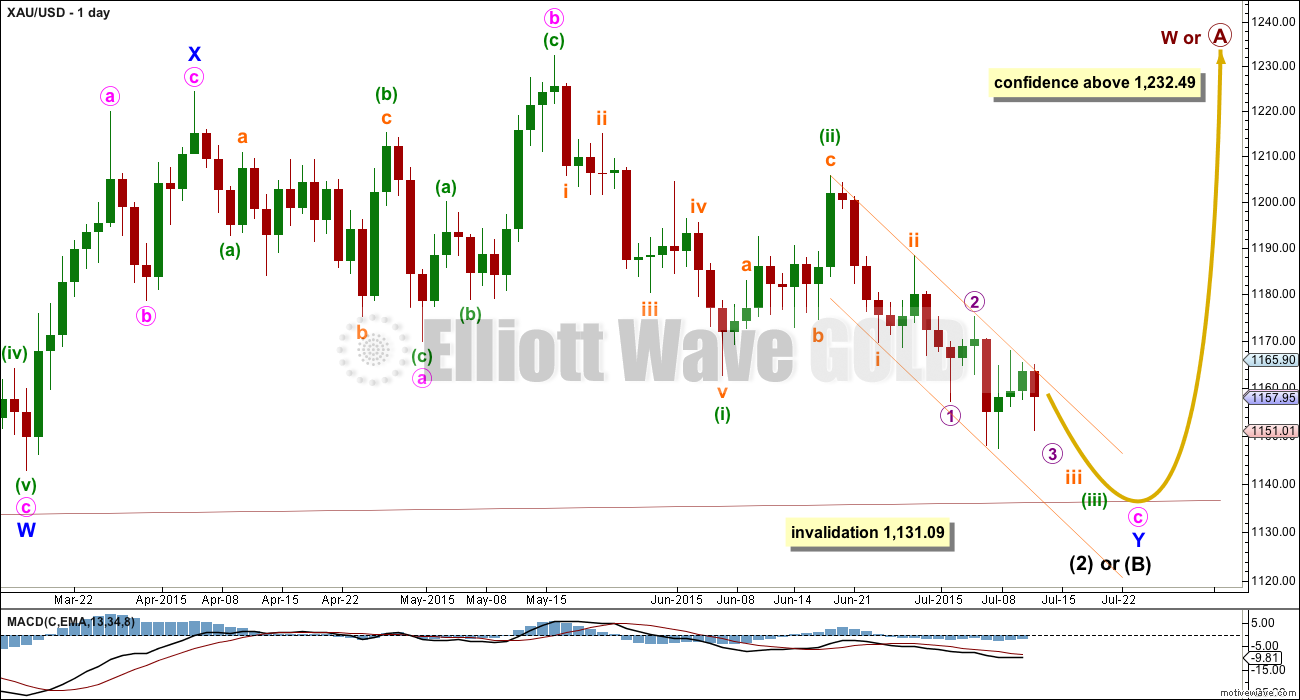
This bull wave count looks at the possibility that cycle wave a is a complete impulse and that cycle wave b began back at 1,131.09. Within cycle wave b, primary wave A is incomplete and subdividing either as a zigzag or an impulse.
Pros:
1. The size of the upwards move labelled here intermediate wave (A) (to the left of this chart) looks right for a new bull trend at the weekly chart level.
2. The downwards wave labelled minor wave W looks best as a three.
3. The small breach of the channel about cycle wave a on the weekly chart would be the first indication that cycle wave a is over and cycle wave b has begun.
Cons:
1. Within intermediate wave (3) of primary wave 5 (to the left of this chart), to see this as a five wave impulse requires either gross disproportion and lack of alternation between minor waves 2 and 4 or a very rare running flat which does not subdivide well. I have tried to see a solution for this movement, and no matter what variation I try it always has a problem which substantially reduces its probability.
2. Intermediate wave (5) of primary wave 5 (to the left of this chart) has a count of seven which means either minor wave 3 or 5 looks like a three on the daily chart.
3. Expanding leading diagonals (of which intermediate wave (A) or (1) is) are are not very common (the contracting variety is more common). There is also now a second expanding leading diagonal for minute wave i.
4. Volume does not support this bull wave count.
5. Intermediate wave (B) or (2) may only be continuing as a double combination. Minor wave X is shallow, and X waves within double combinations are normally very deep. This one looks wrong.
Volume for 8th July shows a strong increase for an up day at 218.9K. It is stronger than all the prior down days since Gold entered the sideways consolidation back on 27th March except for one, that of 9th April at 230.3K. *I noticed that last Thursday the volume data changed for 9th April and 2nd July. Prior to that date, 9th April had a volume spike of 230.3K, but now it is lower at 115.2K, and last Thursday volume data for 2nd July also changed from below the prior day to a spike now at 285.8K. With changing volume data, this makes volume analysis… rather difficult.
Intermediate wave (A) (to the left of this chart) subdivides only as a five. I cannot see a solution where this movement subdivides as a three and meets all Elliott wave rules (with the sole exception of a very rare triple zigzag which does not look right). This means that intermediate wave (B) may not move beyond the start of intermediate wave (A) below 1,131.09. That is why 1,131.09 is final confirmation for the bear wave count at the daily and weekly chart level.
The only option now for the bull wave count is to see intermediate wave (B) or (2) continuing sideways as a double combination. The first structure in the double is a zigzag labelled minor wave W. The double is joined by a brief three in the opposite direction labelled minor wave X, a zigzag. The second structure in the combination is an expanded flat labelled minor wave Y which is incomplete.
Within minor wave Y, minute wave b is a 1.15 times the length of minute wave a indicating an expanded flat. Both minute waves a and b are three wave structures.
Minute wave c downwards must subdivide as a five, and because the first wave within it is an impulse and not a zigzag minute wave c may only be unfolding as an impulse.
Within minute wave c downwards, the third wave is incomplete for minuette wave (iii). At the hourly chart level, this bull wave count sees the subdivisions in exactly the same way as the bear (the bull sees everything one degree lower) so the hourly charts are the same. For this reason I will publish only hourly charts for the bear because they work in exactly the same way for the bull.
There does not look to be enough room for minute wave c to complete as a five wave impulse and remain above the invalidation point at 1,131.09. This is now the biggest problem with the bull wave count.
TECHNICAL ANALYSIS
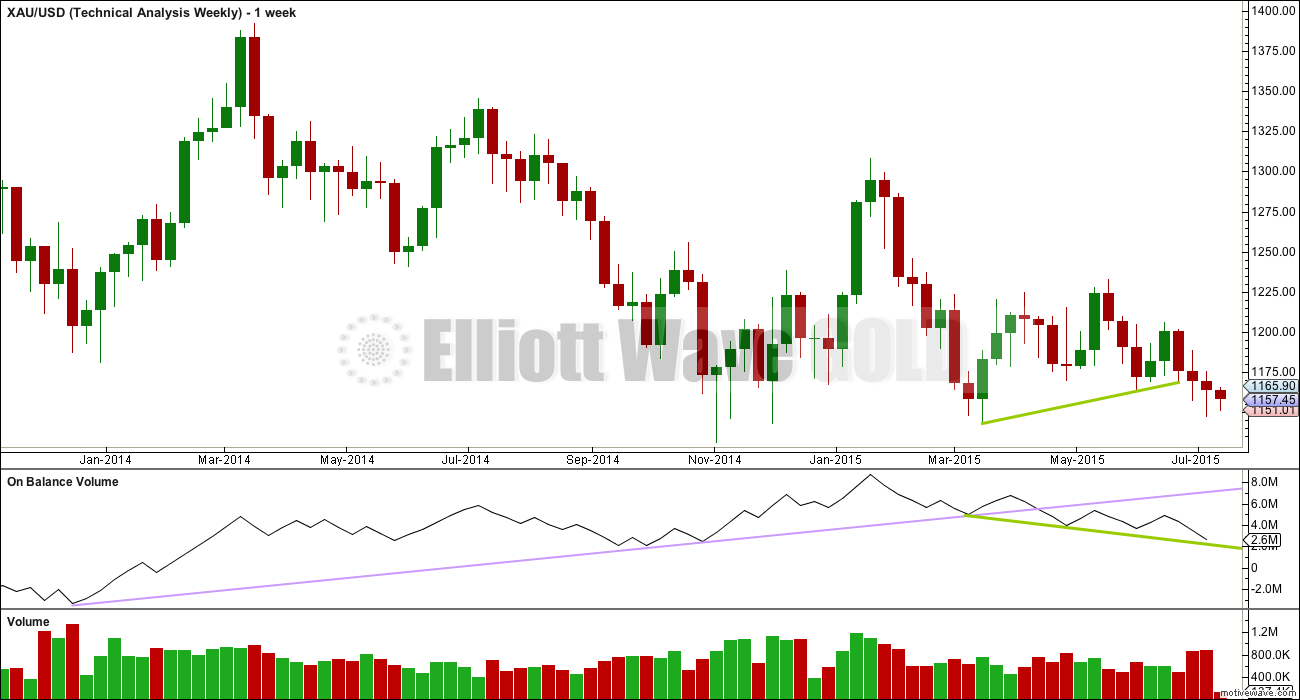
Weekly Chart: Overall volume still favours a downwards breakout which may now be underway. During this sideways movement, it is still one down day and a down week which have higher volume. On Balance Volume breaches a trend line (lilac line) which began in December 2013, and the breach is significant.
While price has made higher lows, On Balance Volume has made lower lows (green trend lines). This small rise in price is not supported by volume, and it is suspicious. Price is now breaking below support at the green trend line, which is another bearish indicator.
At the weekly chart level, volume is strongest in a down week. Overall volume up until two weeks ago volume was declining, typical of a maturing consolidation. Each series of down weeks includes a week with stronger volume than the following series of up weeks. The last two weeks has seen downwards volume increase as price breaks below the green trend line. A breakout should come with increasing volume, which looks like what is happening. This week has slightly higher volume than last week, and the fall in price is supported by volume.
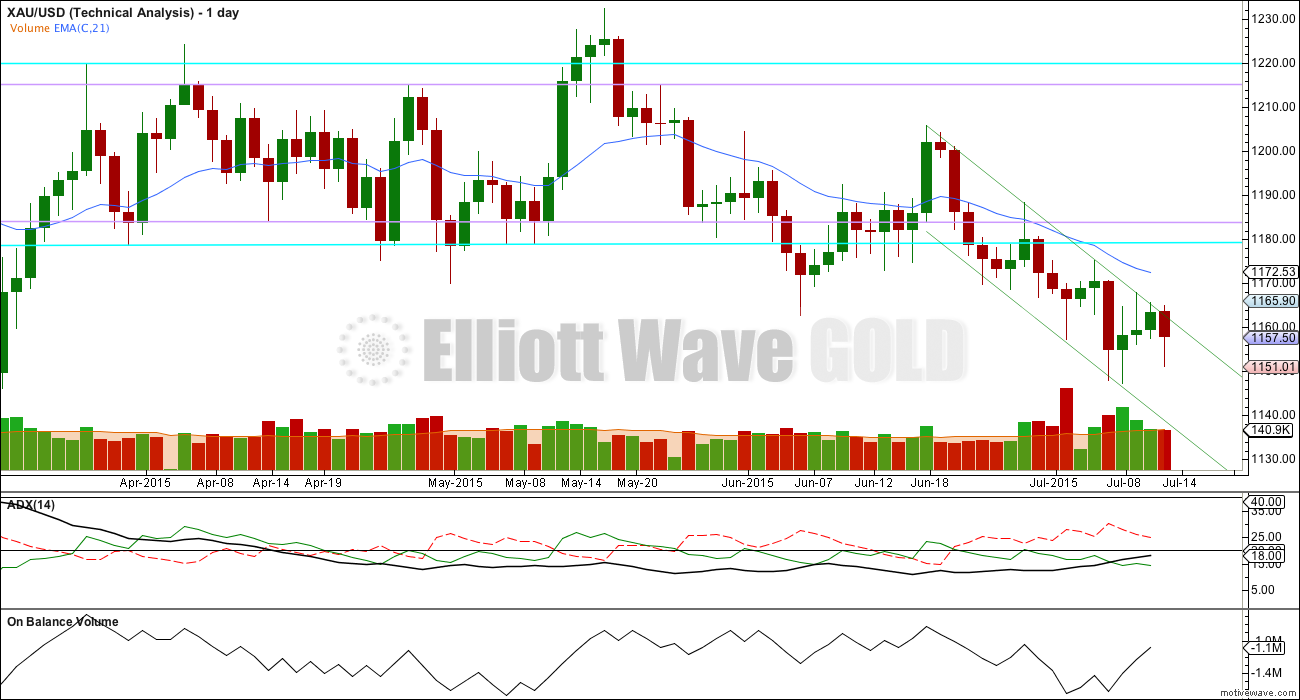
Daily Chart: ADX continues to rise and is above 15 indicating the early stages of a new trend. The -DX line is still above the +DX line indicating the trend is down.
Volume declined while price rose last week. If the trend is down, as ADX suggests, then upwards movement should be seen on declining volume. Volume is in agreement with ADX and the Elliott wave counts.
Upwards corrections continue to find resistance about the green parallel channel. The 21 day EMA is pointing down and price remains below it. All indicators are that the trend is down. A trend following trading system would be advised. The system outlined here is very simple (simple is best); the parallel channel should show where price finds resistance and support while price is expected to overall move lower.
There is a slight cause for concern today: Monday completes on slightly lower volume than the prior upwards day. The long lower wick of Monday’s red candlestick is slightly bullish. If price breaks above the upper edge of the channel, then I would be concerned that the main wave count may be wrong. While that trend line continues to provide resistance, then I will have confidence in the main wave count.
This analysis is published about 05:43 p.m. EST.

For those who follow this kind of stuff, Yellen’s testimony starts Weds at 10 am EST. Aside from the usual morning financial reports, I would expect her words to trigger the biggest movement of the week.
If she confirms what she said on Friday that will continue to put pressure on gold. If she takes it a step further, and gets more specific, gold could fall hard.
Should the Greeks pass the EU proposal tomorrow as well, which is expected, it could be a double whammy for gold.
Guess I should add that if there are any surprises to any of this, the opposite will be true.
Either way, buckle your seatbelt because the next 24 hours will be a lot crazier than today.
Greek situation is fascinating. Greek PM ran AGAINST austerity to win election. Greek PM recently called a referendum where Greeks voted AGAINST austerity. And now Greek parliament who must face their citizens are expected to vote FOR austerity ? No wonder gold direction is questionable.
The wave count will change slightly; this upwards sideways movement may be pico wave ii. Pico wave i may have been over at yesterday’s low .
Again with price finding resistance at the upper trend lines that channel is reinforced. It’s been tested now eight times so it’s highly technically significant. The wave count needs it to hold. If it is breached then my wave count is wrong. While it holds and volume continues to be overall bearish we should continue to expect the trend is down.
I’ve found in the past that RSI is a fairly reliable indicator of lows. It’s not oversold at this time on the daily chart so I do not expect we have a bottom. I’ll add it to daily and weekly TA charts.
I’m still expecting more downwards movement. Targets are the same, the channel is the same.
Lara, is there a way to calculate bull targets that stay within the 1131.09 price?
Also, just for our studying eyeballs could be willing to post the hourly bull chart to show us the opposite count of the predicted down move?
The hourly bull chart looks exactly the same as the hourly bear chart.
The only difference is the degree of labelling is one lower.
There is no advantage in publishing two charts which look almost identical.
Ok thanks.
I knew the daily was labeled the same, wasn’t sure about hourly.
I’ll add some targets for the bull wave count.
They will all have to be above 1,131.09.
Thanks Lara. I have some sketched out, but i’d love to see yours.
Curious what EW count comes after Pico….margarita maybe?
🙂
Oil moved up which lifts Gold.
Stocks Rally as Crude Oil Closes Above $53
ByKeris Alison LahiffFollow | 07/14/15 – 03:19 PM EDT
NEW YORK (TheStreet) — Stocks extended modest gains by the final hour of trading Tuesday as crude oil settled at its highest level since the beginning of July.
Weak US data this week also helps gold.
A View: With 1152-51 holding, Gold price appears to be consolidating in the 1153-54-56 price range from where to put in a counter trend move…. Upside is seen as restrictive 1159-60 with 1162-66 on the outside…. There is really not much below 1151 to hold Gold price other than the lower band at 1144-43….. Just got to wait and see which way this swings lol
Lara,
Which wave ended at 1159.91 at 9:20 am today?
Is Nano i complete or will it end today maybe around 1,151?
When nano i is over, how long and approximate target for the Nano ii bounce,
with invalidation at 1165.05.
Is Gold volume today ok for the bearish outlook?
This sideways move looks like another correction. It is a really clear three so far, and it’s again finding resistance at the green trend line on the daily chart. So that continues to look quite bearish.
Volume again is a concern, yes. It’s lower. This sideways move over the last five days looks like a small consolidation. The breakout should still be down because volume is still overall bearish.
ADX is still rising and close to 20 now, the trend should be down.
It looks like it’s winding up for something big, the breakout may be explosive.
RSI on the daily chart hasn’t reached oversold, so that’s not indicating a bottom is in as yet.
I’m going to take some time to go over the subdivisions of pico wave i; I’m wondering if it may have been over at yesterday’s low and this is pico wave ii. That would have a reasonable look overall on the hourly chart.
As you have correctly stated in past reports, volume tends to go down as a market consolidates. So this should not be a concern. Rather, it is proof of a consolidation.
RSI is far from oversold (<30). Gold has plenty of room to drop.
Exactly. It’s a sideways consolidation, it’s a second wave correction and that’s what it should look like.
As long as that upper trend line holds the wave count agrees with TA indicators.
ADX is stronger, there is a trend. It should be down.
Any wave count?
This afternoon is gold heading down or up?
Which wave ended at today’s high 1159.91 at 9:20 am?
Something is strange, why are miners strong today?
Thankfully I already sold DUST at profit and looking to buy it again cheaper.
Gold dropped and DUST when up and DUST is way down now.
Is Nano i next to end down maybe around 1151?
“when nano i is over, then the following correction for nano wave ii may not move beyond the start of nano wave i above 1,165.05.”
Something is not right. Miners have led gold the entire way.
Lots of support for GDX at this price range.
Since gold stopped dropping and went sideways at 10:50 the miners moved up.
https://www.dropbox.com/s/xunmf92ihvxw76x/GDX%20SUPPORT.png?dl=0
I think GDX is in Minuette wave iv according to Lara’s GDX analysis.
That was either the end of ‘C’ of 4 or 2
If not, then it might be the begining of something more bullish!
That was (is) a C wave and it is not necessarily over yet. Could still move back to the aqua trend line.
Richard
My Pmbull chart is black. Are you able to access PMbull chart?
Thanks.
pmbull is working fine for me this morning…large green bar at the moment. I use the non-flash version because I like to see volume. It also does not time out.
Thanks.
Still not working. on my computer. I guess i need to restart computer and try again.
pmbull is working fine on my pc and tablets.
I use flash version.
Iran deal is done oil should drop and push gold down. Many other factors are in play for a down week in gold. Gold is already weak now down at 1153.39 at 3:11 am.
However I think this may happen Tuesday with a possible green daily candlestick? “when nano i is over, then the following correction for nano wave ii may not move beyond the start of nano wave i above 1,165.05.”
The last paragraph of the above analysis makes for an interesting read (what is it Tuesday reverses Monday?)…. With 1152-51 holding, possible short term rally / upturn is expecting for a test / break above pivot / 5dma (1157-59) seeking 1163-64; stochastic fast K over D indicating a buy signal… Gold price remains bearish though, downside risks 1145-42….
Gold price: Hedge funds slash bullish bets 64%
Frik Els | July 13, 2015
The Gold net long positioning is now the lowest since at least 2006 when gold was worth less than $600 an ounce.
http://www.mining.com/gold-price-hedge-funds-slash-bullish-bets-64/
I did sell DUST close to its high today and bought it back close to it’s low.
Some investors are thinking the miners are Near term oversold!
Perfect hit of the lower rail… see chart below.
https://www.dropbox.com/s/3pogirr1v54m5ep/GDX%20TREND%20CHANNEL.png?dl=0
Yes, they are definitely oversold. The key is gold and the EW count. If gold follows Lara’s game plan, the miners should break through the bottom trend line. Stocks can always stay oversold for long periods when trending. GDX has been oversold on the daily timeframe for most of June and July so far.
Dreamer
You are correct, thanks. After reading the comment I posted and looking at the chart. I considered that Lara’s bottom charts in Technical analysis part of her report has been oversold for quite awhile.
Interesting how fear sets in until reassess what happens in market breakdown extremes.
Hi Lara, you used some wave degrees lower than those shown on your “Wave Notation” today, i.e. “nano”. Would be great if you could add those when you get time. Thanks, Bob
True. And yes, will add it to the list of Good Things To Do.