
A small red candlestick fits the Elliott wave count.
Summary: The main wave count remains the same: it expects downwards movement this week to a target at 1,123 which may be met in two or five days time.
To see weekly charts click here.
Changes to last analysis are bold.
MAIN ELLIOTT WAVE COUNT
Click chart to enlarge.
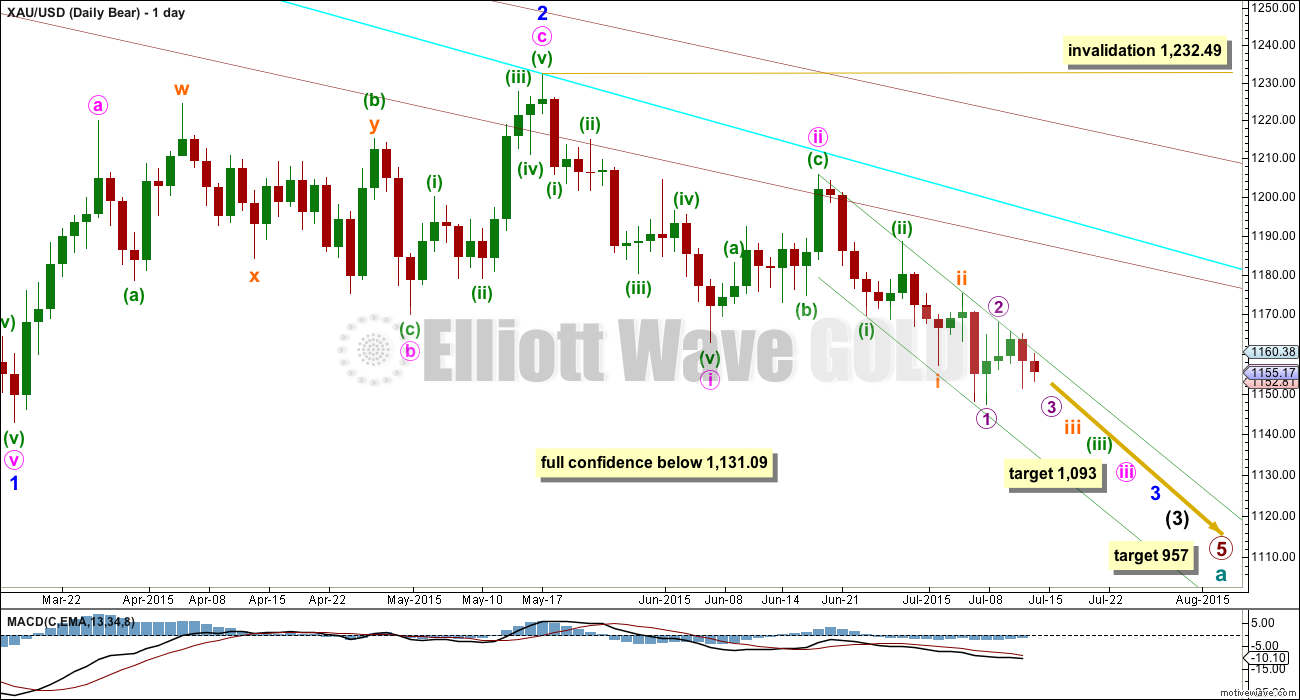
The main wave count expects that cycle wave a is an incomplete impulse.
Within primary wave 5, the daily chart focuses on the middle of intermediate wave (3). Intermediate wave (3) has yet to show an increase in downwards momentum beyond that seen for intermediate wave (1).
This wave count has increased in probability with a new low below 1,162.80. Full confidence may be had in this wave count with a new low below 1,131.09.
Pros:
1. Intermediate wave (1) (to the left of this chart) subdivides perfectly as a five wave impulse with good Fibonacci ratios in price and time. There is perfect alternation and proportion between minor waves 2 and 4. For this piece of movement, the bear wave count has a much better fit than the bull wave count.
2. Intermediate wave (2) (to the left of this chart) is a very common expanded flat correction. This sees minor wave C an ending expanding diagonal which is more common than a leading expanding diagonal.
3. Minor wave B (to the left of this chart) within the expanded flat subdivides perfectly as a zigzag.
4. Volume at the weekly and daily chart continues to favour the bear wave count. Since price entered the sideways movement on 27th March, it is a downwards week which has strongest volume and the downwards day of 2nd July which has strongest volume.
5. On Balance Volume on the weekly chart breached a trend line from back to December 2013. This is another bearish indicator.
Cons:
1. Intermediate wave (2) (to the left of this chart) looks too big on the weekly chart.
2. Intermediate wave (2) (to the left of this chart) has breached the channel from the weekly chart which contains cycle wave a.
3. Within minor wave 1 down, there is gross disproportion between minute waves iv and ii: minute wave iv is more than 13 times the duration of minute wave i, giving this downwards wave a three wave look.
4. Minor wave 2 is much longer in duration than a minor degree correction within an intermediate impulse normally is for Gold. Normally a minor degree second wave within a third wave should last only about 20 days maximum. This one is 44 days long.
Minor waves 1 and 2 are complete. Minute waves i and ii are also complete. Gold may be ready to move to the strongest middle of intermediate wave (3).
Minute wave ii may not move beyond the start of minute wave i above 1,232.49.
Minute wave ii is now very likely to be over here. If it moves any higher, then it should find strong resistance at the blue trend line.
At 1,093 minute wave iii would reach 1.618 the length of minute wave i. If minute wave iii ends in a total Fibonacci twenty one days, then this target may be reached in another three days time. At this stage, minute wave iii may not be able to complete in just three days and the next Fibonacci number in the sequence is 34 which would see it continue for another sixteen days.
Draw a base channel about minuette waves (i) and (ii) as shown (green trend lines). Look for upwards corrections along the way down to continue to find resistance at the upper edge of that channel. When the strongest part of downwards movement arrives, then it may have the power to break through support at the lower edge of the channel. For now this channel is perfectly showing where price is finding support and resistance. This channel is drawn in the same way on the daily and hourly charts, but the daily chart is on a semi-log scale and the hourly is arithmetic. Use the channel on the daily chart as a guide.
HOURLY ELLIOTT WAVE COUNT
Click chart to enlarge.
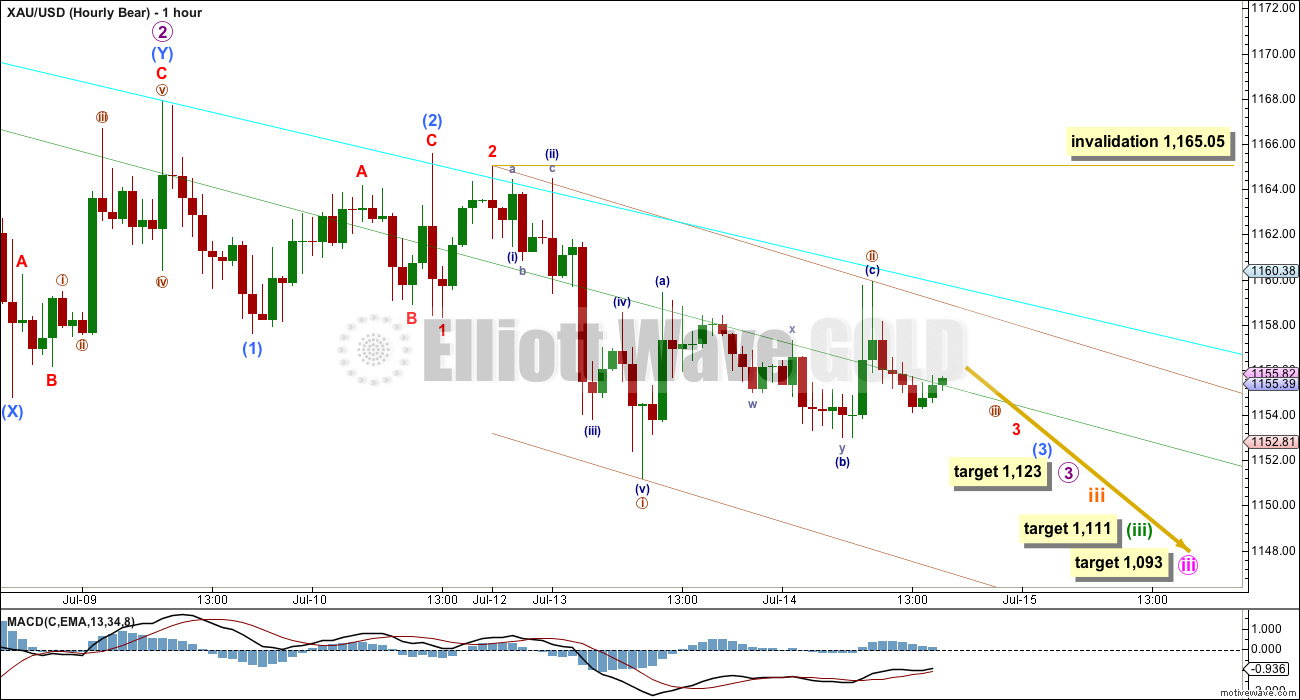
This hourly chart works in exactly the same way for the alternate wave count. The only difference for the alternate wave count is the degree of labelling would be one degree lower.
On the five and one minute charts, it is possible to see nano wave i over at yesterday’s low. On the hourly chart, what is clear is that sideways movement for Tuesday looks like a three wave structure, downwards waves look like fives, and upwards waves look like threes.
Nano wave ii should be over as a relatively deep 0.63 zigzag, and now it is finding resistance at the aqua blue trend line on the hourly chart and at the green trend line on the daily chart. If it continues further as a double zigzag or double combination, then it may not move beyond the start of nano wave i above 1,165.05.
Micro wave 3 would reach 1.618 the length of micro wave 1 at 1,123. If micro wave 3 exhibits a Fibonacci duration, then it may last a total five or eight days (so far it has lasted three days) and the target may be reached in another two or five days time.
With these second wave corrections being so time consuming, I would expect the upcoming fourth wave corrections to be quick. This is a common pattern for Gold which makes Gold’s impulses look curved: with a slow start, a strong third wave and an even stronger fifth wave will spike following quick shallow fourth waves. There is a good example on this hourly chart: pico wave (iii) (dark blue) looks like a three, but on the five and one minute charts it subdivides as a five with quick shallow fourth wave corrections.
The brown channel is a base channel about nano waves i and ii. Upwards corrections along the way down should now find resistance at the upper edge of this channel, and the next wave down may initially find support at the lower edge but thereafter should have the power to break through.
At 1,111 minuette wave (iii) would reach 2.618 the length of minuette wave (i).
ALTERNATE ELLIOTT WAVE COUNT
Click chart to enlarge.
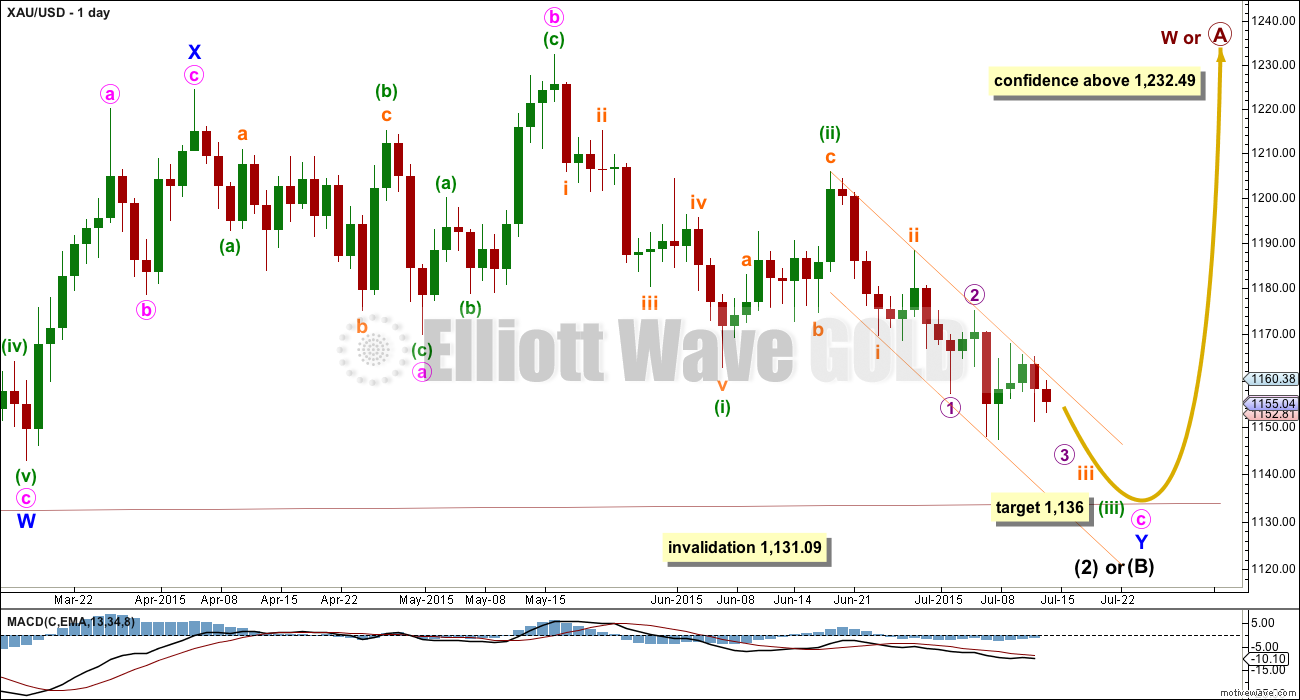
This bull wave count looks at the possibility that cycle wave a is a complete impulse and that cycle wave b began back at 1,131.09. Within cycle wave b, primary wave A is incomplete and subdividing either as a zigzag or an impulse.
Pros:
1. The size of the upwards move labelled here intermediate wave (A) (to the left of this chart) looks right for a new bull trend at the weekly chart level.
2. The downwards wave labelled minor wave W looks best as a three.
3. The small breach of the channel about cycle wave a on the weekly chart would be the first indication that cycle wave a is over and cycle wave b has begun.
Cons:
1. Within intermediate wave (3) of primary wave 5 (to the left of this chart), to see this as a five wave impulse requires either gross disproportion and lack of alternation between minor waves 2 and 4 or a very rare running flat which does not subdivide well. I have tried to see a solution for this movement, and no matter what variation I try it always has a problem which substantially reduces its probability.
2. Intermediate wave (5) of primary wave 5 (to the left of this chart) has a count of seven which means either minor wave 3 or 5 looks like a three on the daily chart.
3. Expanding leading diagonals (of which intermediate wave (A) or (1) is) are are not very common (the contracting variety is more common). There is also now a second expanding leading diagonal for minute wave i.
4. Volume does not support this bull wave count.
5. Intermediate wave (B) or (2) may only be continuing as a double combination. Minor wave X is shallow, and X waves within double combinations are normally very deep. This one looks wrong.
Volume for 8th July shows a strong increase for an up day at 218.9K. It is stronger than all the prior down days since Gold entered the sideways consolidation back on 27th March except for one, that of 2nd July at 285.8K. *I noticed that last Thursday the volume data changed for 9th April and 2nd July. Prior to that date, 9th April had a volume spike of 230.3K, but now it is lower at 115.2K, and last Thursday volume data for 2nd July also changed from below the prior day to a spike now at 285.8K. With changing volume data, this makes volume analysis… rather difficult.
Intermediate wave (A) (to the left of this chart) subdivides only as a five. I cannot see a solution where this movement subdivides as a three and meets all Elliott wave rules (with the sole exception of a very rare triple zigzag which does not look right). This means that intermediate wave (B) may not move beyond the start of intermediate wave (A) below 1,131.09. That is why 1,131.09 is final confirmation for the bear wave count at the daily and weekly chart level.
The only option now for the bull wave count is to see intermediate wave (B) or (2) continuing sideways as a double combination. The first structure in the double is a zigzag labelled minor wave W. The double is joined by a brief three in the opposite direction labelled minor wave X, a zigzag. The second structure in the combination is an expanded flat labelled minor wave Y which is incomplete.
Within minor wave Y, minute wave b is a 1.15 times the length of minute wave a indicating an expanded flat. Both minute waves a and b are three wave structures.
Minute wave c downwards must subdivide as a five, and because the first wave within it is an impulse and not a zigzag minute wave c may only be unfolding as an impulse.
Within minute wave c downwards, the third wave is incomplete for minuette wave (iii). At the hourly chart level, this bull wave count sees the subdivisions in exactly the same way as the bear (the bull sees everything one degree lower) so the hourly charts are the same. For this reason I will publish only hourly charts for the bear because they work in exactly the same way for the bull.
There does not look to be enough room for minute wave c to complete as a five wave impulse and remain above the invalidation point at 1,131.09. This is now the biggest problem with the bull wave count.
At 1,136 minuette wave (iii) would reach equality in length with minuette wave (i).
TECHNICAL ANALYSIS
Click chart to enlarge.
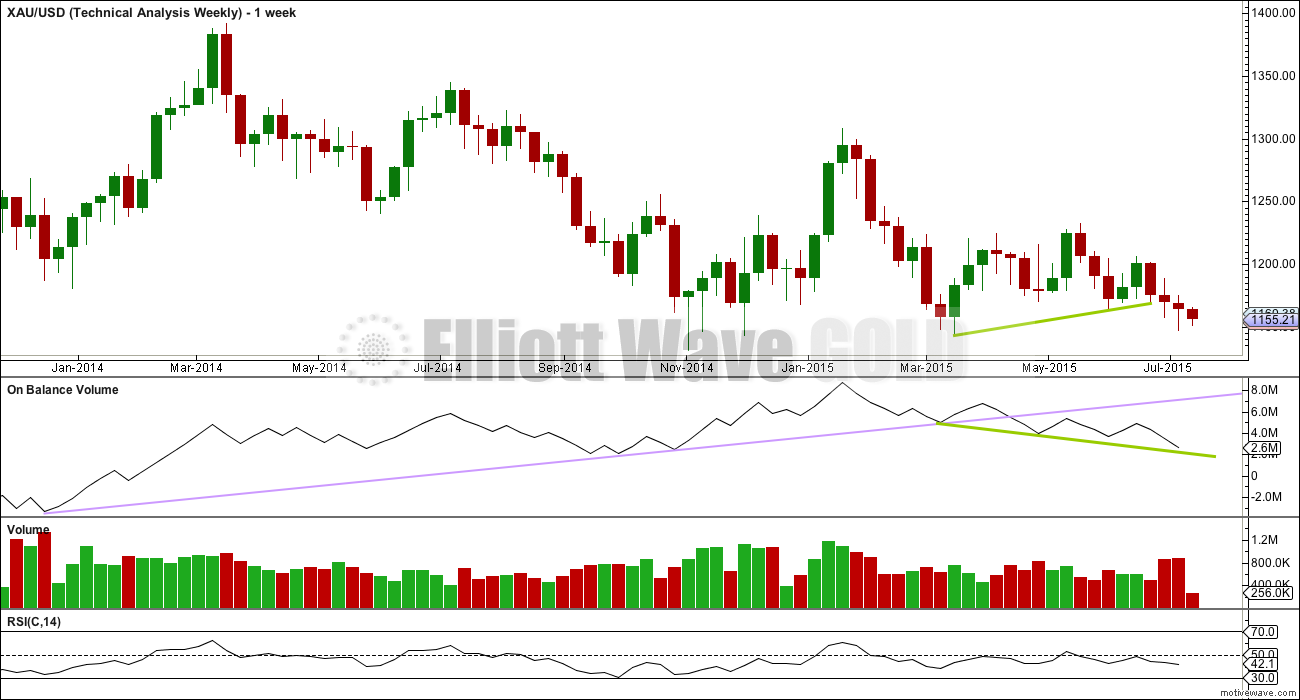
Weekly Chart: Overall volume still favours a downwards breakout which may now be underway. During this sideways movement, it is still one down day and a down week which have higher volume. On Balance Volume breaches a trend line (lilac line) which began in December 2013, and the breach is significant.
While price has made higher lows, On Balance Volume has made lower lows (green trend lines). This small rise in price is not supported by volume, and it is suspicious. Price is now breaking below support at the green trend line, which is another bearish indicator.
At the weekly chart level, volume is strongest in a down week. Overall volume up until two weeks ago volume was declining, typical of a maturing consolidation. Each series of down weeks includes a week with stronger volume than the following series of up weeks. A breakout should come with increasing volume, which looks like what is happening. Last week has slightly higher volume than the week immediately prior; the fall in price is supported by volume.
I am adding RSI to TA charts because it is usually a fairly reliable indicator of lows. At the weekly chart level, RSI is well above 30 indicating there is room yet for Gold to move lower.
Click chart to enlarge.
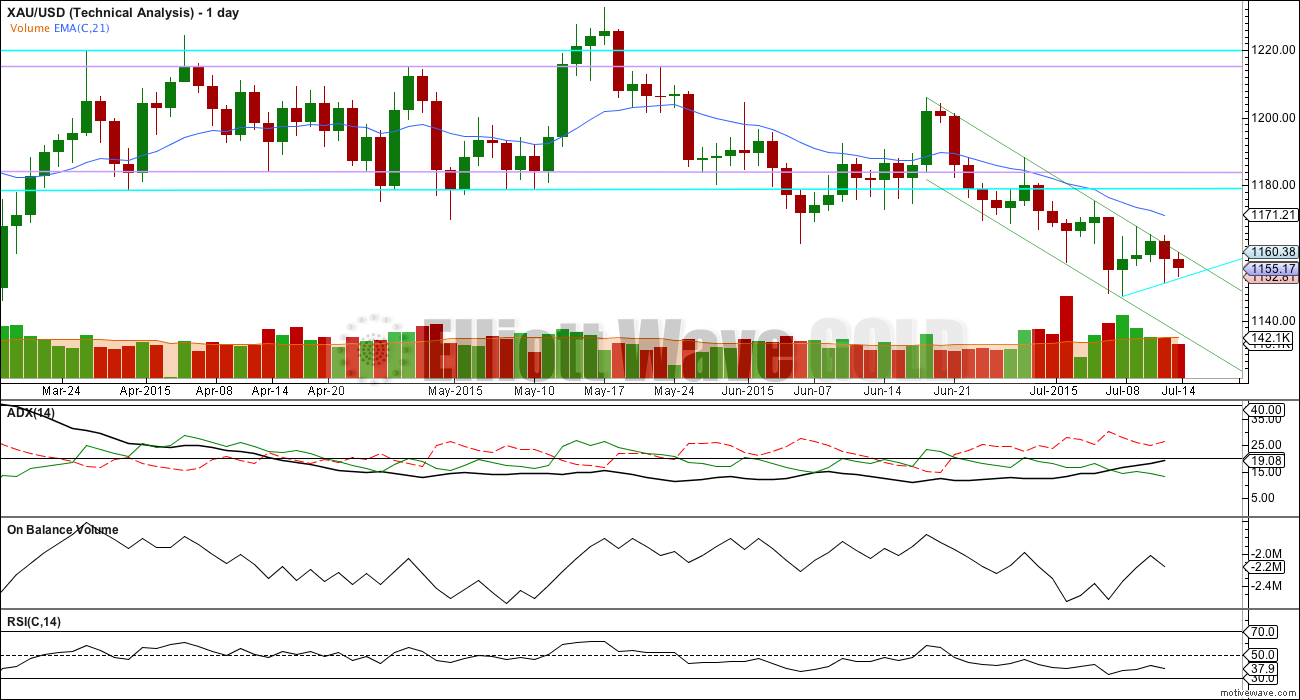
Daily Chart: ADX is strengthening, now close to 20 and rising. The -DX (red dashed) line is well above the +DX (green solid) line, indicating the trend is down. ADX is clear: there is a trend and it is down.
The last five days have seen declining volume indicating this sideways movement is a correction. With the sideways three wave movements on the hourly chart taking up so much time, price has been in a correction for much of the last five days. This decline in volume indicates a consolidation, and the breakout is more likely to be down than up with the prior volume spike of 2nd July being for a down day.
Downwards movement is finding support at the sloping aqua blue trend line. If price breaks below that trend line, then it may be ready to fall. The aqua blue line and the upper edge of the green channel have an apex which is very close by now. It looks like price should break out of these trend lines within the next one or two days; these two trend lines should tell us the next direction for Gold. If price breaks above the green trend line the wave count is wrong; if it breaks below the aqua blue trend line the wave count is right.
At the daily chart level RSI is above 30. RSI indicates Gold can still fall lower.
This analysis is published about 05:40 p.m. EST.
Anyone adding or initiating a short right here? Seems like an ideal spot per ewave, but other things are concerning.
Violent clashes erupt with Greek Parliament set to vote on bailout
July 15, 2015 3:00 p.m. ET
Greek Parliament prepared to vote late Wednesday on a bailout agreement.
http://www.marketwatch.com/story/violent-clashes-erupt-as-greece-parliament-set-to-vote-on-bailout-2015-07-15
Maybe the panic and increase in momentum will hit as we break through support at 1131.09.
Lara can we get a GDX update tonight please?
GDX low today is 16.28 just 11 cents from your 16.17 target for a bounce.
Okay.
Thanks a lot Lara for your help.
I do not think nano wave iii (brown circle) is complete. I’ve just had a look on the five and one minute charts and although there are some quick fourth waves in there towards the end of this sharp drop, I can’t see enough for this wave to be quite complete.
I think this current upwards wave is pico wave (iv) (navy blue) which may not move into pico wave (i) price territory above 1,154.10.
It’s possible pico wave (iv) could continue sideways in a narrow range for several hours, and then pico wave (v) down could be very swift and strong.
Or…. my one minute chart analysis this morning is wrong and nano nano wave iii (brown circle) is over. That idea also expects sideways movement for a while, the invalidation point for that is the low of nano wave i above 1,151.20.
Or… I have to move everything from the end of micro wave 2 all down one degree and this is another first wave incomplete. But I’m running out of wave degrees! (just kidding)
I’m not convinced the middle of the third wave has passed. Price is finding support at the brown trend channel on the hourly chart. I expect it will break through that support to next find support at the wider green channel, and then break through that too.
It may not break through until the first reasonable sized (micro?) fifth wave arrives. I’m still expecting that to be the strongest. So the strongest momentum is still ahead. It is barely increasing at the daily chart level, it needs to get a lot stronger than this for this wave count.
Keep using the brown channel on the hourly chart particularly now for resistance. Look for the lower edge of the green channel on the daily chart for temporary support. If price breaks below that look out for it to be in free fall.
ADX is now over 20. The trend is down. If anyone considers trading against the trend please use careful money management and stops, it is not recommended at all. The Trend Is Your Friend.
Thank you Lara for the thorough update and your timing of post is great!
Ok peoples. We have a new chart pattern, yes?
What are we gonna call it?
grazing animal?
walk the dog?
Greek “yellin” for their accordion?
Looks like a reverse cup and handle. Call it the teapot and it’s about to pour out all kinds of profits. Lol
: )
a squatty teapot at that!
ok, if you ignore the left handed handle I see the cup-n-handle your looking at, but looks more like grandpa’s pipe to me.
I’m just playin with ya!
Call it Scorpion, and be careful with it or you might get stung.
Just added NUGT at 6.34.
Good luck
lol. be nice. lol. Ben has a plan I’m sure.
Anyone know if Tham’s back from vacation?? Would really like to know which 3rd wave had ended recently. Any EW people here?
I do not believe it was anything higher than subminuette, if that
Thank you Eli.
Lara was right. These are quick 4th waves.
Hi dspropering. Just back a while ago.
Did a quick analysis.
The price movement from this point on will be all the fourth and fifth waves. It enables good swing trades as price will make lower highs and lower lows.
We have just completed pico 4, and is currently dropping in pico 5 (which would complete nano 3). I reckon the drop will reach 1142 – 1143, well at least below 1143 to avoid a truncation since pico 3 completed at today’s low of 1143.34. I bought some DUST while I was away, and would take profit at that point.
My strategy from now onwards is to buy DUST at the end of the fourth waves and take profit at the end of the fifth waves. (So next trade will be at the end of nano 4, circa 1148-1149). These waves create a whipsaw effect and it is not good to hold on for long.
I note that Degree of wave is not equivalent to duration of movement, nor depth of movement.
So difficult to time if exit is worthwhile –as I must wait for funds to clear before a re-purchase. Normally jumping in and out would work great. But if enough time passes that price then exceeds prior buy in it is not worth it to sell I’m sure you comprehend. Throws a whole nother (<- new word) into the variables for me. Really appreciate your analysis. Hard to believe these movements are such tiny wave moves.
I must analyze DUST chart as well. Bollinger Squeezing. Stochs/RSI oversold can stay there if keeps trending. 10-min MACD should start pulling up to zero line while price trades between tight .10 +- range and if crosses may pull 30-min higher – otherwise headed for pullback. Price been hitting resistance @22.79/80.
I think DUST is trending for now not ready for $2 pullback. Just IMHO
I was wrong about pico 4. It could now be over at 1149.56, and we are currently in pico 5.
its all good.
How was vacation? Are you refreshed enough to be back to the norm?
Thanks. It was a nice distraction. Now I am refreshed. Just a bit of jetlag though. Should be fine in a day or two.
News yesterday warned of very wild Wednesday, US news, Yellen testimony, oil adjusting to pending Iran deal, Greece vote on their disaster relief fund worse than their lying leader turned down about 2 weeks ago. He blew it for Greece on the offer and shut down the economy which cost Greece $20 billion economic loss. May take Greece 30 years to get out of their financial sinkhole. So leader should get fired and impreached or imprisoned.
Added back some JNUG at 14.40. VERY tight stop.
Good you have tight stops. Playing with fire, trying to catch a falling knife, Lara mentions extreme caution in bullish trades. Gold very bouncy this morning. Sometimes these big days that start strong could go in the same direction for hours or gold sideways as the miners keep going in same direction with momentum for hours, so must be agile and fast trader. Best wishes.
Its a small trade, and I have been working around the OPEX max pain numbers for Friday. I will likely be all cash come Friday end of day.
I think these bounces are 4th waves? Gold having trouble breaking through strong support going a ways back. I suppose that is to be expected. If bear count is right, the big move hasn’t happened yet. That is the real question. Will support hold and is this it for the move? Current EW count says no
Lara’s target 1123 in either 2 or 5 days and she favours 2 days. She forecast breakdown in 1-2 days below hourly brown line and fast below line. Lara said could be shallow 4th waves up .
Lara said maybe next daily green candlestick bounce up at 1,111 target. That sure sounds Bearish. Holy smokes DUST is still going up as the miners catch up as millions shift their positions to the new gold low.
DUST on a narrow 1 standard deviation slopped line still moving up since 8:30 am HUGE US Empire State Manufacturing strong increase and Yellen strong suggestion of US interest rates hikes this year. Last week had weak US economic news and looks strong now so US Dollar would move up and gold drops for that and other reasons like oil price drop, etc.
Ben are you going in early as your strategy? Cause I think your on the wrong side for now. I plan to switch over to Nugt if the bullish count confirms (eg: we can’t get below 1131.09)
I’m not so much playing the bullish count as I am OPEX right now.
And yes, I am definitely early. So far, this has not worked out well, but between the oversold levels, bullish COT, and OPEX, I was anticipating we would bounce and trade up to the $18 range in GDX.
Lara’s $16.17 target for GDX is only $0.21 away.
Ben – what do you show as max pain opex for GLD?
About $112.
Edit: About $112 less option premium…so maybe $111-$112.
If gold is dropping and GDX is dropping, option writers aren’t going to want to have shares put to them. That’s my theory, anyway, they will let it drop next week.
Thanks Ben
Your welcome.
I’m guessing the end of a 5th wave/one of the third waves was at 6:15am @1145.87. But anyone know which one?
Gold Weakens on Yellen Prepared Remarks to Congress
By Jim Wyckoff
Wednesday July 15, 2015 09:14
(Kitco News) – Gold prices are moderately lower in morning dealings Wednesday, in the wake of some bearishly construed remarks from Federal Reserve Chair Janet Yellen.
http://www.kitco.com/news/2015-07-15/Gold-Weakens-on-Yellen-Prepared-Remarks-to-Congress.html
US dollar up gold down on this news
Empire State Manufacturing Index Rises To 3.9 In July
By Kitco News
Wednesday July 15, 2015 08:36
Empire State Manufacturing Index Rises To 3.9 In July
http://www.kitco.com/news/2015-07-15/Empire-State-Manufacturing-Index-Rise-To-3-9-In-July.html
And we have lift off. 🙂
Finally! Yellen’s prepared (published) speech was released already, which opened the door to the downside. There could still be some bouncing around, but the trend is set.
Good video on gold, gold COT, and $GDM (GDX) by Joseph Roy-Byrne. Dated 7/14.
http://thedailygold.com/precious-metals-video-update-gold-silver-prognosis/
Mixed Messages for Metals – Avi Gilburt EW – First published Sat Jul 11 for members
http://news.goldseek.com/GoldSeek/1436904000.php
Lara,
With (iii) targeting 1136, that would leave only $5 to complete C, which means wave (v) would probably need to be an ED possibly.
Thanks for adding the targets.
Possibly. Or maybe just very short.
I don’t think it can do it. But it’s possible.
Ben, in the last session, you mentioned that GDX may be in Minuette wave 4. I would suggest that we are only in Subminuette wave 4. I think this fits better with Lara’s target and where gold is. Bob
Thanks Bob. That is the other possibility and if this is the case, I’m guessing it’s coming tomorrow with a 3-4% drop, and then a sharp turn into green (iv).
I took profits on my JNUG position from yesterday. A little extra cash in case (iii) isn’t done yet.
Our flat on NUGT.