
Downwards movement was expected.
The Elliott wave count remains the same, supported again by technical analysis indicators.
Summary: Downwards movement should continue. Use the brown channel on the hourly chart to indicate where upwards corrections should find resistance. The target for the next interruption to the trend may be at 1,123 which may be met tomorrow or in four days time.
To see weekly charts click here.
Changes to last analysis are bold.
MAIN ELLIOTT WAVE COUNT
Click chart to enlarge.
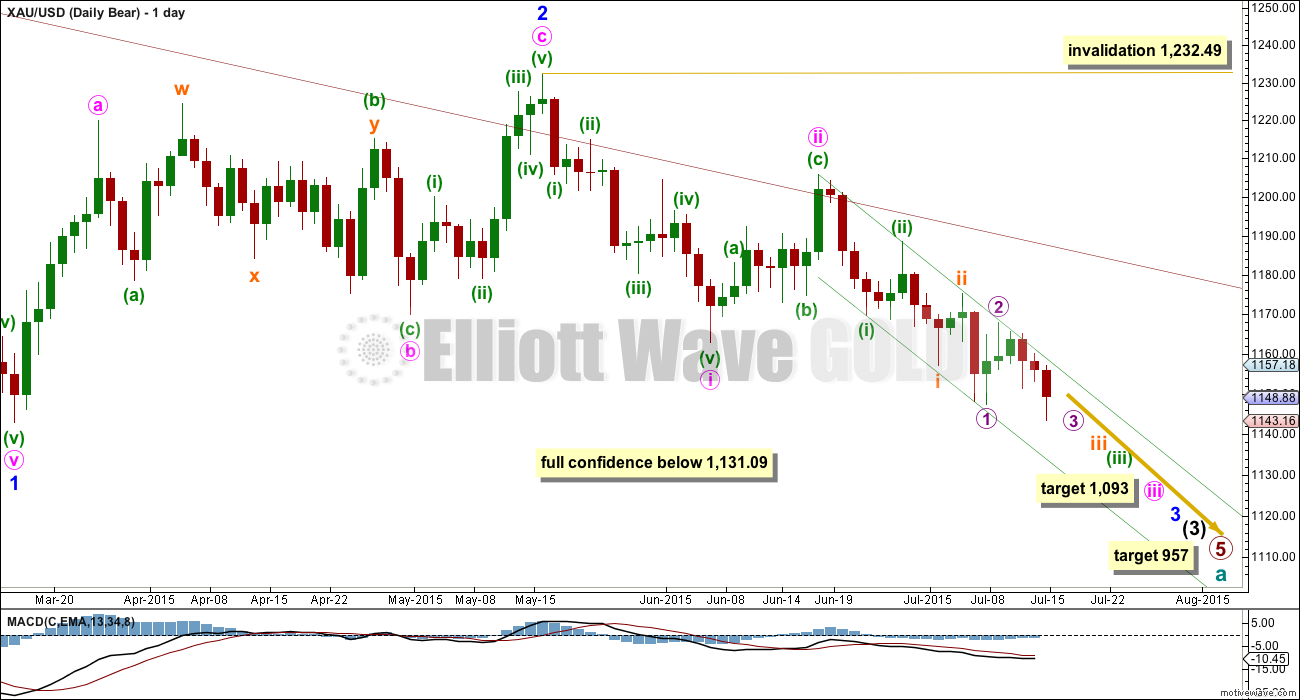
The main wave count expects that cycle wave a is an incomplete impulse.
Within primary wave 5, the daily chart focuses on the middle of intermediate wave (3). Intermediate wave (3) has yet to show an increase in downwards momentum beyond that seen for intermediate wave (1).
This wave count has increased in probability with a new low below 1,162.80. Full confidence may be had in this wave count with a new low below 1,131.09.
Pros:
1. Intermediate wave (1) (to the left of this chart) subdivides perfectly as a five wave impulse with good Fibonacci ratios in price and time. There is perfect alternation and proportion between minor waves 2 and 4. For this piece of movement, the bear wave count has a much better fit than the bull wave count.
2. Intermediate wave (2) (to the left of this chart) is a very common expanded flat correction. This sees minor wave C an ending expanding diagonal which is more common than a leading expanding diagonal.
3. Minor wave B (to the left of this chart) within the expanded flat subdivides perfectly as a zigzag.
4. Volume at the weekly and daily chart continues to favour the bear wave count. Since price entered the sideways movement on 27th March, it is a downwards week which has strongest volume and the downwards day of 2nd July which has strongest volume.
5. On Balance Volume on the weekly chart breached a trend line from back to December 2013. This is another bearish indicator.
Cons:
1. Intermediate wave (2) (to the left of this chart) looks too big on the weekly chart.
2. Intermediate wave (2) (to the left of this chart) has breached the channel from the weekly chart which contains cycle wave a.
3. Within minor wave 1 down, there is gross disproportion between minute waves iv and ii: minute wave iv is more than 13 times the duration of minute wave i, giving this downwards wave a three wave look.
4. Minor wave 2 is much longer in duration than a minor degree correction within an intermediate impulse normally is for Gold. Normally a minor degree second wave within a third wave should last only about 20 days maximum. This one is 44 days long.
Minor waves 1 and 2 are complete. Minute waves i and ii are also complete. Gold may be ready to move to the strongest middle of intermediate wave (3).
Minute wave ii may not move beyond the start of minute wave i above 1,232.49.
Minute wave ii is now very likely to be over here. If it moves any higher, then it should find strong resistance at the blue trend line.
At 1,093 minute wave iii would reach 1.618 the length of minute wave i. If minute wave iii ends in a total Fibonacci thirty four days, then this target may be reached in another fifteen days.
Draw a base channel about minuette waves (i) and (ii) as shown (green trend lines). Look for upwards corrections along the way down to continue to find resistance at the upper edge of that channel. When the strongest part of downwards movement arrives, then it may have the power to break through support at the lower edge of the channel. For now this channel is perfectly showing where price is finding support and resistance. This channel is drawn in the same way on the daily and hourly charts, but the daily chart is on a semi-log scale and the hourly is arithmetic. Use the channel on the daily chart as a guide.
If the green channel is breached to the upside, then my wave count may be wrong. It is technically possible (but extremely unlikely) that minute wave ii could continue further sideways as an expanded flat or double combination. However, it may not move beyond the start of minute wave i above 1,232.49.
HOURLY ELLIOTT WAVE COUNT
Click chart to enlarge.
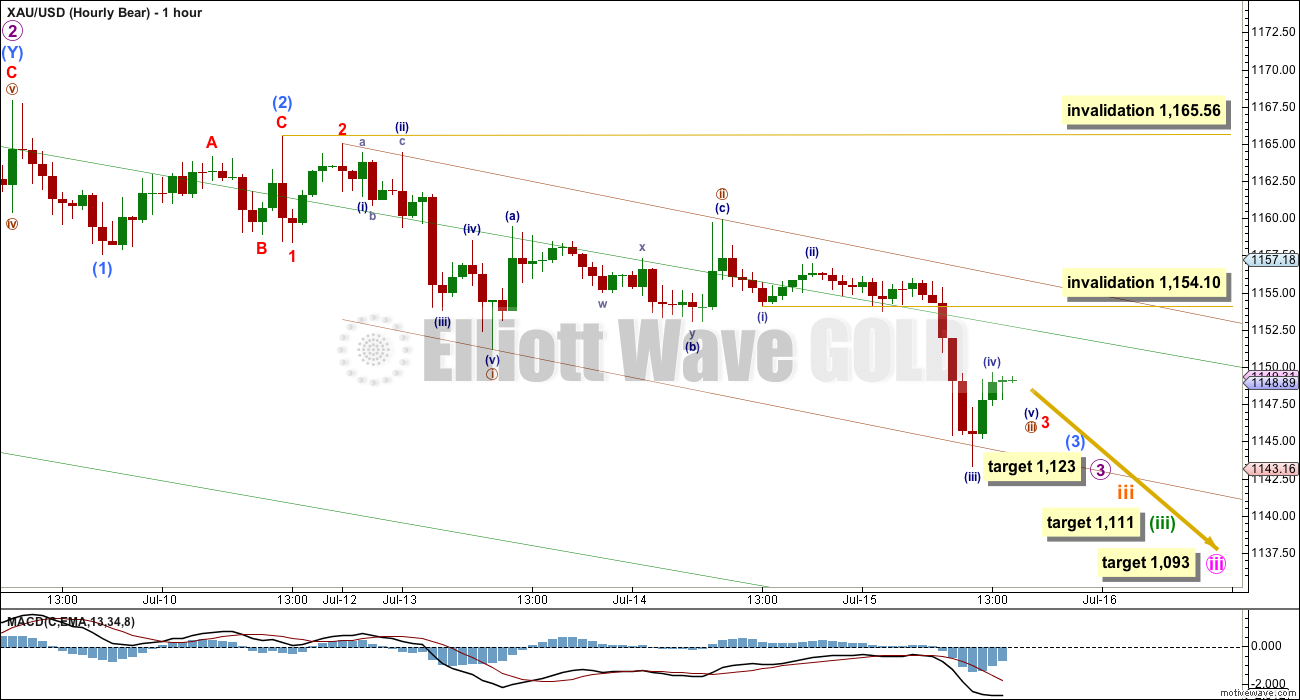
This hourly chart works in exactly the same way for the alternate wave count. The only difference for the alternate wave count is the degree of labelling would be one degree lower.
Although I have labelled pico (navy blue) wave (iii) complete, if this wave count is wrong, then the reason may be this detail. The middle of the third wave may not yet have passed; it may be necessary to move the degree of labelling from the end of micro wave 2 all up one degree, with the direction expected to be the same and the channels to be the same.
At 1,123 micro wave 3 would reach 1.618 the length of micro wave 1. This target may be met tomorrow if micro wave 3 lasts a total Fibonacci five days.
I checked the subdivisions of pico wave (iii) on the one minute chart and it can be seen as a completed five wave impulse. It has a curved three wave look to it, which is actually quite typical: Gold has more time consuming second wave corrections, third wave impulses contain a very strong fifth wave extension, and the following fourth waves are quick and shallow. We may be about to see this at larger wave degrees. The time taken for these second wave corrections may not be replicated when we come to the corresponding fourth wave corrections.
Keep drawing the brown base channel about nano (brown circle) waves i and ii. Look for upward corrections now to find resistance at the upper brown trend line. Downwards movement is finding support at the lower trend line. The next wave down should have the power to break through support at that line. Thereafter, the next line of support would be the lower edge of the green channel (use that one on the daily chart for more accuracy). When that lower green trend line is broken through, then we may see downwards momentum increase strongly, and the series of fourth waves may begin.
If my labelling of pico waves (i), (ii) and (iii) is correct, then pico wave (iv) may not move into pico wave (i) price territory above 1,154.10.
At 1,111 minuette wave (iii) would reach 2.618 the length of minuette wave (i).
ALTERNATE ELLIOTT WAVE COUNT
Click chart to enlarge.
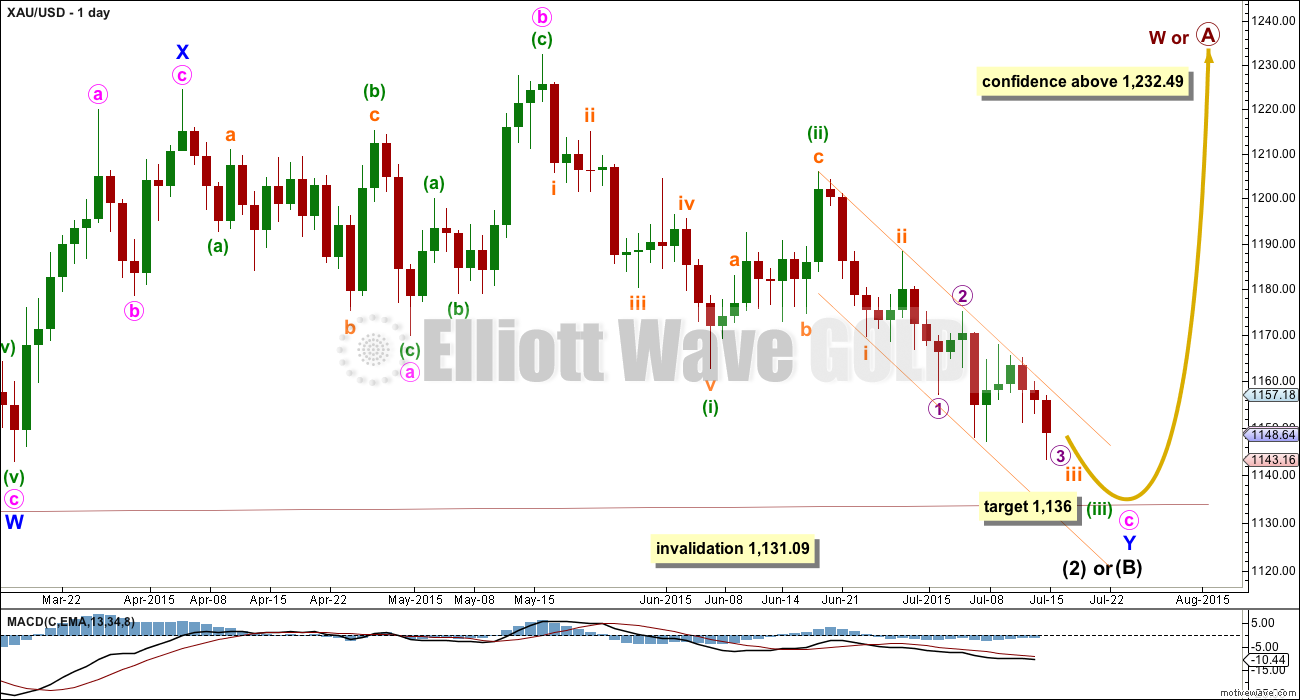
This bull wave count looks at the possibility that cycle wave a is a complete impulse and that cycle wave b began back at 1,131.09. Within cycle wave b, primary wave A is incomplete and subdividing either as a zigzag or an impulse.
Pros:
1. The size of the upwards move labelled here intermediate wave (A) (to the left of this chart) looks right for a new bull trend at the weekly chart level.
2. The downwards wave labelled minor wave W looks best as a three.
3. The small breach of the channel about cycle wave a on the weekly chart would be the first indication that cycle wave a is over and cycle wave b has begun.
Cons:
1. Within intermediate wave (3) of primary wave 5 (to the left of this chart), to see this as a five wave impulse requires either gross disproportion and lack of alternation between minor waves 2 and 4 or a very rare running flat which does not subdivide well. I have tried to see a solution for this movement, and no matter what variation I try it always has a problem which substantially reduces its probability.
2. Intermediate wave (5) of primary wave 5 (to the left of this chart) has a count of seven which means either minor wave 3 or 5 looks like a three on the daily chart.
3. Expanding leading diagonals (of which intermediate wave (A) or (1) is) are are not very common (the contracting variety is more common). There is also now a second expanding leading diagonal for minute wave i.
4. Volume does not support this bull wave count.
5. Intermediate wave (B) or (2) may only be continuing as a double combination. Minor wave X is shallow, and X waves within double combinations are normally very deep. This one looks wrong.
Volume for 8th July shows a strong increase for an up day at 218.9K. It is stronger than all the prior down days since Gold entered the sideways consolidation back on 27th March except for one, that of 2nd July at 285.8K. *I noticed that last Thursday the volume data changed for 9th April and 2nd July. Prior to that date, 9th April had a volume spike of 230.3K, but now it is lower at 115.2K, and last Thursday volume data for 2nd July also changed from below the prior day to a spike now at 285.8K. With changing volume data, this makes volume analysis… rather difficult.
Intermediate wave (A) (to the left of this chart) subdivides only as a five. I cannot see a solution where this movement subdivides as a three and meets all Elliott wave rules (with the sole exception of a very rare triple zigzag which does not look right). This means that intermediate wave (B) may not move beyond the start of intermediate wave (A) below 1,131.09. That is why 1,131.09 is final confirmation for the bear wave count at the daily and weekly chart level.
The only option now for the bull wave count is to see intermediate wave (B) or (2) continuing sideways as a double combination. The first structure in the double is a zigzag labelled minor wave W. The double is joined by a brief three in the opposite direction labelled minor wave X, a zigzag. The second structure in the combination is an expanded flat labelled minor wave Y which is incomplete.
Within minor wave Y, minute wave b is a 1.15 times the length of minute wave a indicating an expanded flat. Both minute waves a and b are three wave structures.
Minute wave c downwards must subdivide as a five, and because the first wave within it is an impulse and not a zigzag minute wave c may only be unfolding as an impulse.
Within minute wave c downwards, the third wave is incomplete for minuette wave (iii). At the hourly chart level, this bull wave count sees the subdivisions in exactly the same way as the bear (the bull sees everything one degree lower) so the hourly charts are the same. For this reason I will publish only hourly charts for the bear because they work in exactly the same way for the bull.
There does not look to be enough room for minute wave c to complete as a five wave impulse and remain above the invalidation point at 1,131.09. This is now the biggest problem with the bull wave count.
At 1,136 minuette wave (iii) would reach equality in length with minuette wave (i).
TECHNICAL ANALYSIS
Click chart to enlarge.
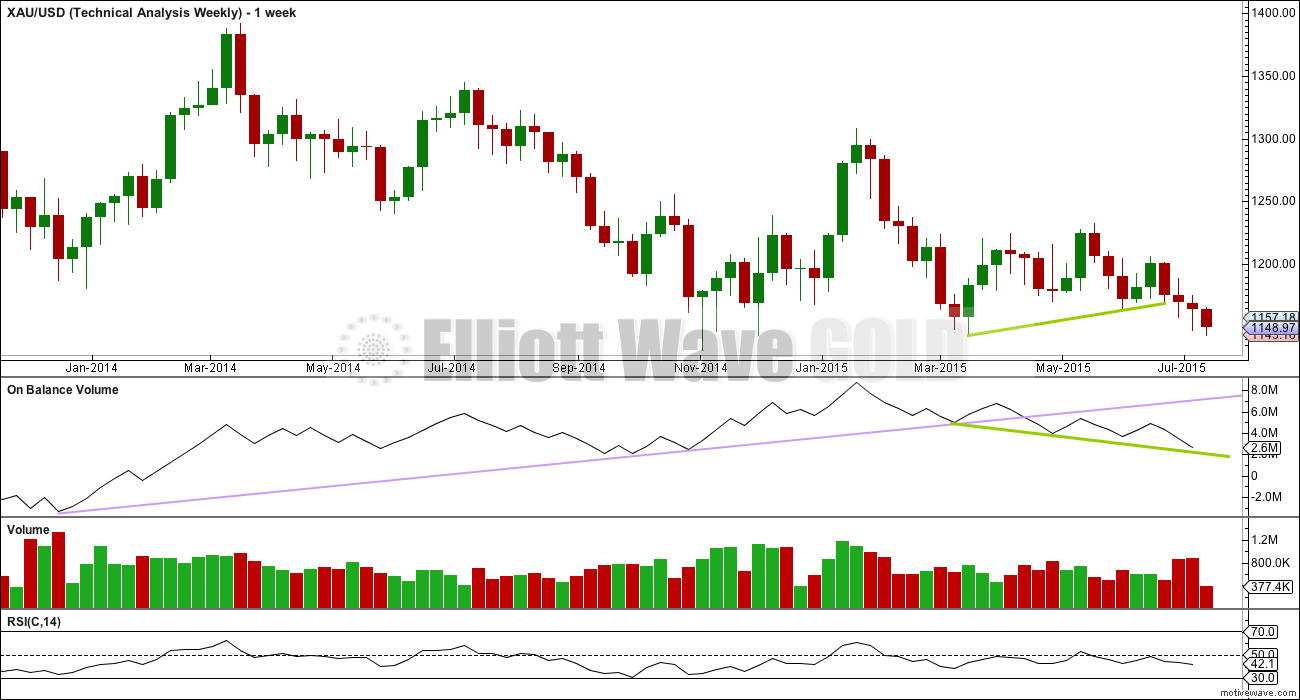
Weekly Chart: Overall volume still favours a downwards breakout which may now be underway. During this sideways movement, it is still one down day and a down week which have higher volume. On Balance Volume breaches a trend line (lilac line) which began in December 2013, and the breach is significant.
While price has made higher lows, On Balance Volume has made lower lows (green trend lines). This small rise in price is not supported by volume, and it is suspicious. Price is now breaking below support at the green trend line, which is another bearish indicator.
At the weekly chart level, volume is strongest in a down week. Overall volume up until two weeks ago volume was declining, typical of a maturing consolidation. Each series of down weeks includes a week with stronger volume than the following series of up weeks. A breakout should come with increasing volume, which looks like what is happening. Last week has slightly higher volume than the week immediately prior; the fall in price is supported by volume.
RSI is usually a fairly reliable indicator of lows. At the weekly chart level, RSI is well above 30 indicating there is room yet for Gold to move lower.
Click chart to enlarge.
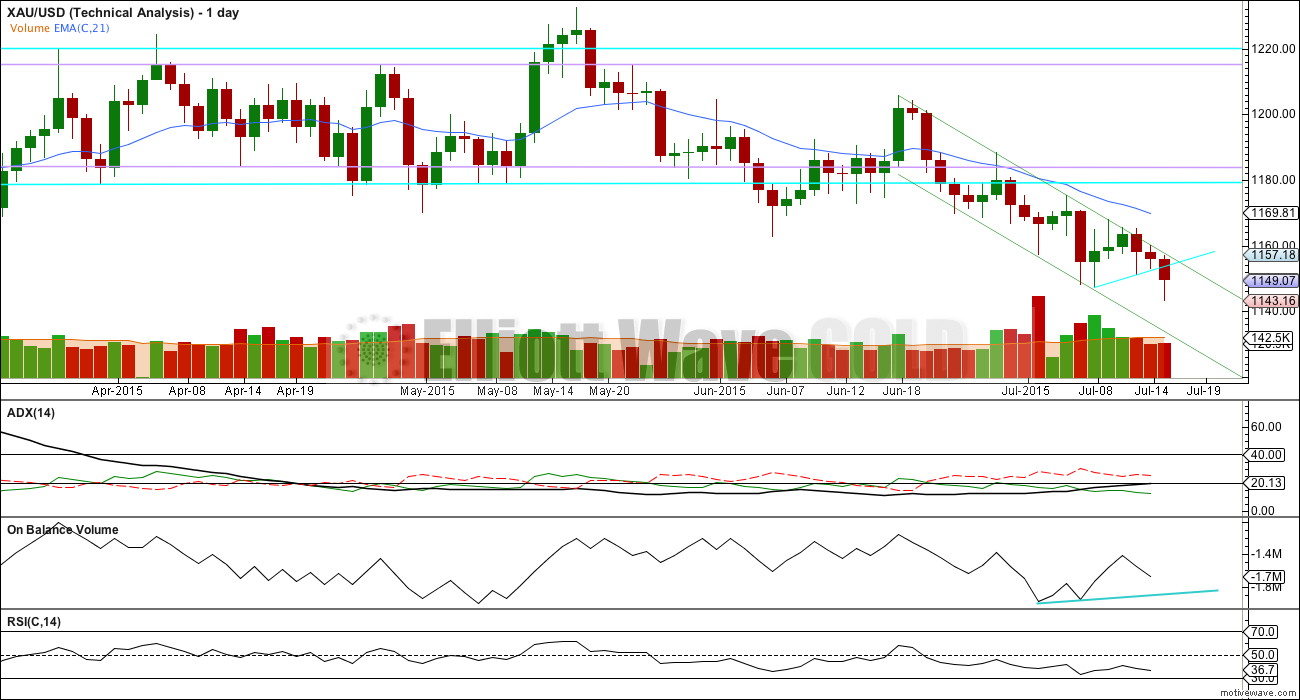
Daily Chart: ADX is now over 20 and rising. ADX is clear: there is a trend and it is down. A trend following system should be used. The system outlined here is very simple: price should remain below the 21 day EMA (and my choice of 21 days may not be the best, you may choose a different time frame according to your trading style) and the parallel green channel should show where price finds resistance and at least initially support. The idea is to enter short when price finds resistance, and maybe to exit when it finds support (longer term positions may benefit from being held). It’s a very simple approach; simple is usually best.
Volume for Wednesday is slightly higher. This fall in price is slightly supported by volume.
Price has broken through support at the small upward sloping aqua blue trend line. The next line of support is the lower edge of the green channel, which is drawn in the same way on all charts.
The upper edge of the green channel has been tested again, now nine times. It is somewhat shallow, repeatedly tested and now has held for 19 days. It is fairly technically significant. It should continue to show on the daily chart where upwards movement finds resistance.
The long lower wick for Wednesday’s candlestick is slightly bullish. But it may only point to upwards movement to the green trend line, which should continue to hold.
RSI on the daily chart remains above 30. There is still room for Gold to fall.
When On Balance Volume comes down to touch the small blue trend line, then it may find support there. That may show when a bounce is initiated at the daily chart level.
This analysis is published about 04:28 p.m. EST.
Oh wow, didn’t refresh my browser and log back in so all morning I thought this place was a ghost town.
So now that’s over. Any idea how much higher this current 4th wave will go, and is it submicro 4? Skip that, Lara’s post & mine crossed. : )
Today’s red candlestick shows another increase in volume.
Volume continues to support this fall in price.
I’m moving everything on the hourly chart since the end of micro wave 2 down one degree. Like I said yesterday, I don’t think the middle of this third wave has yet passed. I expect we are seeing submicro wave (1) only unfold now.
ATM I am seeing pico wave (iv) (navy blue) unfold which may not move into pico wave (i) price territory above 1,151.20.
When it is done then nano wave iv (brown circle) must unfold, it cannot move into nano wave i price territory above 1,160.57.
Then minuscule wave 4 (red) needs to unfold, it can’t move into minuscule wave 1 price territory above 1,157.59.
That would complete submicro wave (1). Submicro wave (2) can’t move beyond the start of submicro wave (1) at 1,167.92, but it should be relatively shallow because it should find very strong resistance at the upper edge of the green channel on the daily chart.
I’m off to write up the analysis now, and I’m aiming today to have it out comfortably before NY closes.
Good luck everyone!
Gold price seems to be finding support at 1142-41 with 1136-35 below there but at the same time is also facing resistance at or about pivot 1149-50…. I wonder what gives….
Rambus public post – $USD and other currencies. Looks bearish for gold.
http://rambus1.com/?p=40783
Gold down 3 %, miners, by contrast, dropped 16 percent year-to-date.
Are Gold Miners Oversold? These Charts Show Not All Glitters
July 15, 2015
http://www.bloomberg.com/news/articles/2015-07-15/are-gold-miners-oversold-three-charts-show-not-all-glitters
Something to think about. I know that many trade the 3x ETF’s and are leery to hold them for any period of time, due to the associated risk and presumed DECAY since the results are only truly 3x for one day at a time. I also know that most of us who trade them have learned the hard way how dangerous they can be. That said, I’m attaching a quick comparison of GDX, NUGT, and DUST for a period of just over a month from the last “top”. Holding DUST for this time frame would have been a BIG winner. Easier said than done, but the point is that buying and holding during a STRONG trend can be very profitable.
Holding 3X ETF’s work only if the price movement is in one direction, for example in a downtrend, with very shallow corrections upwards. If the upwards corrections are larger, as I expect these 4th waves to be, then the decay factor is something to contend with.
Tham, you have lots of EW expertise and see probable large 4th waves. If I recall correctly Lara commented that 4th waves were expected to be shallow.
Have I misstated the position you and Lara have taken? Would you please comment on this disconnect?
Hi Davey.
I agree that 4th waves are shallow. I think that they will find resistance at the top of the channel. 5th waves will hit support at the bottom of the channel. So, they will be contained within the channel.
Hence, 4th waves are shallow but not that small, possibly retracing 0.236 or 0.382 Fib. By deep, I would take it to be a 0.618 or higher retrace.
Thanks Tham.
I mean shallow in relation to the third waves they will be correcting.
The second waves are so far relatively deep, for example minuette wave (ii) is 0.52 of minuette wave (i).
If minuette wave (ii) = 2.618 X (i) it will be $100.16 in length. If minuette wave (iv) is shallow it may be 0.382 of minuette wave (iii) which would be $38.26.
So the actual length of the fourth waves may be quite big, but they will still be shallow in relation to the third waves because they will be long.
Thanks Lara.
Hi Tham, Have you taken profits on DUST. I’ve been in for 8 days and usually that’s a good time to take profits, However if we break stops under 1142 we should fall quickly, would hate to get caught on the sidelines, any insight appreciated.
Hi Robert. I did take profits on DUST. But now, the price rise in DUST is in an increasing pace. Any drop in price, on upward corrections in gold price, does not seem to lower DUST price much. As such, I am going to next take profit only at 1123 gold price, as Lara suggested. It ought to yield a $4 rise in DUST from current levels. Any way, she thinks that it should happen in 3 trading days’ time, so decays will not be significant. Hope this works out.
Thanks Tham
Greece’s parliament has passed austerity measures and now shifts the focus to the eurozone finance ministers, who must agree to launch a third bailout for the country through the European Stability Mechanism, Europe’s bailout fund.
I know this is a bit off topic (it’s not TA) but I do wonder what was the point of the referendum that Tsipras had in terms of democracy.
It’s a multifaceted situation over there in Greece. If we have any Greek members here I sure would like to hear your views, as I’m sure other members would too.
I’m not from Greece but I believe the sense was he would have greater negotiating power with a No vote. It turned out he did not. I’ve read a bit about how they may have employed game theory and all but seems to me they simply bluffed and were called. And even raised
Merkel played a better poker game and Greece had few allies since other indebted countries had already taken their austerity in prior years and already see their economies improving.
I will throw in some globalist NWO (new world order) conspiracy.
It’s all a big game, Tsipras is owned by same global elites who owned his predecessors and will own his successors. Referendum was just for show, was never intended to change the predetermined outcome–just go thru the motions to look good. NWO elites will never truly let Greece go–can not allow the slaves to go free because Spain, Portugal , etc might consider rebelling against the global banksters. If, and that is a big if, Greece were allowed to leave EuroZone they will be humiliated, broken, bankrupted and starved as an example to others who might consider independence.
This stuff is happening all over the supposed “free” world. In the USA a large majority of Republicans were elected to oppose Obama (NWO) policies such as ObamaCare, NSA spying, mass immigration etc. Newly elected opposition has done nothing to deter Obama policies and has even supported Trans Pacific Partnership wanted by globalists as a EuroZone for the Pacific.
All sort of like the famous song Hotel California by The Eagles: “You can checkout any time you like but you can never leave.”
World markets are manipulated by central banks to support bankster objectives–fundamentals and reality mean nothing. Elliott Wave is one of few tools available to help us “see” where markets are headed no matter who created or how energy behind the market movement is created.
So…Lara your EW analysis provides one of the few honest views of the world economy.
And to add to my NWO post–a great book that explains how entire countries are taken over by globalist banksters read “Confessions Of An Economic Hitman” or YouTube same.
Yes Elliott Wave is an excellent ticket to our financial freedom. It helps to combine it with the very best trading indicators like John Carter’s. He has some amazing indicators that are part of TOS and Tradestation and other platforms. I highly recommend them. When master John Carter’s TTM indicators (has videos on youtube) and combined with Lara’s Elliott Wave are like a one, two punch to the Big Bad Guys- insert your choice of bad guy name here, i.e. bankers, forever bullish gold miner promoters, Fed, politician, Vladimir Putin, etc.