
Price has moved slowly lower on slightly lower volume.
This downwards movement looks corrective and fits both bull and bear Elliott wave counts.
Summary: In the very short term (next 24 hours) a little upwards movement to 1,180 may complete a small second wave correction for the bear. When that is done, then it will be poised to fall off a cliff. Volume favours the bear wave count; if the bear is correct, then the trend is down. The trend is your friend; trading against the trend does not usually end well. The bull wave count expects a third wave up to be in its earliest stages. The bull wave count requires some price confirmation while volume continues to indicate it is less likely.
To see the bigger picture and weekly charts go here.
Changes to last analysis are italicised.
Bull Wave Count
Click chart to enlarge.
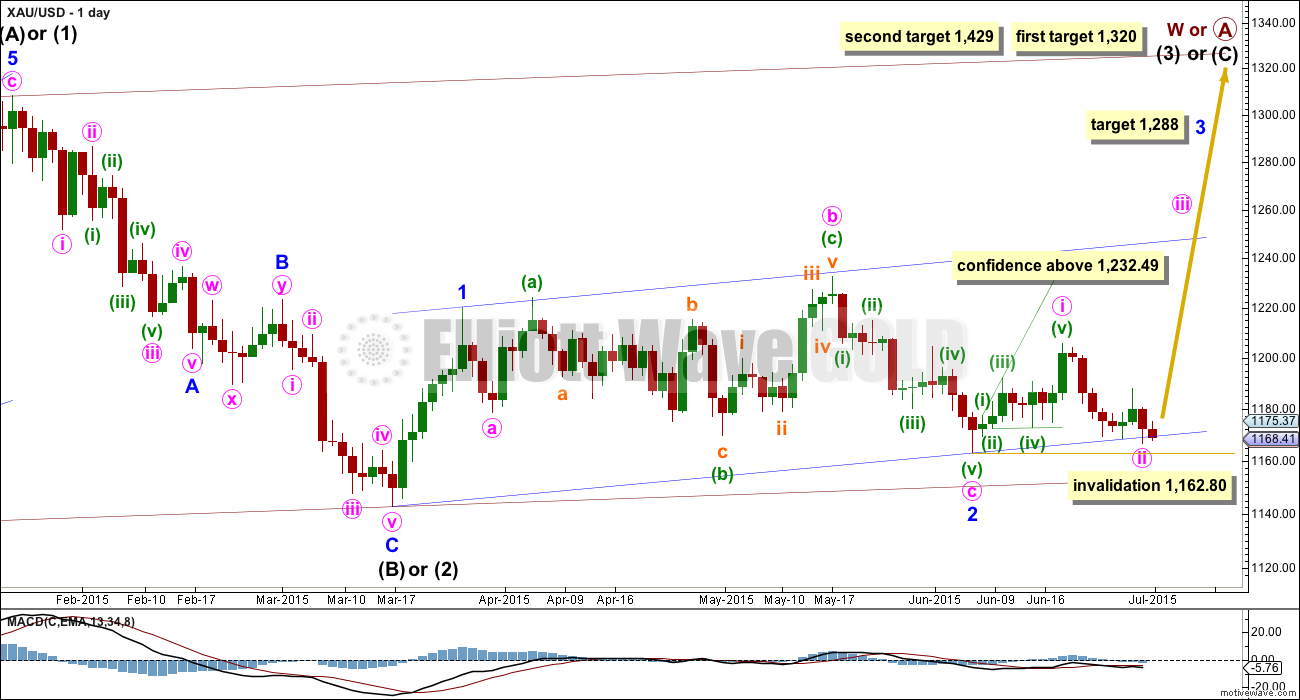
The bull wave count sees primary wave 5 and so cycle wave a a complete five wave impulse on the weekly chart.
Pros:
1. The size of the upwards move labelled here intermediate wave (A) looks right for a new bull trend at the weekly chart level.
2. The downwards wave labelled intermediate wave (B) looks best as a three.
3. The small breach of the channel about cycle wave a on the weekly chart would be the first indication that cycle wave a is over and cycle wave b has begun.
Cons:
1. Within intermediate wave (3) of primary wave 5 (now off to the left of this chart), to see this as a five wave impulse requires either gross disproportion and lack of alternation between minor waves 2 and 4 or a very rare running flat which does not subdivide well. I have tried to see a solution for this movement, and no matter what variation I try it always has a problem which violates an Elliott wave rule.
2. Intermediate wave (5) of primary wave 5 (now off to the left of the chart) has a count of seven which means either minor wave 3 or 5 looks like a three on the daily chart.
3. Expanding leading diagonals (of which intermediate wave (A) or (1) is) are are not very common (the contracting variety is more common). There is also now a second expanding leading diagonal for minute wave i.
4. Volume does not support this bull wave count.
For volume to clearly support the bull wave count it needs to show an increase beyond 187.34K (30th April) and preferably beyond 230.3K (9th April) for an up day. Only then would volume more clearly indicate a bullish breakout is more likely than a bearish breakout.
Within cycle wave b, primary wave A may be either a three or a five wave structure. So far within cycle wave b there is a 5-3 and an incomplete 5 up. This may be intermediate waves (A)-(B)-(C) for a zigzag for primary wave A, or may also be intermediate waves (1)-(2)-(3) for an impulse for primary wave A. At 1,320 intermediate wave (C) would reach equality in length with intermediate wave (A) and primary wave A would most likely be a zigzag. At 1,429 intermediate wave (3) would reach 1.618 the length of intermediate wave (1) and primary wave A would most likely be an incomplete impulse.
Intermediate wave (A) subdivides only as a five. I cannot see a solution where this movement subdivides as a three and meets all Elliott wave rules (with the sole exception of a very rare triple zigzag which does not look right). This means that intermediate wave (B) may not move beyond the start of intermediate wave (A) below 1,131.09. That is why 1,131.09 is final confirmation for the bear wave count at the daily and weekly chart level.
Intermediate wave (C) is likely to subdivide as an impulse to exhibit structural alternation with the leading diagonal of intermediate wave (A). This intermediate wave up may be intermediate wave (3) which may only subdivide as an impulse.
Minor wave 2 is over here. Minute wave c is just 2.7 longer than 1.618 the length of minute wave a. At 1,288 minor wave 3 would reach 1.618 the length of minor wave 1.
Within minor wave 3, no second wave correction may move beyond its start below 1,162.80.
A new high above 1,232.49 would eliminate the bear wave count and provide full confidence in the targets.
Hourly Bull Wave Count
Click chart to enlarge.
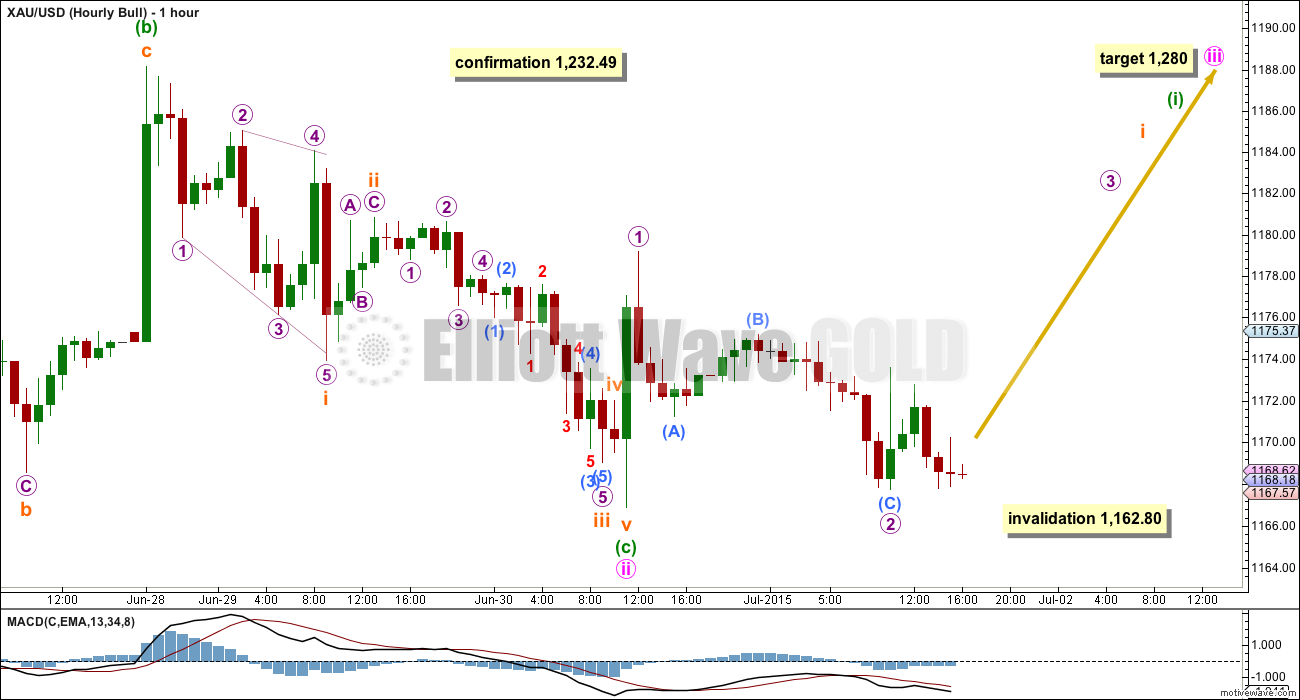
Downwards movement so far fits perfectly as a zigzag. This may be a second wave correction.
At 1,280 minute wave iii would reach 2.618 the length of minute wave i. This target may be about a month away. Along the way up downwards corrections should show on the daily chart.
If minute wave ii continues any further, then it may not move beyond the start of minute wave i below 1,162.80.
Bear Wave Count
Click chart to enlarge.
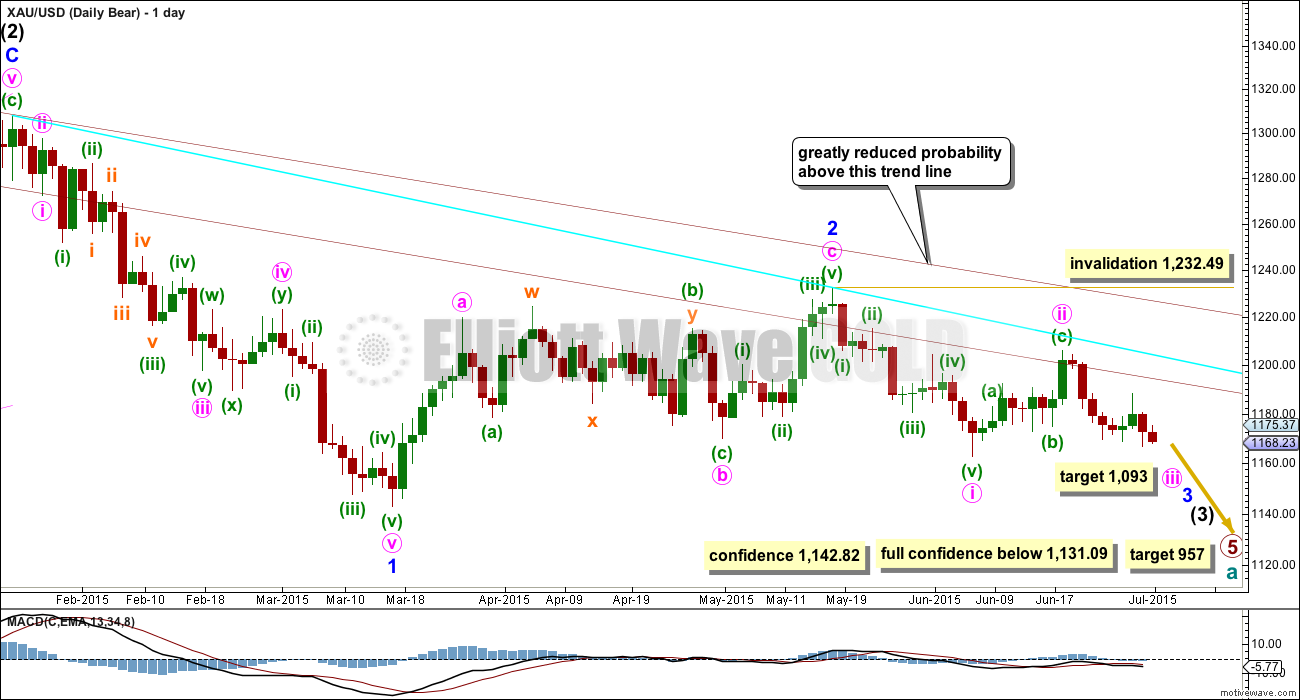
This wave count follows the bear weekly count which sees primary wave 5 within cycle wave a as incomplete. At 957 primary wave 5 would reach equality in length with primary wave 1.
Pros:
1. Intermediate wave (1) (to the left of this chart) subdivides perfectly as a five wave impulse with good Fibonacci ratios in price and time. There is perfect alternation and proportion between minor waves 2 and 4. For this piece of movement, the bear wave count has a much better fit than the bull wave count.
2. Intermediate wave (2) is a very common expanded flat correction. This sees minor wave C an ending expanding diagonal which is more common than a leading expanding diagonal.
3. Minor wave B within the expanded flat subdivides perfectly as a zigzag.
4. Volume at the weekly and daily chart continues to favour the bear wave count. Since price entered the sideways movement on 27th March it is a downwards week which has strongest volume, and it is downwards days which have strongest volume, five of them.
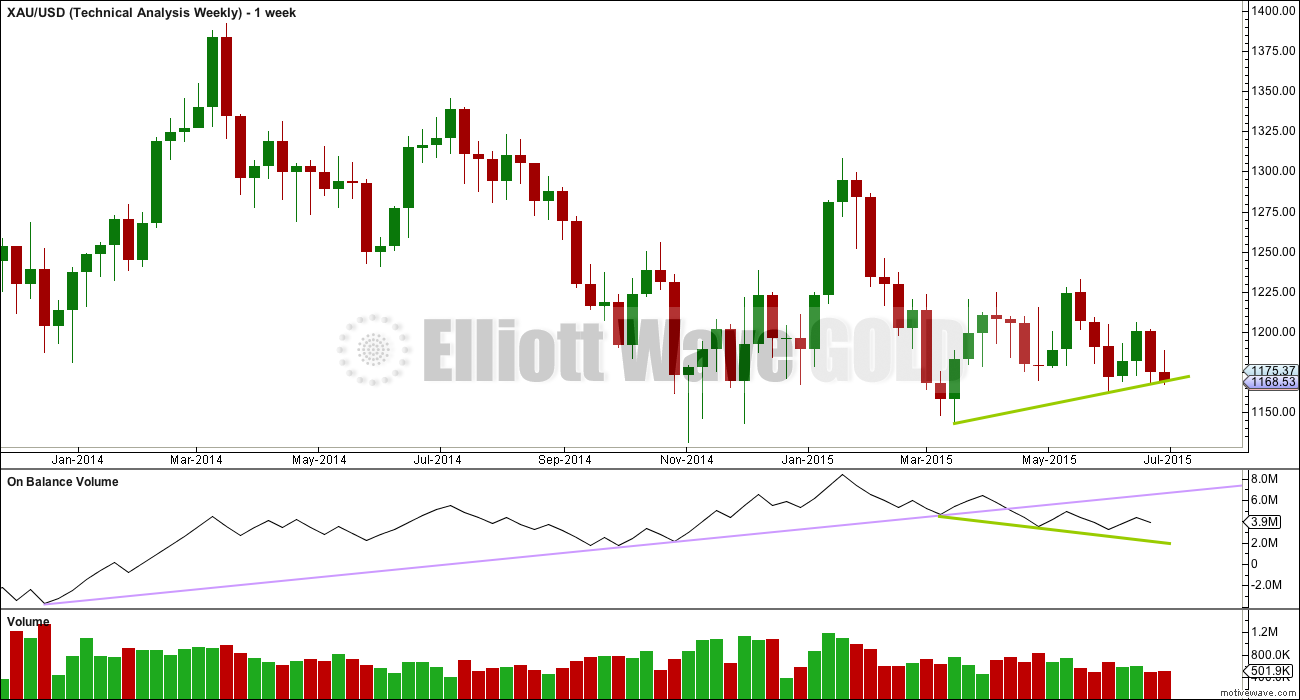
5. On Balance Volume on the weekly chart breached a trend line from back to December 2013. This is another bearish indicator.
Cons:
1. Intermediate wave (2) looks too big on the weekly chart.
2. Intermediate wave (2) has breached the channel from the weekly chart which contains cycle wave a.
3. Minor wave 2 is much longer in duration than a minor degree correction within an intermediate impulse normally is for Gold. Normally a minor degree second wave within a third wave should last only about 20 days maximum. This one is 44 days long.
4. Within minor wave 1 down, there is gross disproportion between minute waves iv and ii: minute wave iv is more than 13 times the duration of minute wave i, giving this downwards wave a three wave look.
Minor waves 1 and 2 are complete. Minute waves i and ii are also complete. Gold may be ready to move to the strongest middle of intermediate wave (3).
Minute wave ii may not move beyond the start of minute wave i above 1,232.49.
At this stage, a new low below 1,162.80 would provide a lot of confidence in the bear wave count. Further confidence would come with a new low below 1,142.82 and final confidence would come only with a new low below 1,131.09.
Minute wave ii is now very likely to be over here. If it moves any higher, then it should find strong resistance at the blue trend line.
At 1,093 minute wave iii would reach 1.618 the length of minute wave i. If minute wave iii ends in a total Fibonacci twenty one days, then this target may be reached in another twelve days time.
Tuesday and Wednesday have completed down days with high volume. If a downwards breakout is beginning, then it would be expected to happen with increased volume.
Hourly Bear Wave Count
Click chart to enlarge.
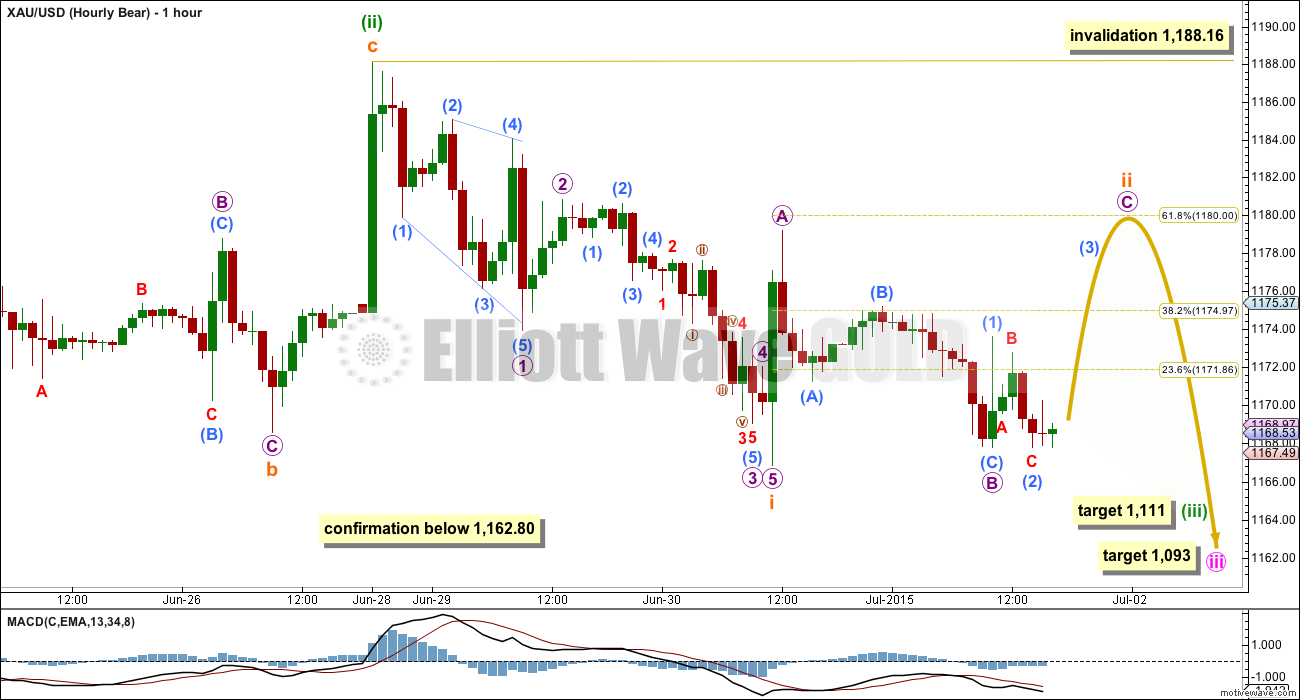
Gold often shows the second and fourth wave subdivisions clearly on the daily chart, within its third wave impulses, which is probably what is happening here. Subminuette waves ii and iv may show up on the daily chart so that minuette wave (iii) looks like a clear five wave impulse on the daily chart.
Subminuette wave ii is incomplete. Because micro wave A subdivides so well on the five minute chart as an impulse, micro wave B should not move beyond its start below 1,166.86. Subminuette wave ii looks like it is unfolding as a zigzag.
Micro wave C is very likely to make at least a slight new high above the end of micro wave A at 1,179.17 to avoid a truncation. At 1,180 micro wave C would reach equality in length with micro wave A and subminuette wave ii would correct to the 0.618 Fibonacci ratio of subminuette wave i.
When subminuette wave ii is complete, then that will be the fifth second wave correction in a series of five overlapping first and second waves. The next movement down may be explosive as the middle of a third wave begins, which may be deep and strong enough to make a downwards breakout clear.
At 1,111 minuette wave (iii) would reach 2.618 the length of minuette wave (i). If minuette wave (iii) lasts a Fiboancci five or eight days in total, then this target may be met in either another three or six days time.
Subminuette wave ii may not move beyond the start of subminuette wave i above 1,188.16. If this invalidation point is breached in the short term, then it would be minuette wave (ii) continuing sideways as a double flat or double combination. This idea is technically possible, but it has a very low probability. It would expect only sideways movement so not much movement above 1,188.16 at all.
Technical Analysis
Click chart to enlarge.
Weekly Chart: Overall volume still favours a downwards breakout eventually. During this sideways movement, it is still down days and a down week which have higher volume. On Balance Volume breaches a trend line (lilac line) which began in December 2013, and the breach is significant.
While price has made higher lows, On Balance Volume has made lower lows (green trend lines). This small rise in price is not supported by volume, and it is suspicious.
At the weekly chart level, volume is strongest in a down week. Overall volume is declining, typical of a maturing consolidation. Each series of down weeks includes a week with stronger volume than the following series of up weeks. The breakout should come very soon now and volume indicates a downwards breakout is more likely than upwards.
Click chart to enlarge.
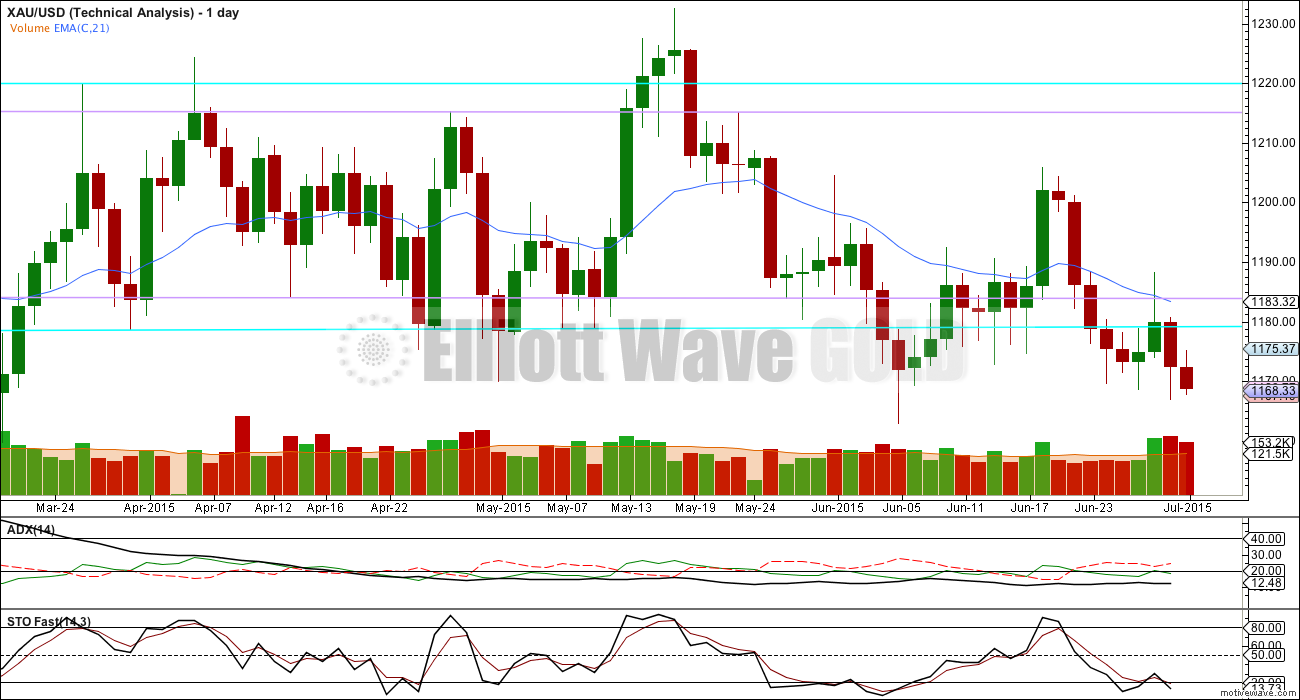
Daily Chart: ADX still indicates there is no clear trend. A range bound trading system would be better employed than a trend following system. Trading in a range bound market, as Gold has been in since the 27th of March, is inherently more risky than trading a trending market. Careful money management rules are essential to avoid wiping out your account. A good rule to follow would be to invest no more than 2% of the equity in your account on any one trade.
The range bound system illustrated here uses horizontal lines of support and resistance along with fast Stochastics to illustrate overbought and oversold. The idea is to expect the end of one swing and the start of another when price is at support or resistance and Stochastics is at oversold or overbought.
Eventually Gold will break out of this range it entered on 27th March; a breakout is 100% certain. What is uncertain is what direction the breakout will be. When the breakout comes, then this range trading system will be expecting a move in the opposite direction and the final swing will never come. Additionally, ADX may be slow to indicate the existence of a trend when it finally arrives, which again illustrates why trading this market is so risky.
Gold has been within this range now for 68 days. The longer price remains in this range the closer the breakout will be and the risker it is to expect the sideways swings to continue.
The weight of volume indicators is pointing to a downwards breakout as more likely. This is not definitive and only is indicative. Extreme caution is advised, particularly with any trades to the upside at this stage. The last two down days have completed on high volume, so volume continues to favour a downwards breakout as more likely.
If a new trend is developing, then Stochastics will no longer be useful and may remain oversold for much of a downwards trend.
Price is below the 21 day EMA. The two lower trend lines may offer enough resistance for downwards movement to continue from here. The bear Elliott wave count expects a downwards breakout may happen this week and this would fit with the regular TA picture, with the sole exception of ADX not yet confirming a new trend.
This analysis is published about 05:23 p.m. EST.
Sold the $15.90 JNUG that I bought in premarket for $17.73 after hours. I still have long positions, about 50% long (which is about< 5% of my portfolio).
Tham, thanks for the insights during the day.
Lara, you have a tough job! This correction might have a birthday coming it is taking so long…
IKR!
This last 70 days has been the absolute hardest time I have ever had analysing Gold.
The only thing which keeps me in it is knowing for sure this will end. It will break out.
I am so thankful to all the members who have stayed with me over this really tough period.
In the very short term I expect a little upwards movement to complete another second wave.
The bear wave count has increased in probability.
The only option now for the bull is to see intermediate (B) or (2) as a double combination drifting sideways. The invalidation point for that is at 1,131.09. More downwards movement would be required to complete the final wave C of the second structure in the double, it may only be a five.
The probability of a strong downwards breakout has increased.
The long lower wick on today’s candlestick and the decreased volume for today gives small cause for concern; it looks like a small upwards correction may be required to complete before the next strong downwards move is ready to begin.
Analysis today will take longer than usual, I’m still working on it. I may have more than one possibility at the hourly chart level for you to consider for the bear; so far I have a series of overlapping first and second waves, this is really common so should be the most likely scenario. Invalidation point 1,179.17.
The other possibility I want to look at (and need to do more work yet to see if subdivisions fit) is that subminuette wave ii is not over and is continuing as an expanded flat which will show up on the daily chart. We could see a green candlestick for Friday / Monday. Invalidation point 1,188.16.
It does look increasingly like the trend is now down. Any trades to the upside may be against the trend, which may not end well. ADX still does not show a trend yet, but it does usually lag.
$18 and $18.5 strike for GDX July 17th expiration both have over 20,000 puts open. I’m looking for a run north of $18.50, maybe up to $19 by July 16th/17th.
It could very well be a corrective bounce.
Lara is gold about to breakout downward or drift sideways for days?
Downwards is more likely.
Looks like it will POP in ‘c’ on Sunday
Seems possible. If Greeks vote no Sunday gold pops up (c wave) then banksters come back with better offer to Greeks, everyone is happy-market settles down, gold begins strong move down.
Gold hit low 2 minutes before huge negative payroll news market wasn’t expecting so gold jumped $11 in 32 minutes. Gold low was 1157.15 at 8:28 am. Two minutes before 8:30 news on US non-farm payroll.
Gold first dropped because the market thought the news would be very strong payroll results and positive for the US dollar and negative for gold like Wednesday 8:15 am ADP employment report. So 8:28 gold at low 1157.15 and 2 minutes later the 8:30 US news was very weak payroll results and US dollar down and gold up $11 and hits today’s high of 1168.54 at 9:00 am.
That is why I follow the bigger US news as it can surprise and change (or delay) Elliott Wave projection.
JUST A VIEW (Too new to know how the wave counts work): With 1168-69 curtailing and 1175 on the outside, a break below 1162-58-56 for 1149 looks inevitable…. ~!
High Lara,
Do you pay attention to the Wolf waves?
What do you think about the bull one with the target about 1230: http://invst.ly/pqh ?
Mikhail, that is interesting and seems legally EW possible. Looking at daily EW count gold could move back up to 1230 and still be undecided bear or bull.
Please show your wolf chart daily.
http://invst.ly/pra
http://invst.ly/prc
and one more: http://invst.ly/prk
What happened? Mikhail just posted a question to Lara along with a wolfe wave gold chart. I replied and now Mikhail’s post and chart are gone ???
I see them my posts with a comment “Your comment is awaiting moderation.”
Maybe this is because I edited them after posting?
Mikhail,
Might be some legal reason, copyright, trademark, etc etc that you can not post the chart. While waiting on webmaster decision would you post the site address and link for that wolfe wave chart? Also please send address and link to me via email (goldjackass@yahoo.com). I am interested to explore the wolfe wave concept .
Thanks
I’ll try to post them again.
invst.ly/pra
invst.ly/prc
and one more: invst.ly/prk
Just add h t t p : // in front of them.
This seems to be the reason of pre-moderation.
The comment was in moderation because it had more than one link in it.
Richard, I recall someone you follow says that when a 3x ETF like Dust gains more than 50%, he starts accumulating the inverse. We have gone from $11.07 on DUST to almost $20.
Ben I’ll check about that. Could be my super indicator guy. The other possibility was papurdi on this site may have mentioned a strategy like that?
It might have been Papudi, I don’t recall.
Further to my earlier posts today, I am glad that price dropped to as low as 1157.15, greatly favouring the bear count. If we take subminuette 2 as 1791.13, then subminuette 3 is proceeding very nicely as a 5-wave impulse down. 1157.15 was micro 1. I think we are now in the midst of micro 2 with submicro a over at 1168.83. (It is possible that that could be all of micro 2 but I can’t see a clear 3-wave structure, so I defer to a continuing micro 2).
Interesting perspective Tham
Just my 2 cents, I dont like that the down ward movement is choppy and
overlapping and that the upward movement seems so impulsive
The spike up at 8:30 worries me a little and the action thus far seems more like sideway correction…
Hi Patrick. I learnt from Lara that strong third waves usually begin that way. The beginning is slow and traders are indecisive (because they see the first and second waves as a continuation of the previous trend). Momentum gradually builds up into an explosive climax. To be on the safe side, I usually sit out until the second wave is over before I buy in.
There should be no doubt by now that the sideways movement has ended and that the trend is down. Moreover, this 3rd wave appears to be starting with a series of 1-2s.
I would just recommend that collectively we don’t keep looking for 2nd waves, because that is like trying to ‘catch a fallen knife.’ So far every 2nd wave has ended very quickly.
Meant to say ‘falling knife,’ because motion is in progress.
Thanks Matt for the advice. Like you mentioned below, micro 2 could have ended as a short violent spike.
Ya, on a 5 day chart, really looks as thought we are in ii of 3 of 5
iii of 3 should be quite powerful
Looks to me like we drift down all day and post Greece news, USD soars and Gold drops hard on Sunday night / Monday
Hi Tham
What are your thoughts here?
Looks like some sort of consolidation.
b before c up?
Hi Patrick. Apologies for not responsing earlier. I called it a night. (It is a 12 hours’ time difference here in Singapore) when I see the movement as being so very slow (since I was waiting for C to complete before entering a short trade). Lara has now answered the question. B completed while I was sleeping. C is underway, still not complete yet. Probably done by Friday or even on Monday. Sometimes, the gold market moves very slowly outside U.S. Market hours.
Hi Tham
This is scary for shorts (i.e. me). Where do you see submicro c over? I know. It depends where b ends but so far b down doesn’t look very convincing.
Thanks
Hi Johno. B waves are usually slow and hard to predict as there are many possible structures (Lara said 13). It may not have ended yet; it should be a 3-wave structure and I have counted only two so far. My best guess for the C wave to end is in the range of 1170 – 1175. This is because the 0.618 retrace of micro 2 is at 1170, the daily R1 pivot point resistance is at 1173 and the R2 is at 1175. R3 is at 1178 but TA dictates that it is extremely unlikely that it would reach there. I will take my shorts when price turns down from any one of these levels.
More than 13. If you include every possible double and triple combination, triangle, flat and zigzag then you get a total of 23.
It shouldn’t be scary if you ride the wave down. Simply add to a larger short position when there is a bounce. It is perhaps too difficult to find exact tops, but that exercise loses its significance as the wave matures; the spread between your overall position price and the actual price should be widing over time.
Sounds good, will start accumulating dust in the 1170’s, if we get there.
There is a clear three on a 5 min chart.
….and now on the hourly chart. Buyers beware!
Added some JNUG at $15.90 in premarket.
IMHO Gold price upside capping at 1174-81 with Gold price not likely to get past Wednesday H 1174.40 for further downside continuation, with the falling three methods in play, lucky if Gold price gets past 1168-69….
Simply loving this: Gold price has nose-dived for the dry docks, don’t see anything much above 1161-65 at this stage…. Oops~!
ANYONE have thoughts on what this means for the overall count?
Not loving this action so much…
No real clue right now myself
We now have confidence of bear count below 1162.80.
More confidence IF goes below 1142.82.
Full and final confidence of bear count IF gold goes below 1131.09.
Bull count less and less probable at each stage but still valid until gold drops below 1131.09 then bull count is history.
Thursday 8:30 am US Non-farm payroll
Wednesday 8:30 am ADP payroll data was strong and US dollar up and gold down.
Thursday it may happen again?
THURSDAY, JULY 2
8:30 am Weekly jobless claims June 27 275,000 271,000
8:30 am Nonfarm payrolls June 225,000 280,000
8:30 am Unemployment rate June 5.4% 5.5%
8:30 am Average hourly earnings June 0.2% 0.3%
10 am Factory orders May -0.5% -0.4%
Richard,
Thanks for sharing this with us. This is helpful. I thought the NFP report would be released on Friday.
NYSE is closed Friday July 3rd US holiday to celebrate July 4th Independence Day so Friday US data is being released Thursday July 2nd.
10 things they’re not telling you about the Greek crisis
http://www.marketwatch.com/story/10-things-theyre-not-telling-you-about-the-greek-crisis-2015-07-01?mod=MW_story_top_stories
HOURLY BULL IS INVALIDATED AND SUBMINUETTE II IS PROBABLY OVER.
Gold dropped down below 1162.80 to 1162.70 at 3:03 am as per http://www.pmbull.com so Hourly bull is invalidated and Lara will need to replace it.
Also Lara had mentioned in her video (7:20 to 8:00) that if gold dropped below subminuette i (1166.82 at 11:00 am June 30th) than subminuette ii would probably be over and part of her hourly bear analysis is wrong and if that happens then look out for a surprise to the downside. The surprise already happened with the Hourly Bull being invalidated.
The low I have is 1162.90.
I use pmbull. I have the previous low as 1162.83 and today’s low (so far) is 1162.70. For sound comparison purpose, we have to use consistent data from one single source, so to me there is technically an invalidation of the bull count as is.
Richard. I second that. There is one other possibility that I can see for the bear count, and it is that subminuette 2 continues as an expanded flat. The c wave rebound would then go slightly higher than 1182.
If subminuette 2 is over, and subminuette 3 is underway then no second wave correction may go higher than 1179.13, the beginning of that wave.
I guess I will have to monitor the bounce up and see where it lands. I think it ought to distinguish between these two scenarios. In any case, I will load up on DUST once the bounce completes.
I think the expanded flat is a good possibility. The key is micro wave a, is it a 3 or a 5? Lara has it labeled as a 5 based on the 5 min chart, but it sure looks like a 3 on the hourly.
It really does look like a five on the five minute chart.
If its a five it may have been a C wave to complete subminuette wave ii.
This is how I see it subdividing.
World’s best gold forecaster is solidly bearish on bullion
July 01, 2015 4:25PM EDT
http://www.theglobeandmail.com/globe-investor/investment-ideas/worlds-best-gold-forecaster-is-solidly-bearish-on-bullion/article25219273/?cmpid=rss1
Lara
In ongoing primary bull or bear discussion you recently answered several bull questions (can bull move below 1000) and described expectations / scenarios for possible bull wave.
Please consider a couple questions about possible primary bear wave:
(1) What is timeline estimate for bear to reach 950s target?
(2)How far (up) can the bear wave move in 2-3 years following a 950s low?
GDX dipped below and then closed on Lara’s daily invalidation point for the bull count @17.29. Looks like GDX is leading Gold down. Final invalidation for the GDX bull count is likely @16.24, the low back in Nov 2014. GDX broke below an important trend line this week. While we may get a brief backtest in the next day or so, the trend is down.
Weekly trendline break. We may get a brief backtest before heading down hard.
Dreamer
Remember that Lara has advised that GDX analysis is not as accurate as gold due to the fact that gold has much greater volume and follows EW by the book, but GDX doesn’t have enough volume so not as accurate, and when in doubt remember Gold is the king and and in charge. GDX invalidation doesn’t mean anything for gold.