
Previous analysis warned of possible swift strong fifth wave extensions to end a third wave.
Last analysis also stated that when price broke below the lower edge of the green channel on the daily chart, then an increase in downwards momentum was expected. That was exactly what happened.
Summary: Downwards momentum still needs to show an increase beyond that seen for minor wave 1. This structure is incomplete; the trend is still down. Use the lower green trend line on the daily chart and the upper violet trend line on the hourly chart to show where price may find resistance. The next short term target is at 1,060. The target for the next multi day interruption to this trend is now at 1,023.
To see weekly charts click here.
Changes to last analysis are bold.
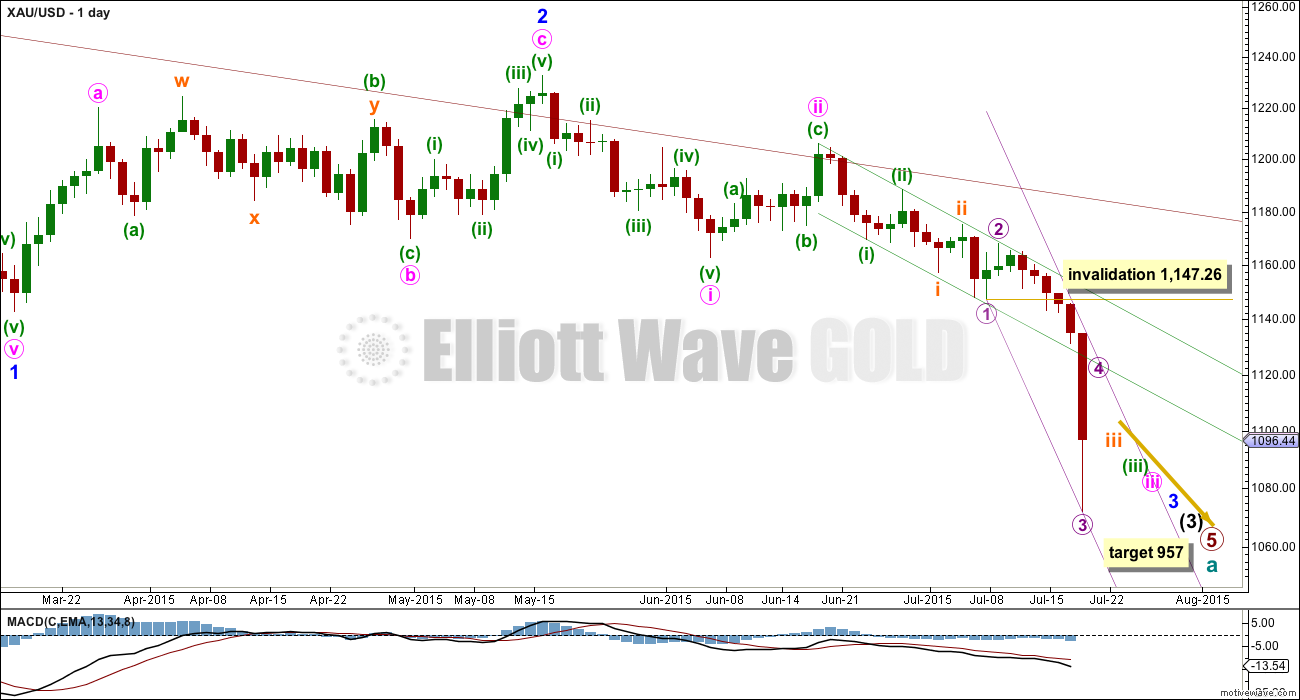
DAILY ELLIOTT WAVE COUNT
Click chart to enlarge.
Cycle wave a is an incomplete impulse.
Within primary wave 5, the daily chart focuses on the middle of intermediate wave (3). Within intermediate wave (3), minor wave 3 has yet to show an increase in momentum beyond that seen for the end of minor wave 1 at the left of the chart. This is why I still expect to see more downwards movement to show a further increase in downwards momentum.
I now have full confidence in this wave count with a new low below 1,131.09. This confidence is based upon seeing a prior upwards movement as a five (I cannot see a solution where this is a three). Because this has always been the crucial aspect to my wave count, I publish this piece of movement below with a short explanation.
Draw a base channel about minuette waves (i) and (ii) as shown (green trend lines). If the steeper violet channel is breached then look for the lower green trend line to provide resistance. Only if the upper green line is breached would I consider the wave count to be wrong.
Draw a best fit channel about subminuette wave iii as shown (violet lines) and use that channel on the hourly chart.
Micro wave 4 (if it continues further) may not move into micro wave 1 price territory above 1,147.26.
At 957 primary wave 5 would reach equality in length with primary wave 1.
Click chart to enlarge.
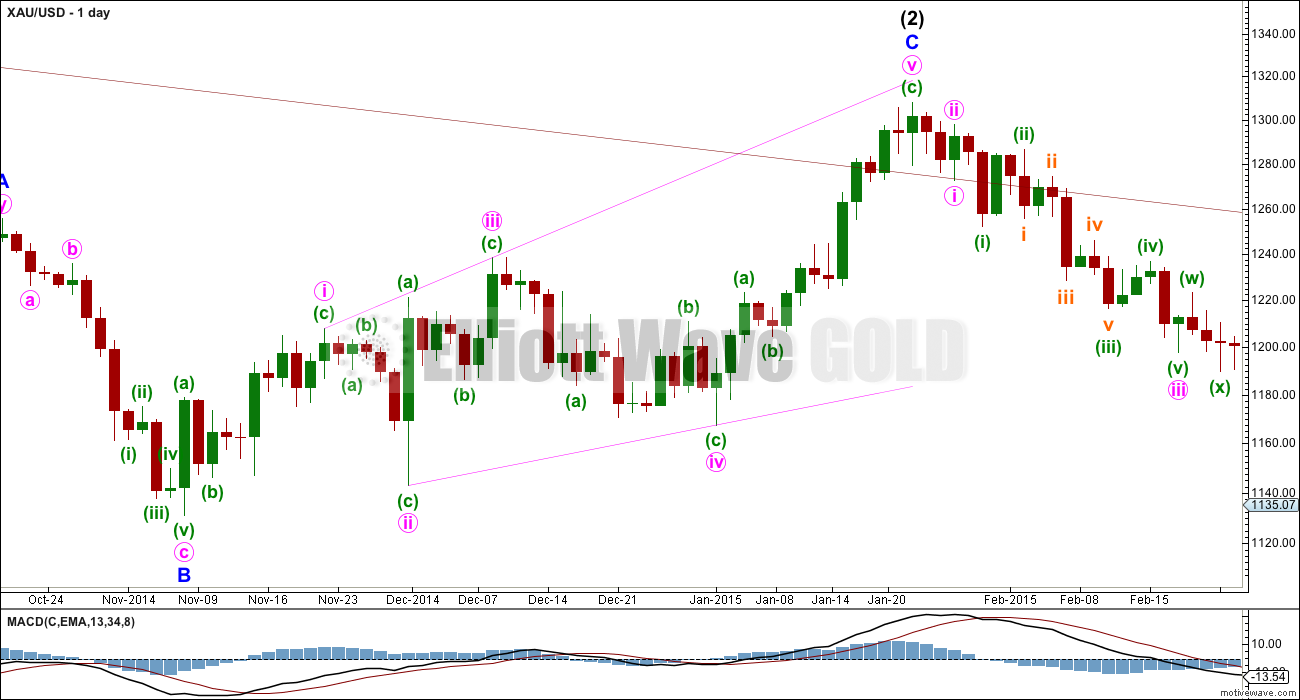
Any bullish wave count at this stage must see cycle wave a over at the low of 1,131.09 (labelled minor wave B on this chart). The first move up for the new bull trend would be this five wave expanding diagonal.
Because the first move up subdivides as a five that means a B or second wave correction may not move beyond its start below 1,131.09.
For any bull wave count to remain viable this upwards wave must now be seen as a three (because when an A wave subdivides as a three the following B wave may move beyond its start).
I have considered all possible corrective structures for this upwards movement. The only possibility which fits and meets all Elliott wave rules is one of the rarest structures, a triple zigzag, but it would look all wrong. Each zigzag in a multiple exists to deepen the correction, but for this idea the second zigzag would barely move beyond the first, and the X waves would be too deep. Where a triple zigzag looks all wrong an ending diagonal looks all right, fits perfectly, and is a much more common structure.
I have concluded that this wave up is an ending expanding diagonal. Which means that with a new low below 1,131.09 any bull wave count should now finally be put to rest.
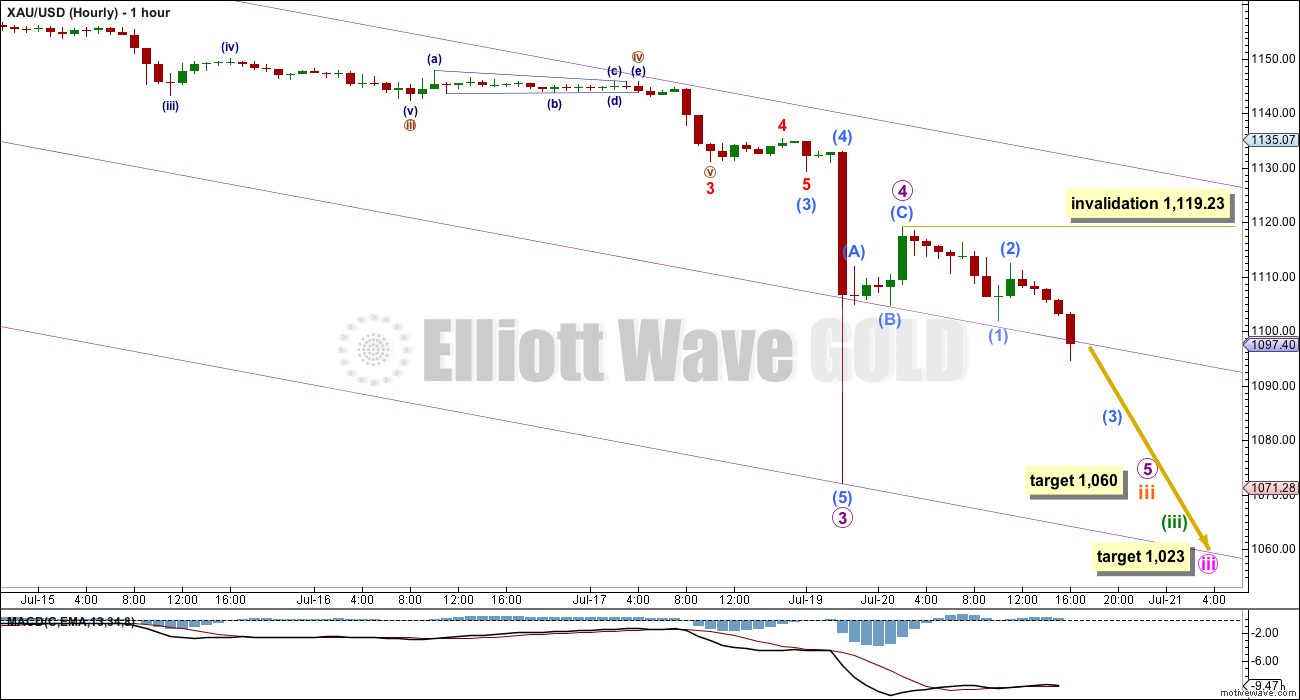
HOURLY ELLIOTT WAVE COUNT
Click chart to enlarge.
Gold often exhibits swift strong fifth wave extensions, and they usually turn up to end its third waves. That was exactly what happened yesterday to end micro wave 3.
To end one or both of minuette wave (iii) and minute wave iii, there may be another one or two swift and strong fifth wave extensions. This may be more sustained to increase momentum at the daily chart level.
There is no Fibonacci ratio between micro waves 1 and 3. This is important and means that micro wave 5 is more likely to exhibit a Fibonacci ratio to either micro waves 1 or 3. At 1,060 micro wave 5 would reach 0.618 the length of micro wave 3.
Submicro wave (5) to end micro wave 3 was a swift strong extended fifth wave. Sometimes when a movement is “too far too fast” a fifth wave truncation turns up. It is possible that my target of 1,060 is too low. It is possible that micro wave 5 may be truncated. This is not something that we should expect to see, but it is a possibility to be aware of in this case. When micro wave 5 is a clear five wave structure it may be over, whether or not price reaches the target.
Within micro wave 5, submicro wave (2) may not move beyond the start of submicro wave (1) at 1,119.23 (this invalidation point allows for the possibility that my labelling of micro wave 5 is one degree too high).
At the daily chart level, micro wave 3 now has a curved look to it (very typical for Gold’s third waves). We may see this curved look for one or more of subminuette, minuette or minute degree third waves too.
For now I will focus on looking for the end of subminuette wave iii. When subminuette waves iii and iv are complete, then I will use multiple degrees to calculate the target for minuette wave (iii). I will not provide a target again for it until I can do so at more than one wave degree.
When minuette waves (iii) and (iv) are both complete, then the target for minute wave iii to end may be recalculated and may change. For now I can only calculate that at one wave degree.
Create a mid line to the violet parallel channel. Price has been finding some support at this line. When it is breached look for that mid line to provide resistance.
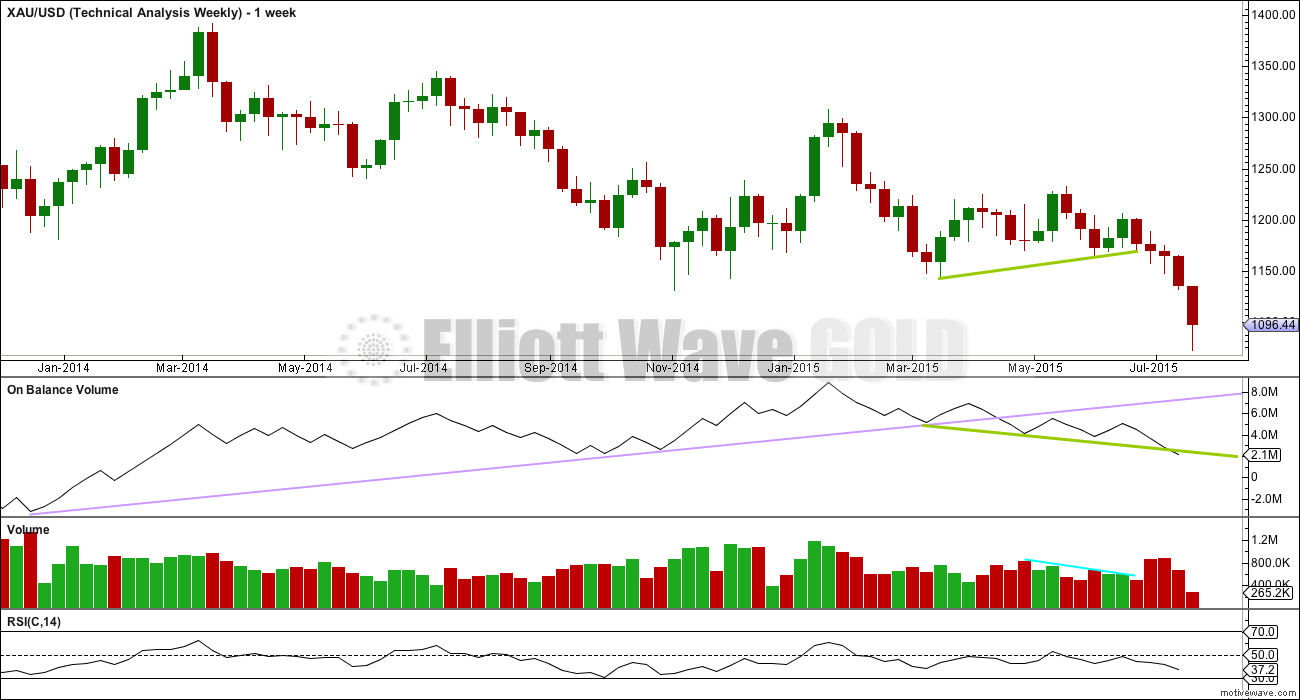
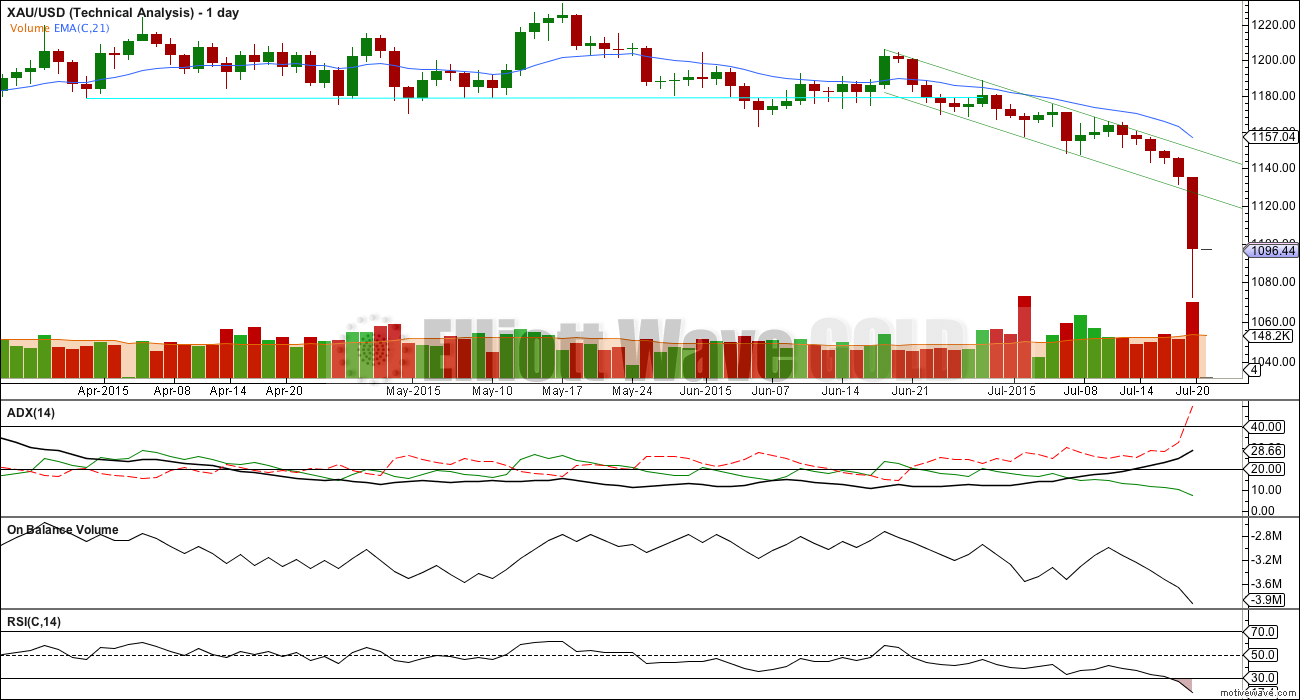
TECHNICAL ANALYSIS
Click chart to enlarge.
Weekly Chart: The lilac trend line on On Balance Volume has been breached, which is a longer term bearish indicator.
OBV is now breaking below the shorter green trend line, another bearish indicator.
Volume for recent downwards weeks has shown an increase which comes after the consolidation showed a typical decline in volume as it matured.
RSI is usually a fairly reliable indicator of lows. At the weekly chart level, RSI is well above 30 indicating there is room yet for Gold to move lower.
Click chart to enlarge.
Daily Chart: What is quite stark on this daily chart is the strong volume for Monday. This strong downwards movement was supported very well by volume. There is nothing suspicious about it.
Sometimes a spike in volume on a day where price moves strongly in the direction of the trend indicates an end (at least temporarily) to that trend. I have looked back at primary wave 3, which ended on June 2013, and during its end there were a few volume spikes on strong down days. Not all showed a temporary end to the fall in price. The biggest on 20th June, 2013, was followed by a new low the next day and then four more red daily candlesticks.
What is very clear though as a difference between those volume spikes and this one today is RSI: for each volume spike within primary wave 3 that was at or very near the end of a downwards wave, it came with RSI indicating comfortably oversold. Today RSI is now comfortably oversold, but each price low within the ends of third and fifth waves during April and June 2013, also saw divergence between price and RSI. Today there is no divergence.
A correction may be expected soon, but not quite yet.
This analysis is published about 05:52 p.m. EST.
Lara as gold continuing down below $1,100 from now on?
Or a bigger bounce up Wednesday?
It has to keep going down, the structure is incomplete.
It still needs to complete the ends of three third waves; subminuette, minuette and minute before it’s ready for a multi day correction.
The target is still at 1,060.
If I’m wrong and it does bounce up I’d expect the upper edge of that violet channel on the hourly chart to provide resistance.
More of a ‘hope and prayer’ rather than expectation…
However…
Anyone see a bullish case for miners?
Currently holding an ungodly sum of NUGT at $9… Advice appreciated.
Post a comment to Lara, How high might gold bounce up from minute iii at 1023 i.e. up to 1100?
Lara just wrote off the Bullish possibiity yesterday.
Can you afford to hang on to it until the end of the year? However it might drop completely to zero by then with GDX dropping to $12 and the daily admin service charges which may be 3 % monthly.
Sell sooner when in loss to Cut your losses early.
I’m expecting gold to drop to minute iii at 1023 then bounce however how much is unknown.
I would of sold it at it’s high today as Lara warns that each day usually the gold high won’t be seen in awhile meaning gold would continue lower except for a few retracements.
I would at sell at least some of it today.
Good luck.
Look at daily charts covering major oversold conditions from 2008 through this year (RSI and crosses below lower Bollinger Band for example). Look for when volume rises and to what extent the miners stop going down before the low in gold. You will be upset if a great bounce starts right after you sell. You will also be upset if the bounce starts at a much lower level and does not get up to today’s $9.
Proper procedure is to reduce your leveraged exposure to a reasonable level and then watch for new entry point…easier said than done perhaps.
Wow, I have no advise on this trade, but in the future
if you form your strategy with this list of mistakes in mind,
you will never suffer a large loss again. This list has
helped me over the years. When I enter a trade
I expect to have small profit within minutes and then
use entry point as stop. If not up within 5 minutes I sell
because my entry point was wrong! My strategy was wrong!
The mistake family
1. Holding a loss over night
2. Averaging down a losing position.
3. Deviating from trading strategy,
failure to wait for the proof
4. Revenge or emotional trading
5. Trying to hit a home run
6. Failure to look at the big picture,
for the bottom line
7. Take quick profits, holding losses
8. Failure to diversify
9. No set routine
10. Trading funds you can’t afford to loose
I have been guilty of all these mistakes over the years,
they say repeating the same mistake over and over is the
definition of stupidity. I keep this list on my desk for
those times I’m thinking of doing something stupid.
I think the hardest thing for any trader to do
is view the market with fresh unbiased eyes every night.
That is where Lara excels and helps me revise my strategy
for the next day, I still stuggle with taking profits to
quickly. Syed and Tham have been very helpful in keeping
my finger off the sell button, and pick an inteligent exit
point.
Good Luck
Every time a trade is entered a clear exit strategy must be devised BEFORE you enter the trade.
At which point do you know your analysis is wrong? What would price need to do to show you the market is not behaving as you expected?
Calculate how far away from entry the stop should be using either an EW invalidation point, a trend line, or a money management stop. That is your risk.
Calculate the potential reward. Now you have the risk : reward ratio. Is it good enough for a trade to be taken?
Finally, the hardest biggest rule, do not risk more than 2% of your equity on any one trade. If where you need to place your stop means your risk is more than 2% of your account then reduce leverage / position size until it is.
The Theory Of Runs means keeping risk to no more than 2% of equity per trade allows for 10 losing trades in a row before you make a profitable trade will see your equity preserved. In other words, it prevents your account being wiped out.
Sorry for the loss. We’ve all been there. You likely won’t see NUGT that high until early 2016 after it goes much lower first.
Never fall in love with a trade, especially 3x etf’s. When a trade goes against you, you need to sell and cut your losses much sooner. Capital preservation is key so that you can continue trading. Since Lara’s analysis points to much lower prices, best to sell now.
Trade with the trend (down) for now, DUST, then get back in NUGT after we bottom later this year. With all of the 4th waves coming up, the easy money on DUST has likely already been made. Over the next several months until we bottom, you’ll need to be nimble as there will be much choppy movement. Good Luck.
I do not expect a bounce up for Gold until after it’s made a new price low.
The short term low may not happen for another several days, maybe as many as six.
I know that’s not what you want to hear for your trade.
But remember also, the wave count for NUGT will be different to Gold. I do not have a wave count for NUGT. It probably does not have enough volume for a reliable EW analysis (GDX doesn’t so I don’t place a lot of weight there on EW analysis).
Aidan, I don’t know if you are still holding your trade.
My heart sank when I saw your post. And I wanted to respond.
I know the feeling(s).
I’ve seen some good suggestions on here.
I like what Fencepost had to say about if you sell now. The way I see it is that once you sell you are cutting your capital no if ands or buts– by more than about 1/2. Done, its over. And I have kicked myself many times to see that if I had only had a broader perspective, several weeks later, a month even, I would’ve turned to profitable.
Don’t like the cut-your-loss mantra when you’ve obviously gone way too far. Sometimes we go till the security itself is ready to turn, like fencepost said. Cut-your-loss is effective in the way Lara describes trading. Its meant to be like she said, pre-determined. (though I personally have my account set up to use any and all funds, not just 2% as Lara does – guess I’m not rich enough yet- lol)
If you are going to sell now, in-the-money options don’t offer much of a solution.
Gold will rise again – if Nugt doesn’t go out of business first (sorry, not meaning to be so pessimistic). And Gold will rise majorly at the end of primary 5/cycle a (though it will then be wave b which per Lara are the most difficult to analyze).
You do have choices.
Pretty sure my response on money management at this point in time will not be the “appropriate” response according to good money management but I still wanted to comment.
When I messed up and allowed price lower than my comfort zone I was day trading out of it. I’m novice but studied. I did not paper trade (practice) at first, and I miss entries and exits. However, I do trade one thing at a time – like Gold/DUST to not be distracted– keep informed about all kinds of influencing factors (ie: USD, Grexit, FOMC rate hikes, China? etc). And trade with the trend. << probably the most important. And I have recently changed the way I buy into a trade. [continually improve upon your trading!]
If a trend is identified solidly (not bottomy or toppy) and I just made a poor entry in the past, when I got too far out I day-traded out. My initial philosophy like many people was take no losses – because the purpose of the money I'm using is ONLY to make more money; and I MADE myself learn how to unwind a bad trade. People would say I'm risking too much capital, doing many of the “wrong” things. If you want to prove you can do it the way you want to it will take work on your part. I am also taking more and more notice of conventional wisdom. Because much of the time and energy I spent day-trading the little trades took so much time there was better strategies out there – like buy the opossite security – or even a different security. But I’ll go on…
After several loosing trades I changed my buy strategy: to open with 100 shares only(for example) until I could be consistently profitable. If I’m wrong I’ll know fairly soon and I get out. (sounds like Lara) If I’m really really sure of myself I’ll start my positions with a maximum of only 1/2 of what I intend to use in the trade to allow me for a later buy in. That other 1/2 allows me money to work with if I bought poorly. I started obsessively learning to TIME the trade so that I could have that cushion to ride on. I LIKE having that cusion. (I’ve become habitual at wash sales!)
But I must say this recent change of limiting my initial buy-in and forcing stop-losses helped immensely. I only risk large “ungodly” sums (as in allin) on a sure thing. A while ago gold’s bullish movement was completely nullified and we had a “sure” thing of deep price movement lower. And to compensate for my riskier amounts I do not trade countertrend purposely (which Nugt would be right now). Using a second buy in has worked for me– immensely.
Don't get me wrong. I’m exiting trades before it turns unprofitable, but I’m still working on pulling out at a better price. As a rule I always set my exits to include the cost of the trade itself. The past 4 trades were profitable. The two before were losses (minute –or I should say teeny tiny size losses). This Friday’s sale had me at 47% return on my capital. My first, biggest take down. (Only because gold is in a trend!) And I am grateful – I got mad enough to keep pushing!
With Nugt being so far down from your buy in AND the current trend being confirmed down I can not conceive if day trading within this security is really a possible tactic. I imagine anything is possible if you stick with it long enough but this is still a big down trend. I do not think there would be any money in in-the-money options if you were to purchase them to then sell shares. I do not know if you have funds to position yourself in Dust or Jdust while the downward move continues to compensate. I seem to think that you will find a way, that you can deal with this.
If cutting your capital & releasing the heavy burden of kicking yourself is your choice you will have remorse after. You will need to decide for yourself that you no longer want to feel that way. That you must change your actions “at market” because you no longer want to be loosing money AND you no longer want to feel bad about yourself. You could decide to no longer feel bad (or kick yourself) while holding the shares. It is possible. It is possible. It’s a matter of deciding the action to take and deciding that you will not berate (nor ectstaticize <>) yourself but feel good that you made the best decision you could under the circumstances. No longer feeling bad about yourself is separate from the shares profitability.
You’ll have to let the trade go sometime. Its up to you to decide how you want to feel about it.
🙂
Just added JDST at $13.94. Also added DGLD yesterday at $87.50.
Great price
Thanks, small positions as I am waiting for the next larger bounce.
If next big bounce is at 1023 then how high might gold bounce then?
Any wave count?
Hi Richard. The broad picture is that we are in micro 5. Lara gave the wave count as 1119.21 – 1101.96 – 1112.45 – ? – ? – 1060.
I have a slightly different version 1119.21 – 1094.53 – 1109.99 – ? – ? – 1060. After the long consolidation (nested 1-2-1-2) we seem to be finally moving downwards. If I am correct, momentum should increase from this point forward. We are in submicro 3 miniscule 3. My target for submicro 3 to end is 1070.
Actually, I feel that it is more productive to count the waves for DUST rather than gold since the down move calls for trading DUST. Unfortunately I cannot find anyone that analyses DUST, so I have to rely on my own count. In my EW analysis, the large fall in DUST this morning is a second wave correction of the run up towards 35.56. At 29.79, the correction is a 0.236 retrace, and I hope the retrace doesn’t go higher (for selfish reasons as I bought DUST this morning). This may work out as DUST is now in a third of a third. The lowest DUST dropped to was 29.57. If I am correct, DUST will begin its ascent from here. My target based on my EW analysis of DUST is 93.82 (its third wave) when gold hits bottom for Cycle Wave A at 957. If I am correct, that represents a more than 300% gain.
Do note that my count for gold wave degrees lower than micro will be one degree higher than Lara’s.
The reason I posted my analysis of DUST is that although DUST has a quite a strong inverse correlation with gold, both have their own wave counts. That was why gold price hardly moved yet DUST fell substantially. To quote yourself, “Gold up $11.50 since close and DUST down $5.40 to $30 at 10:15 am.” So, gold rose 1% while DUST fell more than 16%.
Tham, very nice DUST analysis, thanks.
Tham, seems to me that it”s better to analyze a 3x etf by analyzing the base etf, i.e.GDX. With GDX into 4th waves, DUST should be in 4th waves also.
Thanks Tham, where do think 1060 will put dust at, estimated of course?
It is hard for me to count down to the smaller waves. I only have a daily chart of DUST with sufficiently long timeframes.
I defer to Lara’s wave count. Hers fits better with the current movement.
Tham, my calculations are that GDX would need to get down to approximately 5.37 for DUST to hit your target of 93.82. Lara has stated that her GDX target may be too high, but right now her target is 11.22. Respectfully, I think your DUST target is too high. Bob
93.82-32.76=61.06
61.06/32.76=1.86
1.86/3=.62, so GDX needs to fall 62%
14.12*.38=5.37
Tham, I so appreciate seeing your analysis of DUST on EW. It has helped calm me immensely. I’m not quite sure I believe that EW works on the 3x etfs though. Are you finding that it does? I mean EW should work on everything — but these etfs have the deterioration effect. Anyway just wanted to say thanks.
I am considering switching to Silver (DSLV) during this pause. Lara’s EW possible (rough) targets indicate: Gold -15%, GDX -20%, Silver -60%
Anyone looking at Silver (DSLV) which if downside targets met, could show a 180% gain ?
Someone I know has 1000 shares of DSLV bought awhile back and holding for a lot longer.
I have traded DSLV before in the past. The volatility is much higher than the gold ETFs. Also, the daily volume is fairly low compared to gold ETFs. This means two things. Firstly, the bid/ask spread is very much higher. Secondly, it takes a long time to buy or sell. It may be OK if you buy only 100 shares, but anything beyond 1000 takes forever to buy / sell. In the meantime, the price may change drastically. These are my experiences and I have switched over to gold ever since.
Tham, thanks for input, I believe you are correct, must scale in and out of DSLV carefully. If Lara EW targets are close to correct GDX will fall another 20 % Silver another 60% which motivates me to manage in and outs of DSLV.
Do you agree with current EW Silver target of approximately 5 ?
It is entirely possible to have a target of 5 for silver. But, I much prefer the higher target of 11+. This is because the drop at supercycle degree is in three waves, and the current drop is only the first. So, on 5 what will the third wave yield? I doubt if it would be a truncated wave.
I
Gold prices struggle to recover from an eight session loss
July 21, 2015 10:21 a.m. ET
http://www.marketwatch.com/story/gold-silver-trade-near-five-year-lows-in-asia-2015-07-21
Victor Thianpiriya, a commodity strategist at ANZ Bank, said gold could test $1,000 in the near term, a level at which several mining companies might find it difficult to profit from extracting the commodity.
Gold up $11.50 since close and DUST down $5.40 to $30 at 10:15 am.
I did buy a little today at $30.662. Will watch for even lower to buy and hold for drop in another day or so to subminuette wave iii target at $1060. Thanks dspospering for your caution late Monday about DUST dropping you were right.
You’re welcome. Sorry couldn’t respond sooner.
I have updated GDX today. I will not update Silver yet because it does not change from last analysis, particularly targets, they are the same.
Thanks a lot Lara for the GDX update this morning.
Thanks Lara–you answered my silver question.
Thank you.
The Gold Tree
Aden Sisters cycles chart
Gold Points Lower to $927 As Bearish Descending Triangle Triggered
By Bruce Powers, CMT of MarketsToday.net
Monday, July 20, 2015 10:25 AM EDT
http://www.talkmarkets.com/content/global-markets/gold-points-lower-as-bearish-descending-triangle-triggered?post=69351&utm_source=taboola&utm_medium=referral
HUI triangle breakdown also from Kimble charting
What an amazing day! NUGT is going to need a reverse split soon.
Dreamer a Legendary day!
Just imagine when gold sector is in bull trend and miners are buy and hold!!!!!!
After November and 2016 will be more impressive!!!
You’re right, the move off the bottom will be explosive!
Yes start of new bull run will be great this fall?
The earliest date for the bottom in gold could be October 2015. If the drop drags on, the bottom may be in only next year.
In any case, since the drop in gold has lasted so long, I would expect a V-shaped recovery off the lows. However, the rise will not be dramatic, probably only a 0.618 retrace of the drop from 1921 to 957.
Thanks for the forecast Tham.
Lara I see a daily chart for October 2014 to February 2015. I figured out that we can put it beside the March 2015 to July 2015 daily chart for an extra long daily chart and be able to compare the run up to the November 7th low of 1131.09 with the run up to today’s low of 1071.28. Great idea.
dspospering, I don’t have any DUST.
After market close I just reread your comment and checked http://www.stockcharts.com multiyear chart on DUST and yes DUST is sky high and looks like it’s ready to topple. In fact RSI is at the highest ever at 90.56 a two plus year high. A warning of a pending correction in DUST. I may hold off for a gold correction before buying DUST although I could kick myself for not having been in it today. Good news is I didn’t lose any money today, LOL.
I’d got a new trading platform setup that I like, now I have to put aside the fear to buy up to the point when gold looks like it’s dropped forever and DUST due for a big drop. This high speed gold dropping and DUST rocketing is so different from the almost 3 months of trend less Gold.
Lara’s Technical analysis below discusses that gold RSI now being oversold is different that it was in 2013 as now there is no divergence between price and RSI. That is reassuring.
Perhaps I’ll watch DUST closely Tuesday and may trade intraday but sell before day end so no overnight surprises. However overnight has been profitable lately, so live and learn.