
Since yesterday’s Elliott wave analysis, price has moved lower slowly.
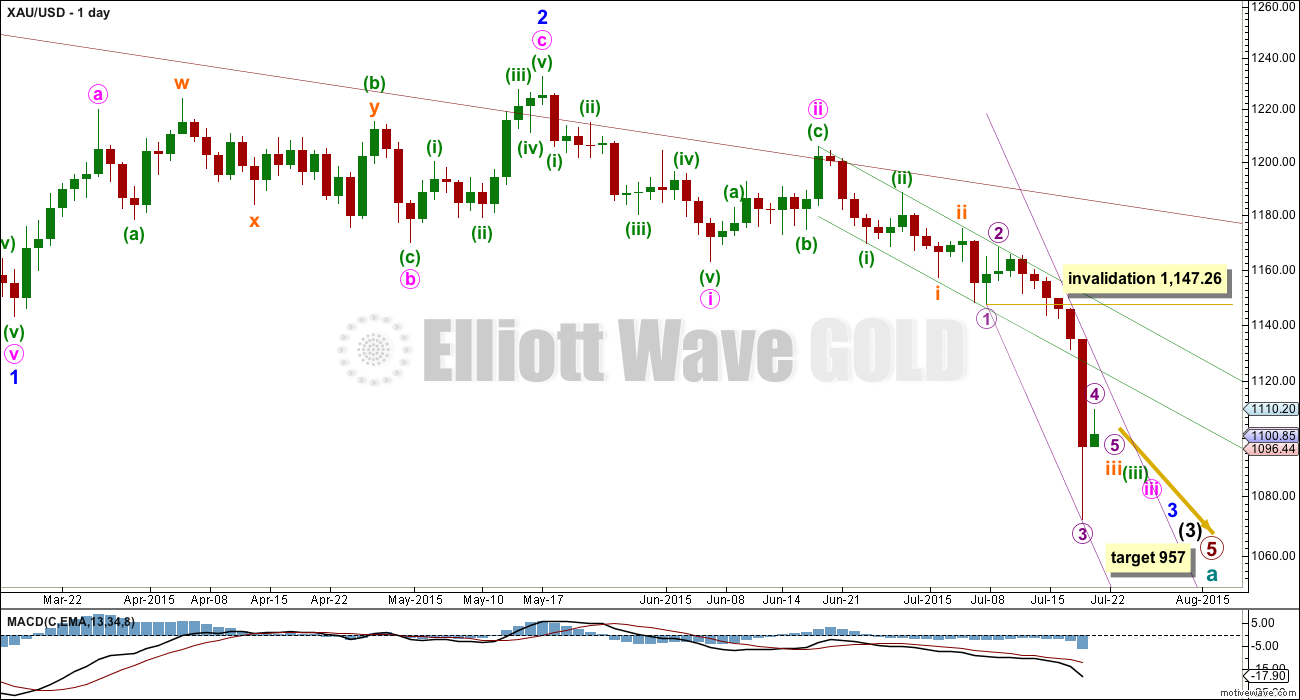
Summary: The target for the next third wave to end remains at 1,060. The following fourth wave may show on the daily chart, but it may not. The target for minute wave iii to end remains at 1,023 and a multi day correction is still expected to arrive about there. Downwards momentum still needs to show an increase at the daily chart level for the wave count to have the right look.
To see weekly charts click here.
Changes to last analysis are bold.
DAILY ELLIOTT WAVE COUNT
Click chart to enlarge.
Cycle wave a is an incomplete impulse.
Within primary wave 5, the daily chart focuses on the middle of intermediate wave (3). Within intermediate wave (3), minor wave 3 has yet to show an increase in momentum beyond that seen for the end of minor wave 1 at the left of the chart. This is why I still expect to see more downwards movement to show a further increase in downwards momentum. The strongest downwards momentum may turn up in a fifth wave somewhere within minor wave 3, maybe the fifth wave to end minute wave iii or that to end minor wave 3 itself.
Draw a base channel about minuette waves (i) and (ii) as shown (green trend lines). If the steeper violet channel is breached then look for the lower green trend line to provide resistance. Only if the upper green line is breached would I consider the wave count to be wrong.
Draw a best fit channel about subminuette wave iii as shown (violet lines) and use that channel on the hourly chart.
Micro wave 4 (if it continues further) may not move into micro wave 1 price territory above 1,147.26.
At 957 primary wave 5 would reach equality in length with primary wave 1.
HOURLY ELLIOTT WAVE COUNT
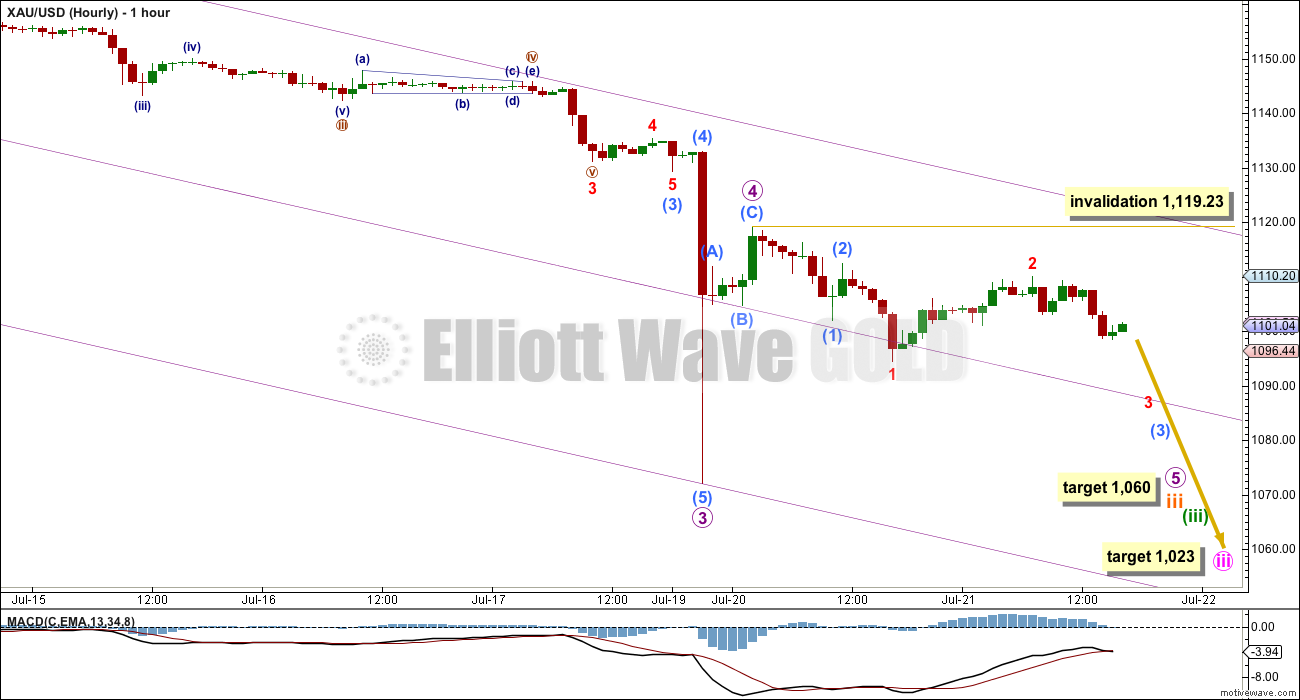
Click chart to enlarge.
Gold often exhibits swift strong fifth wave extensions, and they usually turn up to end its third waves. We saw this to end micro wave 3. It is entirely possible, and should be expected, that it may happen again to end one or more of subminuette wave iii, minuette wave (iii), minute wave iii, minor wave 3 and maybe even intermediate wave (3).
There is no Fibonacci ratio between micro waves 1 and 3. This is important and means that micro wave 5 is more likely to exhibit a Fibonacci ratio to either micro waves 1 or 3. At 1,060 micro wave 5 would reach 0.618 the length of micro wave 3. This fifth wave down for micro wave 5 will complete subminuette wave iii impulse. So far subminuette wave iii has lasted eleven days and may end in two more days to total a Fibonacci thirteen.
Submicro wave (5) to end micro wave 3 was a swift strong extended fifth wave. Sometimes when a movement is “too far too fast” a fifth wave truncation turns up. It is possible that my target of 1,060 is too low. However, at this stage, micro wave 5 is incomplete and looks like it has begun with two overlapping first and second waves. It looks like the five wave structure of micro wave 5 needs enough room to the downside to unfold which should see it move below the end of micro wave 3 at 1,072.09. The target at 1,060 looks to be quite reasonable.
Within micro wave 5, submicro wave (2) may not move beyond the start of submicro wave (1) at 1,119.23 (this invalidation point allows for the possibility that my labelling of micro wave 5 is one degree too high).
At the daily chart level, micro wave 3 now has a curved look to it (very typical for Gold’s third waves). We may see this curved look for one or more of subminuette, minuette or minute degree third waves too.
For now I will focus on looking for the end of subminuette wave iii. When subminuette waves iii and iv are complete, then I will use multiple degrees to calculate the target for minuette wave (iii). I will not provide a target again for it until I can do so at more than one wave degree.
When minuette waves (iii) and (iv) are both complete, then the target for minute wave iii to end may be recalculated and may change. For now I can only calculate that at one wave degree.
Create a mid line to the violet parallel channel. Price has been finding some support at this line. When it is breached look for that mid line to provide resistance.
At 1,023 minute wave iii would reach 2.618 the length of minute wave i. Minute wave iii has now lasted 23 days and its structure is incomplete. If minute wave iii totals a Fibonacci 34 days, then it may end in another 11 days. If that expectation is wrong, then minute wave iii may be too long, may not exhibit a Fibonacci duration, and may end quicker than this.
TECHNICAL ANALYSIS
Click chart to enlarge.
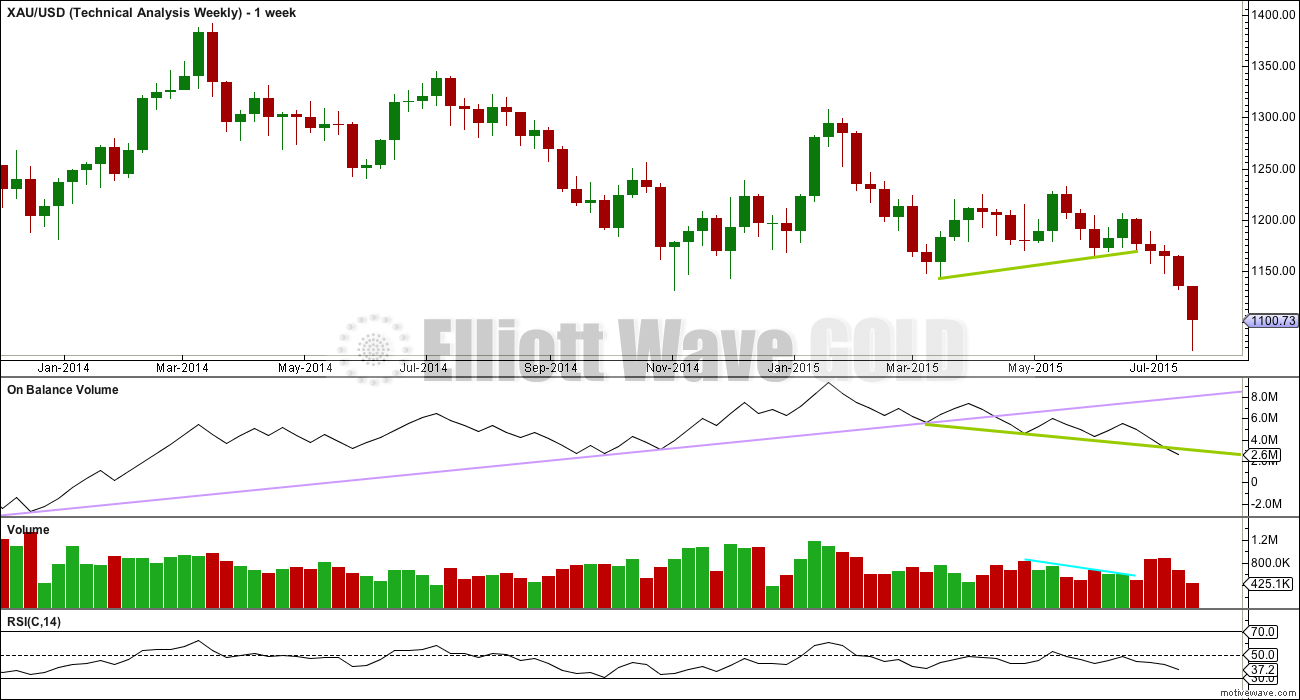
Weekly Chart: The lilac trend line on On Balance Volume has been breached, which is a longer term bearish indicator.
OBV is now breaking below the shorter green trend line, another bearish indicator.
Volume for recent downwards weeks has shown an increase which comes after the consolidation showed a typical decline in volume as it matured.
On Balance Volume has this week breached the shorter held green trend line, another bearish indicator.
RSI is usually a fairly reliable indicator of lows. At the weekly chart level, RSI is well above 30 indicating there is room yet for Gold to move lower.
Click chart to enlarge.
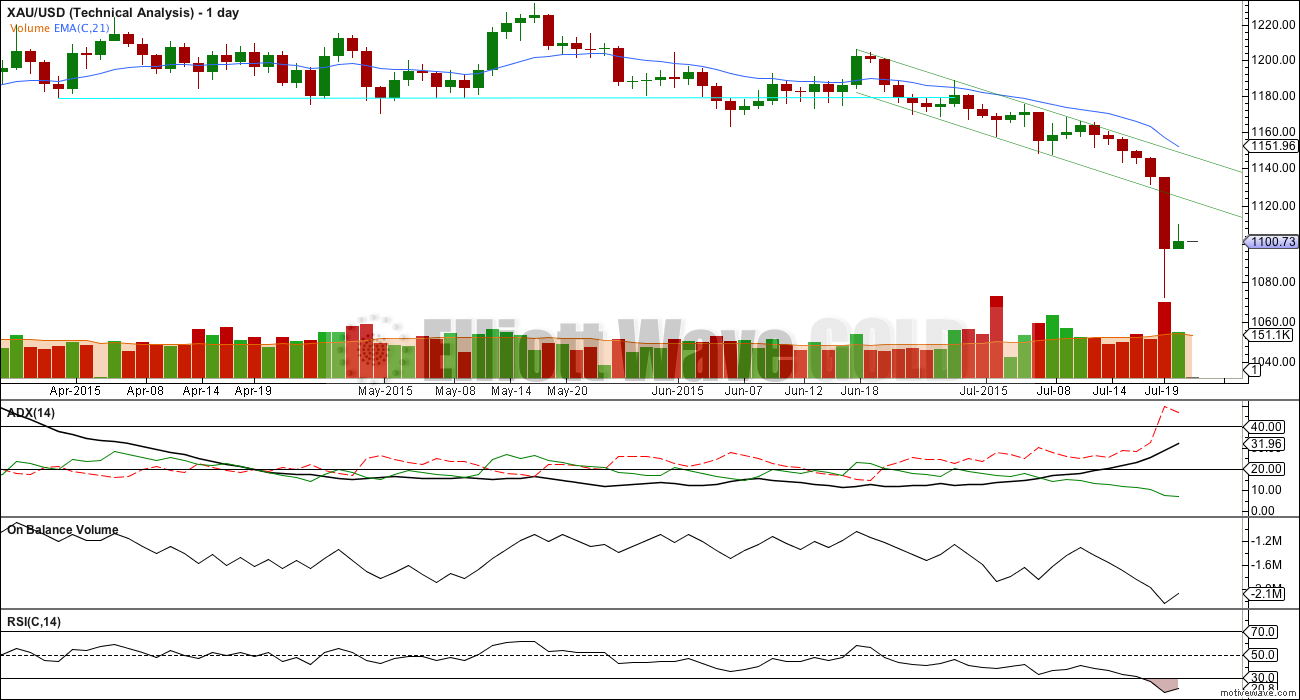
Daily Chart: What is quite stark on this daily chart is the strong volume for Monday. This strong downwards movement was supported very well by volume. There is nothing suspicious about it.
I have looked back again at the ends of third and fifth waves within primary wave 3 during April, May and June 2013. During that downwards movement there were a few strong down days with volume spikes, similar to what we have seen this week for Monday. Each time this happened it was not the temporary price low. A brief discussion of some of those important down days follows.
The strong days of 12th and 15th April, 2013, (a Friday and Monday, so consecutive trading days) saw one more day down after that to reach the low on 16th April. At the low price diverged with RSI: price made a new low while RSI turned up. That low ended minute wave iii within minor wave 5 within intermediate wave (3) within primary wave 3.
There was a series of strong down days culminating in a volume spike on 16th May, 2013. The price low happened the following trading day on 20th May and was again seen with divergence between price and RSI on that day. That low ended a truncated fifth wave (the third wave prior was the strongest move; too far too fast) for minor wave 5 within intermediate wave (3) within primary wave 3.
The strong downwards day of 19th June, 2013, was impressive with a price range of 27.65 for the day and the strongest volume spike of them all at 124.9K. But that was not the end of the fall. The low came six days later on 27th June 2013. Only that last day with the final low for primary wave 3 saw a divergence between price and RSI. The final day also produced a new low but a green candlestick and a strong bullish engulfing candlestick pattern. That was the end of primary wave 3 and the start of primary wave 4.
With this analysis we should expect the pattern to be repeated again within primary wave 5. At the price low for yesterday’s strong downwards day to 1,072.09, there is no divergence between price moving lower and RSI also moving lower. The short term / mid term low may not be seen for another one to five days yet. This analysis fits nicely with the Elliott wave count and potential Fibonacci durations (with the exception of another eleven days before the low for minute wave iii; another reason that duration may be too long).
A correction may be expected soon, but not quite yet.
Today’s small green candlestick has a long upper wick and a shaven bottom. The long upper wick is slightly bearish; the bulls have tried to push up price but have been unable to hold it very close to the highs of the day.
This analysis is published about 06:11 p.m. EST.
The analysis is pretty much the same today. Targets are the same. The expected direction is down. Volume today is slightly higher than yesterday’s green candlestick, this fall in price is still supported by volume.
I have now three overlapping small first and second waves within micro wave 5. When the mid line of the violet channel on the hourly chart is breached then I would expect an increase in downward momentum. The upper edge should provide resistance, but I think that’s now too far away so I’ll add another short term line to the hourly chart for resistance. Draw it from the end of micro wave 4 to the end of minuscule wave 2, in other words, a parallel copy of the mid line to sit on most recent highs on the hourly chart. Use that new line for resistance.
If pice breaks below the lower trend line look out for another potential free fall.
The target remains short term 1,060, mid term 1,023. I’m leaving comments now to write this all up. Good luck everybody!
Waiting for gold to drop off a cliff before the close so I can sell DUST at a high today.
Seems like dust is starting a 3rd of a 5th, although risky will hold some overnight
With 1088-87 holding, upside 1104-09 limiting, third day today Gold price below the lower band, I wonder if Gold price can continue to stay below the lower band much longer….
Just bought and sold DUST in 6 minutes 11:36 – 11:42 for profit of .75 a share
Flipping some fast and holding some DUST for when gold plunges down today then sell DUST today. Then do it again. Sold and bought 3 times today.
looks like dust is at the 0.618 retrace, time to load up???
I just bought some DUSTat 10:55 am at $32.24 lower than Monday close with gold up at 1100 and gold is lower now.
wow, i got the same exact price, hopefully it does not retrace more, but if it does i will buy more!
Had bought Monday close DUST at 32.28 then sold at open today for 35.05 then bought DUST again at 33.942 this morning and more at 32.239 and sold a little at 32.934. Waiting for higher to sell rest today and buy low again.
Yesterday I bought and sold DUST 4 times for profits.
Looking to buy and sell on intraday lows and highs of multiple waves.
I am not a day trader, so will probably hold short position thru 1060 target and I see the end of minute iii currently targeted at 1023 as next decision point.
Important question is how high will minute iv bounce?
Minute wave ii was 0.618 of minute wave i.
Minute wave iv may be expected to be 0.236 or 0.382 of minute wave iii as most likely to exhibit alternation.
I’m not going to calculate a price target for it though until minute wave iii is over. There is way too much room for error in that kind of forecast.
Lara, thanks, certainly I would appreciate if you pulled a calculation out of your EW bag of rules but I really was not expecting you to answer because of your comments in daily analysis and because I did not place “Lara” in the question ( you are always kind to answer when I do). I thought some of these traders would jump on the question with an opinion but it’s a slow day for comments today.
Good Morning, Any ideas on what could trigger acceleration to downside
Elliott Wave patterns.
I tend to believe Elliott wave patterns don’t make the market fall but anticipate when an event will happen to make the market fall.
They don’t anticipate events they project wave patterns based on sentiment. They don’t know and don’t care about news. Lara doesn’t follow any news.
I follow my local news. But I don’t read much international news. Not in too much depth anyway. Local is more relevant to me down here in New Zealand.
The core premise of the Elliott wave principle is this:
The movements of the market are an expression of social mood, which is a kind of group psychology. It is human beings and our mood which drives the markets.
When we are optimistic we make positive decisions. When we are pessimistic we make negative decisions.
The market expression of our mood comes first. If the market is rising or near a peak we will be more cohesive, for example, Greece may not get pushed out of the Euro and the EU until the market is falling hard. I have not done an analysis of any European stock exchanges to be able to suggest when that may be.
It will not be Greece being pushed out of the EU that triggers a market fall in other words.
Current widespread views have the relationship exactly opposite to this.
Recently (just over 1 year ago?) there was some research done on twitter. Researchers found (to their surprise) that when twitter peaked with negativity three days later the markets fell. When twitter peaked with positivity three days later the market rose. The link was significant. They had expected exactly the opposite.
So look at it in the reverse. Instead of asking “what will make this market fall” ask “what negative decisions / news will come after the market has fallen”.
It’s a hard position to take because currently it’s wildly unpopular. If I were to say this in a public forum I’d be lambasted for idiocy.
Target for $USD is 102.
http://www.safehaven.com/article/38352/us-dollar-breakout
Dreamer thanks for the article
Look at all the 10% down days for $HUI back in 2008 near the bottom. We could have a lot of volatility in the miners before the bottom. Good for trading.