
Price has moved lower exactly as expected.
Summary: The target for the next third wave to end, which may be met tomorrow, remains at 1,060. The following fourth wave may show on the daily chart, but it may not. The target for minute wave iii to end remains at 1,023 and a multi-day correction is still expected to arrive about there. Downwards momentum still needs to show an increase at the daily chart level for the wave count to have the right look, so the strongest downwards move is still ahead. It may turn up in a fifth wave to end one or more of these third waves. Expect any more surprises to be to the downside.
To see weekly charts click here.
Changes to last analysis are bold.
DAILY ELLIOTT WAVE COUNT
Click chart to enlarge.
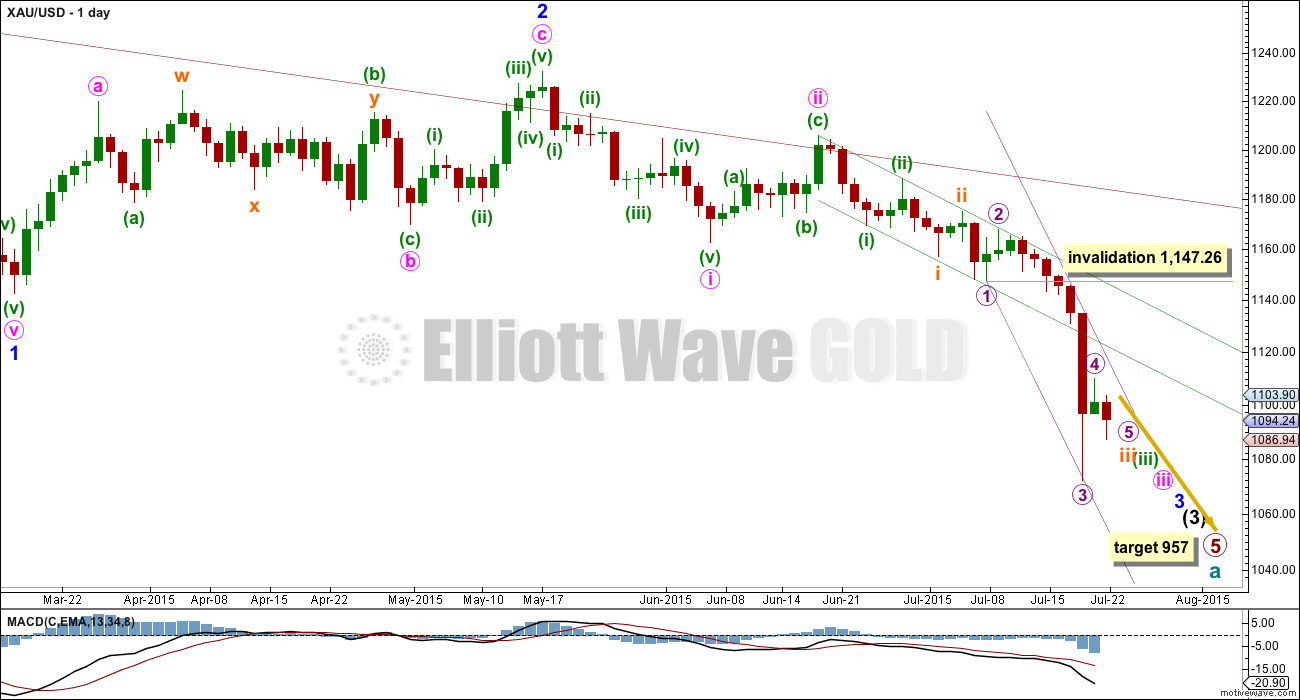
Cycle wave a is an incomplete impulse.
Within primary wave 5, the daily chart focuses on the middle of intermediate wave (3). Within intermediate wave (3), minor wave 3 has yet to show an increase in momentum beyond that seen for the end of minor wave 1 at the left of the chart. This is why I still expect to see more downwards movement to show a further increase in downwards momentum. The strongest downwards momentum may turn up in a fifth wave somewhere within minor wave 3, maybe the fifth wave to end minute wave iii or that to end minor wave 3 itself.
Draw a base channel about minuette waves (i) and (ii) as shown (green trend lines). If the steeper violet channel is breached then look for the lower green trend line to provide resistance. Only if the upper green line is breached would I consider the wave count to be wrong.
Draw a best fit channel about subminuette wave iii as shown (violet lines) and use that channel on the hourly chart.
Micro wave 4 (if it continues further) may not move into micro wave 1 price territory above 1,147.26.
At 957 primary wave 5 would reach equality in length with primary wave 1.
HOURLY ELLIOTT WAVE COUNT
Click chart to enlarge.
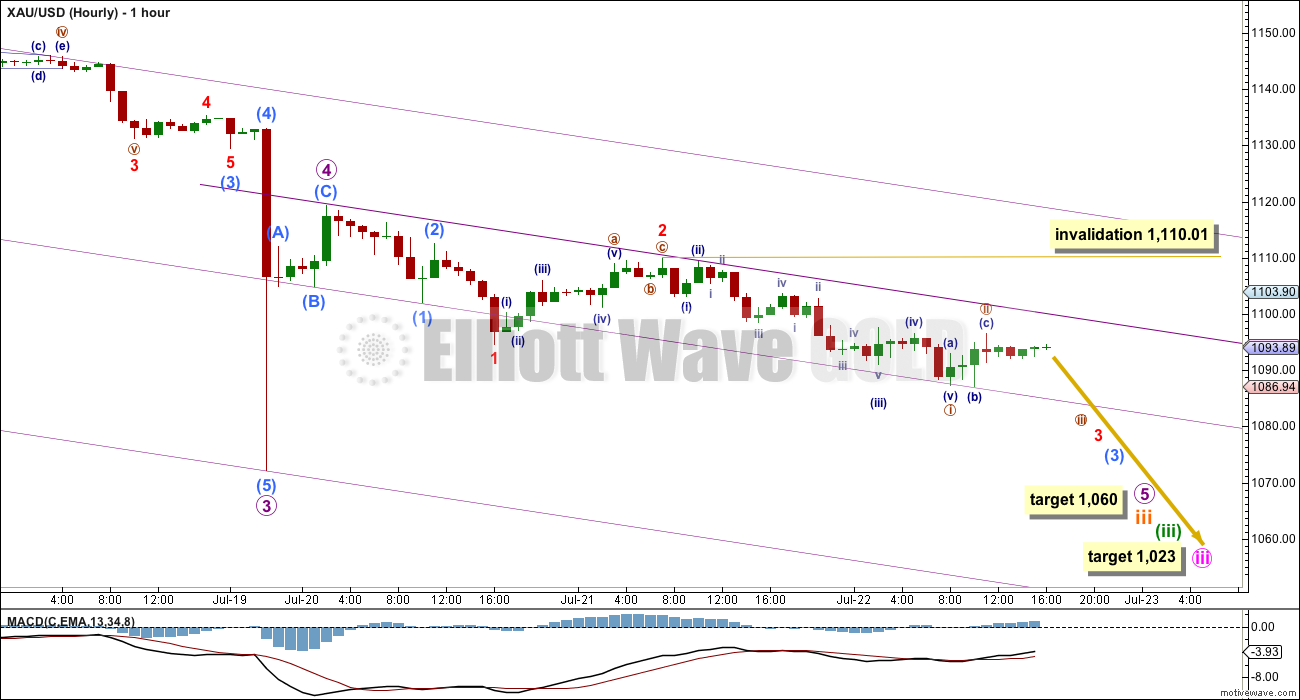
Gold often exhibits swift strong fifth wave extensions, and they usually turn up to end its third waves. We saw this to end micro wave 3. It is entirely possible, and should be expected, that it may happen again to end one or more of subminuette wave iii, minuette wave (iii), minute wave iii, minor wave 3 and maybe even intermediate wave (3). Look out for any more surprises on the way down to be to the downside.
There is no Fibonacci ratio between micro waves 1 and 3. This is important and means that micro wave 5 is more likely to exhibit a Fibonacci ratio to either micro waves 1 or 3. At 1,060 micro wave 5 would reach 0.618 the length of micro wave 3. This fifth wave down for micro wave 5 will complete subminuette wave iii impulse. So far subminuette wave iii has lasted twelve days and may end in one more day to total a Fibonacci thirteen.
Submicro wave (5) to end micro wave 3 was a swift strong extended fifth wave. Sometimes when a movement is “too far too fast” a fifth wave truncation turns up. It is possible that my target of 1,060 is too low. Today this target looks entirely reasonable though because micro wave 5 now needs room to the downside to complete a five wave impulse structure.
Within micro wave 5, there may now be three overlapping first and second waves: submicro waves (1) and (2), followed by minuscule waves 1 and 2, and now nano waves i and ii (brown circle). This suggests an increase in downwards momentum should arrive when the middle of the third wave and then the fifth wave unfolds.
Create a parallel copy of the mid line of the violet channel. Place it on recent highs as shown. Use that trend line to show where upwards corrections should find resistance. When the mid line is breached an increase in downwards momentum may occur; this may be the middle of the third wave. If the lower edge of this channel is breached, then momentum may increase substantially, but it is also possible subminuette wave iii may end at the lower edge of this channel.
At the daily chart level, micro wave 3 now has a curved look to it (very typical for Gold’s third waves). We may see this curved look for one or more of subminuette, minuette or minute degree third waves too. This happens often because Gold’s second wave corrections are often more time consuming than its fourth waves; because it has swift strong fifth waves, they tend to force the fourth wave corrections to be relatively swift and shallow.
For now I will focus on looking for the end of subminuette wave iii. When subminuette waves iii and iv are complete, then I will use multiple degrees to calculate the target for minuette wave (iii). I will not provide a target again for it until I can do so at more than one wave degree.
When minuette waves (iii) and (iv) are both complete, then the target for minute wave iii to end may be recalculated and may change. For now I can only calculate that at one wave degree.
At 1,023 minute wave iii would reach 2.618 the length of minute wave i. Minute wave iii has now lasted 24 days and its structure is incomplete. If minute wave iii totals a Fibonacci 34 days, then it may end in another 10 days. If that expectation is wrong, then minute wave iii may be too long in duration, may not exhibit a Fibonacci duration, and may end quicker than this.
TECHNICAL ANALYSIS
Click chart to enlarge.
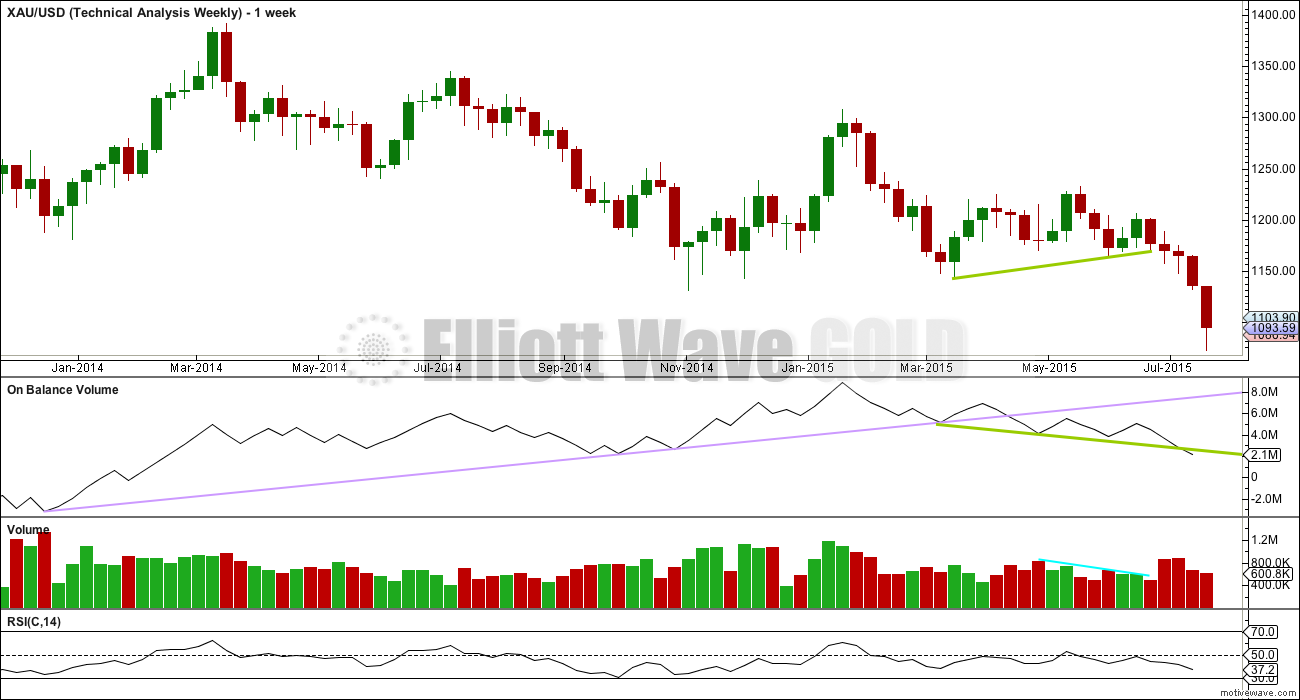
Weekly Chart: The lilac trend line on On Balance Volume has been breached, which is a longer term bearish indicator.
OBV is now breaking below the shorter green trend line, another bearish indicator.
Volume for recent downwards weeks has shown an increase which comes after the consolidation showed a typical decline in volume as it matured.
OBV has this week breached the shorter held green trend line, another bearish indicator.
RSI is usually a fairly reliable indicator of lows. At the weekly chart level, RSI is well above 30 indicating there is room yet for Gold to move lower.
Click chart to enlarge.
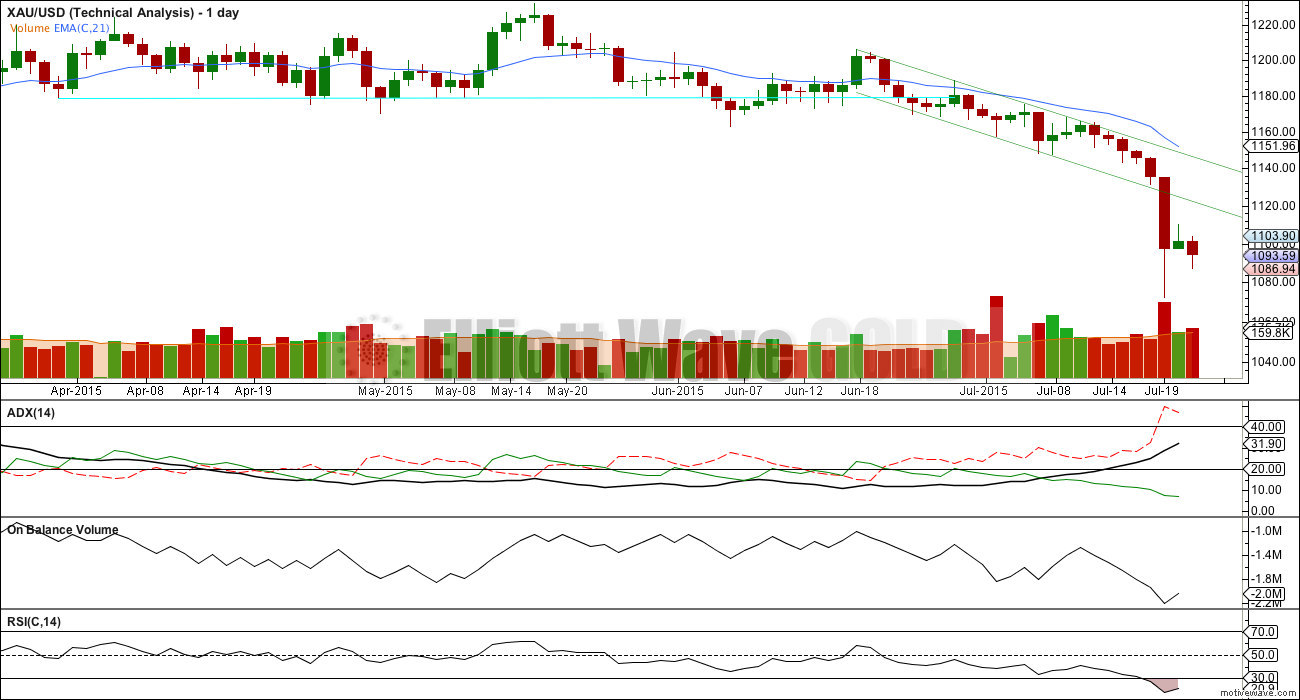
Daily Chart: What is quite stark on this daily chart is the strong volume for Monday. This strong downwards movement was supported very well by volume. There is nothing suspicious about it.
I have looked back again at the ends of third and fifth waves within primary wave 3 during April, May and June 2013. During that downwards movement there were a few strong down days with volume spikes, similar to what we have seen this week for Monday. Each time this happened it was not the temporary price low. A brief discussion of some of those important down days follows.
The strong days of 12th and 15th April, 2013, (a Friday and Monday, so consecutive trading days) saw one more day down after that to reach the low on 16th April. At the low price diverged with RSI: price made a new low while RSI turned up. That low ended minute wave iii within minor wave 5 within intermediate wave (3) within primary wave 3.
There was a series of strong down days culminating in a volume spike on 16th May, 2013. The price low happened the following trading day on 20th May and was again seen with divergence between price and RSI on that day. That low ended a truncated fifth wave (the third wave prior was the strongest move; too far too fast) for minor wave 5 within intermediate wave (3) within primary wave 3.
The strong downwards day of 19th June, 2013, was impressive with a price range of 27.65 for the day and the strongest volume spike of them all at 124.9K. But that was not the end of the fall. The low came six days later on 27th June 2013. Only that last day with the final low for primary wave 3 saw a divergence between price and RSI. The final day also produced a new low but a green candlestick and a strong bullish engulfing candlestick pattern. That was the end of primary wave 3 and the start of primary wave 4.
With this analysis we should expect the pattern to be repeated again within primary wave 5. At the price low for yesterday’s strong downwards day to 1,072.09, there is no divergence between price moving lower and RSI also moving lower. The short term / mid term low may not be seen for another one to five days yet. This analysis fits nicely with the Elliott wave count and potential Fibonacci durations (with the exception of another eleven days before the low for minute wave iii; another reason that duration may be too long).
A correction may be expected soon, but not quite yet.
ADX is still clear. The ADX line is above 20 and rising indicating a strengthening trend. The -DX line (red dashed) is above the +DX line (solid green) indicating the trend is down. A trend following trading system should be used.
The simplest system for a downwards trend like this is to use resistance lines: each time price touches resistance that represents an opportunity to enter in the direction of the trend. Trades may be held until price either reaches support, a target, or if the trade is held for one day if you are a day trader. Depending upon your trading style, your risk management, and management of the equity in your account, stops as always are essential: they may be money management stops, they may be just above lines of resistance (allow for small overshoots), or they may be Elliott wave invalidation points.
This approach outlined here is just one trend following method of many.
This analysis is published about 05:07 p.m. EST.
Sentiment moves Gold and this article has a great chart that illustrates that.
http://moneyweek.com/spread-betting/is-the-tide-turning-for-gold-price/
Yes I know the article is old however it still is an eye opener chart. New DSI figures would be nice to have.
Looks like dust 1st wave was aprrox 4 bucks, so the third wave would be 1.618 x 4 = 6.4.
Third wave started at about 34.50 plus 6.4 which is about 40 bucks. Would this be where the 3rd ends??? Please correct me if I am wrong.
Thanks Shahab for posting your dust EW tgts.
I am also keeping close tabs on DUST as its movement is slightly different compared to gold. My EW analysis of DUST calls for the third wave to end around 42. The analysis is a working value and not that precise as I only have a daily chart to refer to and calculate from and not the live data feed. If you have a live chart online, please point me towards it. Greatly appreciate it. I don’t have the detailed calculations here as I am away from my computer. I am using my iPad to reply.
I have changed my trading play lately. I monitor DUST closely, and use gold price movement as a cross-reference. This occurred to me on Monday/Tuesday because gold retraced little after the spike down but DUST dropped very much out of proportion. So, it is more accurate to trade using DUST analysis rather than gold’s.
By the way, I have the first wave as 31.70 to 36.99.
Thanks Tham, what type of chart(s), would you like to see and I will place it in the comments section each day, not a problem, just have to figure out how to do it once and then it should be a piece of cake.
Try http://www.freestockcharts.com. You can chart any symbol and any timeframe with only a 15 minute delay. You do need to deal with some ads for the free version, but its not too bad. You can create a login to save your charts for multiple symbols and timeframes. Not bad for free. By the way, the symbol to use for Gold is XAU/USD. Attaching a basic screenshot of the site.
Thanks for all your informative posts!
Dreamer, thank you so much. I will go for it. The last time I used Freestockcharts, and that was about a year or more ago, I couldn’t get it to work the way you mentioned.
FYI Google Finance has live prices for DUST without any delay. I much appreciate your intraday wave analysis, and also your projected targets for DUST. On Monday, I finally made back not only my EWG subscription (wife’s happy about that!) and some losses, but quite a lot beyond that! The Tuesday pullback was a bit of a shock though.
I didn’t check your targets, they may be OK. Something you may want to try is to base your targets on 3x or -3x the movement of GDX when doing calculations for NUGT or DUST. You will likely come up with a slightly different and likely more accurate target because of the design of the 3x ETF’s to only be accurate on a daily basis.
I work on DUST data. I analysed both GDX and DUST together yesterday and found that they are not entirely in (reverse) tandem. There are significant discrepancies in the larger timeframes. They may correlate better in smaller timeframes but I don’t have data feed other than daily numbers to prove it. It is more precuse to take it straight from the horse’s mouth rather than use a proxy.
Lara, does gold have any more retrace up to complete at any level like Pico to 1100?
Might gold drop to 1060 in the next day or did today’s Fib action prolong subminuette iii at 1060 by another 8 days?
Might gold retrace back up overnight so gold starts higher up Friday NYSE open before dropping?
I don’t think so. I think this should now be a third wave down. On the way down I’ll expect to see some support at the mid line of the channel, that may be where submicro (3) ends. Submicro (5) may have the power to break through the mid line and may end at the lower edge.
I expect another red candlestick for Friday.
The upper edge of the channel should provide resistance to corrections along the way down.
I’ll have an alternate wave count today which sees minuette wave (iv) over and minuette wave (v) down underway. Target for minute wave iii is the same at 1,023
I look forward to seeing your alternate today. Glad to see you considered a higher degree of labeling. Thank you for your diligent hard work.
Did Pico wave 2 just bottom and end at 1,189.94 at 2:06 pm and from here gold goes up to 1,100 -1,101 as per Tham at 11:40 am today? I remember Pico lately just couldn’t find it on the charts lately.
There is always a lot of uncertainty with corrective waves.
The rise from about 11 am to 12:30 today could have been a complete pico 2 because it shows as a 3-wave form on a 10-minute pmbull chart. It is also possible that pico 2 is continuing as an expanded flat and will soon run up towards 1100. In order for it to be an expanded flat, the down wave from 12:30 pm to 14:30 would need to be a 3-wave form and it looks more like a 5 to me.
So I think pico 2 ended today at 12:30 pm and did not make it to Tham’s target. Time will tell.
The miners seem to have no doubt which way the wind is blowing.
I’m thinking it ended too — DUST is roaring. Thanks for your answer
Gold did go to 1100 this morning.
Now on way to 1060,
Alan: Yes, nano 3 by Lara’s count.
I am waiting for pico 2 to complete before loading up my shorts. It should correct up to about 1100-1101.
The turning points are 1105.84 – 1092.96 – 1096.71 – 1089.94 for nano 3.
1092.96 is pico 1.
There are 2 possibilities for pico 2.
If pico 2 has not ended at 1089.94, then pico 2 will be an expanded flat
1092.96 – 1096.71 – 1089.94. Targeting 1100+.
The move down looks like 5 subwaves and hence cannot be part of the expanded flat as its B wave must be a 3 and not a 5.
Hence, pico 2 has completed, and it would have ended at 1096.71.
The subsequent move down to 1089.94 will be the first subwave of pico 3. That is a 5-wave impulse and has not ended yet. I counted only 3 waves to 1089.94.
I am going to short at the highest point reached by the subsequent upward movement, this being the second subwave of pico 3.
Thank you Tham. Wasn’t sure if you were still up. Was about to sound the alarm to you, ha ha. : )
He said he was going back to sleep until 3:30.
are you being funny? cause he just posted at 3:21.
I have a serious question for you. I’m doing manual calculations/spreadsheet to determine when a sell and buy back is more profitable that just holding, but is there some wisdom already out there? Don’t need to re-invent the wheel so-to-speak.
… Selling partial and re-buying adjusts the cost basis for remaining lot
He said that hours ago he would get up at 3:30
My sincere apologies. I woke up at 3 am.
What a fabulous week!
Lara hasn’t changed her wave notation yet to show Pico and Nano waves (which one is Pico, brown or navy??)
Nano is brown circle.
Subnano is navy with brackets.
Pico is navy without brackets.
And I need to update the wave notation file for you all.
Gold – It Ain’t Over Until the Fat Lady Sings – July 23, 2015 by Martin Armstrong
http://www.armstrongeconomics.com/archives/35296
I see Armstrong as smart and I like his cycle theory but reading his pronouncements reveals little , I can understand this as he has paying customers but would be better if he just said “buy my reports”.
I would have purchased his reports but was concerned they contained the same gobbly-gook and so would be un-useable.
Possibly someone here may be able to translate Armstrong’s writings into actual targets for gold?
That is a big problem with most gold forecasters. That they don’t provide even detail that it is user friendly in trading especially with the volatility of gold.
Lara’s great detail in her daily written summary and charts and video provides enough to trade especially when there is a trend.
DUST sure moves fast at the open up $1.40 in 6 minutes. I guess investors saw what looked like a bargain however gold was up $3 since the close.
At 10:57 am gold goes then starts heading up slowly and 45 minutes later it is up $1 and DUST is up $1. Investors like the stability then they buy in.
Monday GDX and NUGT had their highest volumes in 5 years.
By price volume is 30% higher in DUST than NUGT
EWI expects gold to have a counter trend rally, once price reaches the 1065 range. I lean towards that view. Does anyone have a similar outlook?
I would say 5 sets of 4th and 5th waves (of increasing wave degrees) to complete Primary 5 and hence Cycle A at 957.
Yes a retrace at 1060 subminuette wave iii. However the depth and length unclear.
Lara, “at 1,060. The following fourth wave may show on the daily chart, but it may not.”
To add on, I have read some analysts calling for a bottom in gold at 1060. Their rationale is that miners will find it unprofitable to produce below 1100. A supply crunch will then drive up prices. Perhaps that is why they say there is a countertrend rally.
I don’t subscribe to that view. I prefer to stick to sub-1000 followed by a sharp V-shaped rally albeit to about 1550 before a final collapse in Cycle C.
Tham, I don’t subscribe to that bogus view either. “miners will find it unprofitable to produce below 1100. A supply crunch will then drive up prices.”
The market won’t be effected by miners shutting down temporaily. Gold has been dug up for 10,000 years and at the right price it is available. So no gold shortage. Those pushing that concept are confused or are selling gold.
This website clarifies that.
https://monetary-metals.com/monetary-metals-supply-and-demand-report-28-june-2015/
Richard, I’m assuming you’re referring to other views as bogus not those of EWI.
I didn’t mention EWI. They may be right as Lara says bounce at 1060 just not sure if will be on the daily candlestick level.
This is bogus.“miners will find it unprofitable to produce below 1100. A supply crunch will then drive up prices.” There is 10,000 years of gold supply available so some miners shutting down is not a supply problem at all.
Tham,
They do expect gold to fall below 1000. However, they see a potential for a counter-trend rally before resuming the decline towards the area of $950. They’re purely technical.
At 1105 wave ii completed. Now gold is in wave iii down???????? am I correct?
Yes, nano 3 by Lara’s count.
I am waiting for pico 2 to complete before loading up my shorts. It should correct up to about 1100-1101.
Tham great to hear as I will buy DUST there as well.
I sold my DUST at yesterday close then slept in this morning and missed buying at the opening low. Darn. So buying DUST up at 1,100 gold is the best news for me all day. Hopefully then gold gets pulled down under to 1060 by a high speed super whirlpool created by three 3rd wave Artic Vortexes.
This is a learning point for me as well. When there is some semblance of a strong move to end a 5-wave impulse such as the move towards 1105.84 from yesterday’s low, there will be some significant pullback (Newton’s 3rd Law?) I like to trade small positions in such trend changes. Not much, in case I’m wrong.
So it’s Newton’s fault my profit’s delayed and I think it’s his 3rd law, ” For every action there is an equal and opposite reaction.”
Tham I take it that 1100-1101 is today before close?
It seems that the drop to 1060 may not be today if gold has to go up to 1100 area first.
Yes, that could happen. Again it may not. Pico 2 started 2 hours ago at 1092.96 and it is still moving slowly. My experience is that the stock market is normally lethargic after 11 am, and comes to live only after 2 or 3 pm. So there may not be sufficient time. Lara has said that 4th waves occur quickly but 2nd waves are a drag. I may decide to take a nap and then check at 3:30 pm.
Hi Tham, With gold making new low for today do you expect it to bounce to 1100 still. I ask because with DUST at new high I’m thinking of taking profits and repurchasing hopefully at a lower price.
Thanks, Rob
Hi all. I forgot there is a subnano, so my pico waves should have been subnanos.
Robert. Subnano 2 ended at 1096.71. So pico 2, the second subwave of subnano 3, which has just started, cannot reach higher than 1096.71. I would consider it to end at 1093-1094. That would give a good entry point for shorting (towards 1060). Let us hope that the pico 2 takes its time so that it could end after Friday open.
My guess is it looks like it did at 1105.84 at 4:20 am.
Lara, how close are you to completing minor or (intermediate wave 1*) in oil?
*you were considering changing the degree…
Hi John. I was the one who suggested to Lara the degree change.
I may be able to help you as I am also monitoring the count. Based on the revised count, I think we are about to complete the third wave (minuette 3 of minute 5). We need one small 4th wave and a 5th wave down before completing minute 5 and hence Minor 3. The target is the lower one at 48.52.
Tham–on subject of oil. If target down of 48.52 or there-abouts is achieved, do you have a target for the up move?
Based on standard Fib retraces, my targets are 53-54 for minor 4 and 45.0-45.5 for minor 5. That would be my first of a sequence of trades shorting oil.
Thanks Tham. I like the possibilities in oil.
This morning I’m looking at it and I think the target is too high.
Oil keeps doing this to me.
I’m not going to call this first wave down over until the upper edge of the trend channel is breached. While that line keeps providing resistance expect the downward trend to remain.
RSI shows it can go down still further.
I’ll update Oil over the weekend again for everyone.
Will gold drop to 1060 to complete subminuette iii before close today?
Does it have enough time to do it?
Maybe with three 5th wave impulses.
Only thing is it needs to complete 3 third waves to do it.
I have serious doubts about it. Depending on how low degrees you count to, there are one third and three sets of fourth and fifth waves to negotiate. If minor 5 shows a Fib duration, the next number in the sequence will be 21, which means another 8 days more after today.
New Rambus public post. Good read. http://rambus1.com/?p=41180
Gold Panic
Jul. 23, 2015 2:03 AM E
http://seekingalpha.com/article/3348515-gold-panic
Gold just reached a high of 1,105.84 at 4:20 am EST that is between the hourly upper resistance and invalidation at 1,110.01
I’m glad I sold my DUST at the Wednesday open at $35.05 as it really dropped hard to 31.70 at 10:59 am. I did intraday trade it a half dozen times and then sold it a minute before the close as I had a hunch it might bounce a bit. So I’ll look to buy it again at a low today before gold drops down to 1,060. “The target for the next third wave to end, which may be met tomorrow, remains at 1,060. The following fourth wave may show on the daily chart, but it may not.”
Get ready to buy gold – Avi Gilburt July 22, 2015 1:27 p.m. ET
http://www.marketwatch.com/story/get-ready-to-buy-gold-2015-07-22
I was first expecting gold to head to 1,000 or even lower, and for the HUI to challenge the 100 region before the bull market would be able to resume. Well, we are almost there.
For now, I don’t believe the lows have yet been struck, but I do believe we are much closer to those lows at this time. From an Elliott Wave perspective, we are only completing wave iii of (3) down at this time. That means we will likely see a wave iv bounce, followed by the completion of wave v of (3) down to lower lows. This will lead to a larger degree 4th wave bounce, which should rally approximately a month or so, before we make our final lows in this market, which will then lead to the resumption of the long term bull market. I suggest you get your shopping list of mining stocks together. HUI is at 115.79 a 5 year low.
50 year Forecast chart for HUI – The Gold Bugs Index (Miners)
https://www.elliottwavetrader.net/scharts/Chart-on-Amex-Gold-Bugs-Index-HUI-20150603730.html
Interesting 50 year $HUI chart. I don’t think it matches up with Lara’s count though. With Gold expected to be an an A-B-C correction at Cycle degree, $HUI will likely put in a low lower than what Avi shows for ((2)) after Gold has it’s Cycle B rally and then goes down for Cycle wave C. That will be 2-3 years from now.
DUST has gained 200% since it’s low of $11 the same for both May 14th and January 21st, 2015. If only I’d (we’d) known and could of maxed up and waited. LOL
Wave 3’s are the best time to buy and hold the 3x ETF’s, up to several weeks at a time. You miss a lot of the gains by trying to trade smarter than the market.
Some of us have been in DUST for over 2 months.
By jumping in and out you only managed to miss
the big moves and limit your profits.
I ride the trend. As long as price moves in one direction with no significant pullbacks, I stay long. One glaring exit strategy is at the end of a strong price spike such as that which happened on Monday as it inevitably invites a sizeable pullback next. Dreamer is right. The time for a protracted hold is in Wave 3s, especially when momentum is strong. In those instances, I add to my position. Too much ins and outs means you are bestguessing the market. Basing on the law of averages, you do not make as much as you would like to. There could be times when you really want to kick yourself for missing big moves.
… exactly.
Or in the case of commodities fifth waves. They can be stronger than the third.
The trick is to get out quick when they’re over… so keep a trailing stop or use a trend line to adjust your stop as price keeps moving in the direction of the trend.
Because they can end with quick sharp spikes.
Gold is below the 0.618 level of 1,150.30 since the all time peak at 1,921 in 2011.
http://www.kitco.com/commentaries/2015-07-22/images/Gold%20July%2022.png
Lara, is there any idea where intermediate wave 3 might bottom and how high intermediate wave 4 might peak at?
Not yet.
Intermediate (3) would be 1.618 at 1,046. That’s too close, it needs more room to complete the structure.
The next ratio is 2.618 at 884 which is too low. Intermediate (3) may not exhibit a Fibonacci ratio to (1), the target is better calculated at minor degree.
That’s why I haven’t provided a target for it yet.
And I’m not going to estimate where intermediate (3) may end and from an estimate make another of where intermediate (4) may end. There’s too much room for error; such an estimate would be useless.
Good ??? and thanks for the answer Lara.
I actually think the 1046 target for intermediate 3 to end is quite reasonable. See my reply to you below.
Lara thanks for clarifying the many indictors that still show and support the bearish trend continuing. You mentioned “The low is at least a few days away before we see an interruption in the trend.” Wow, a 5 day bounce at 1023 may fool the market into thinking the final low is in place. It is astonishing how much clarity you bring to the current gold state of affairs. Many are fearful of a huge bounce any day now, yet you prove the probability that is not the case now.
Gold price keeps flashing a forewarning to rally. I would imagine when the rally does occur, it wont be a small one… The shorts need to be watchful of this. Currently Gold price is seen struggling to get to or past 1096 with unlikely to seek 1100 and 1106 on the outside subject to if can break above Wednesday H 1102.3…. //// The lower band on daily has dropped to 1092 with Gold price nestling just above it riding it down lol
The rally could be interpreted as a zigzag or combination wave 2 at nano degree with invalidation point at 1110.01.
Anyone who is short has got to be concerned about how oversold the market is. The pause here is working off the oversold condition and keeps everyone on this site in suspense.
I think you are correct on the zigzag. Looks like a 5-3-5 up may be complete at the high around 1099. Should go down from here.
Lara,
Is there no chance that minute wave iii ended with the flash crash and that gold is now almost 3 days into minute wave iv? I believe that I was able to count a 5 down to the recent low.
While I do expect a new low soon, it could still be a few days away. I assume that (what I see as a possible) minute wave iv will be similar in duration to minute wave ii and very shallow. I certainly would not want to trade it – would rather just use it as an opportunity to short from a higher price. At most, price could move as high as the lower edge of the green channel on your daily chart.
Minor 3 would reach equality with minor 1 at 1068.
As a side note, I would suggest that RSI is quite oversold on the daily chart. Moreover, gold has traded below the lower Bollinger band for a few days now – that is quite a rare occurance. A very minor bounce (or pause) after this flash crash would not surprise me.
The fact is, there is no single technical reason to think a rally may occur soon yet. As to RSI, the weekly RSI is far more reliable than the daily RSI in predicting oversold or overbought conditions in gold.
Mathius, you are right. Lara points that out Weekly RSI is not oversold and not at 30 yet.
For sure not a major rally, just a few days of sideways movement for gold to catch its breadth.
Actually, yes. That fits. Minuette (iii) may be over.
But if that’s the case I would expect minute wave (iv) to be over at the high I have labelled micro wave 4, and not to be continuing from here for a few days.
Minute wave (ii) lasted three days. It would be likely after that strong fifth wave down that minute wave (iv) would not be longer in duration.
For that idea I would still expect more downwards movement, minute wave iii (pink circle) can’t be over yet. That doesn’t fit. The trend is still down overall and minor wave 3 still has to show an increase in downward momentum beyond that seen for minor wave 1. It hasn’t done that yet.
Minute wave ii (pink circle) ended in 9 days on the daily chart above. What I am suggesting is that the 4th wave counterpart to that is occurring right now. Gold is going on 4 days of holding the flash crash low…..and new lows are coming soon. If the move down from that pink ii was not a 5 wave structure, then I am incorrect.
As for momentum, I would say Monday was quite the example of that. Moreover, there should be another nice bit of increased momentum for what I see as the coming final 5th wave before a multi week correction.
Thanks
Ah, I’m talking about the green minuette waves (iii) and (iv).
I can see minuette wave (iii) over on the hourly chart. I can just see enough fourth wave corrections toward the end (just before the sharp spike down) for the structure to be complete.
I can’t see minute wave iii (pink circle) complete though.
So that means I’d be expecting minuette wave (iv) to now be over too. And this wave count may possibly be minuette wave (v) to end minute wave iii at 1,023.
That will be a new alternate for today.
And now I have to leave comments to write that up and finish charts. Otherwise I’ll never get it done in a reasonable time for you all!
Good luck everybody!