
Price began the session with downwards movement, which was expected, but the upwards move to end the session is much deeper than expected.
Summary: Monday may begin with a little upwards movement to at least slightly above 1,119.23, to a target at 1,121. Use the sideways violet channel on the hourly chart to show where upwards movement should find resistance and may end. This upwards movement should be over either during the morning of Monday or it may take the entire session, but it should not last longer than that. Thereafter, look out for a fifth wave down which can be swift and strong. The target for that is at 1,035.
To see weekly charts click here.
Changes to last analysis are bold.
MAIN ELLIOTT WAVE COUNT
Click chart to enlarge.
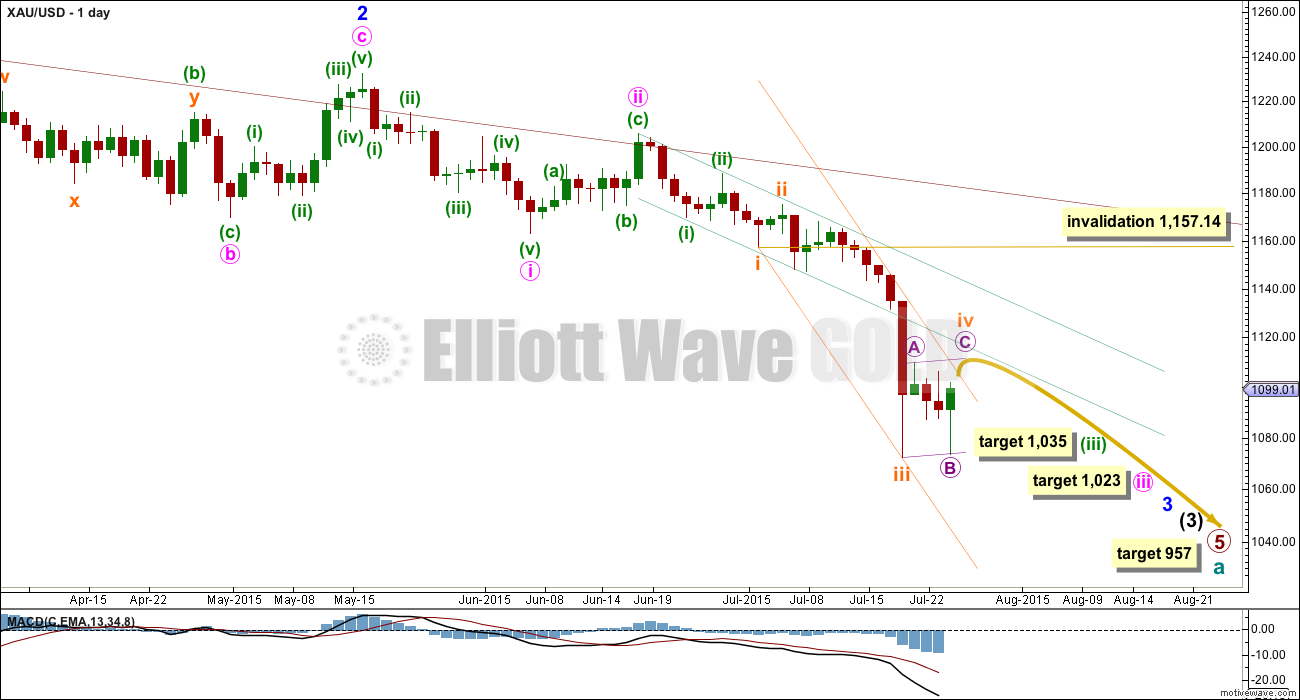
Cycle wave a is an incomplete impulse.
Within primary wave 5, the daily chart focuses on the middle of intermediate wave (3). Within intermediate wave (3), minor wave 3 has yet to show an increase in momentum beyond that seen for the end of minor wave 1 at the left of the chart. This is why I still expect to see more downwards movement to show a further increase in downwards momentum. The strongest downwards momentum may turn up in a fifth wave somewhere within minor wave 3, maybe the fifth wave to end minute wave iii or that to end minor wave 3 itself.
Draw a base channel about minuette waves (i) and (ii) as shown (green trend lines). If the steeper violet channel is breached then look for the lower green trend line to provide resistance. Only if the upper green line is breached would I consider the wave count to be wrong.
I am moving the degree of labelling within the end of subminuette wave iii up one degree; subminuette wave iii looks like it is over at the daily chart level. Also, subminuette wave iii has a typical curved look to it at the daily chart level and this wave count has the right look.
The correction looks like subminuette wave iv, which may not move into subminuette wave i price territory above 1,157.14.
Draw a channel about minuette wave (iii) as shown (this is slightly different than yesterday’s channel that has not yet been breached). Use this orange channel on the hourly chart. Subminuette wave iv may have to overshoot this channel slightly to avoid a truncated C wave. This may happen on Monday.
When subminuette wave iv is complete, then subminuette wave v down should unfold. It may be swift and strong, typical of Gold. At 1,035 minuette wave (iii) would reach 4.236 the length of minuette wave (i). When subminuette wave iv is complete, then I can add to this target at a second wave degree and at that point the target may change or widen to a small zone.
At 957 primary wave 5 would reach equality in length with primary wave 1.
Click chart to enlarge.
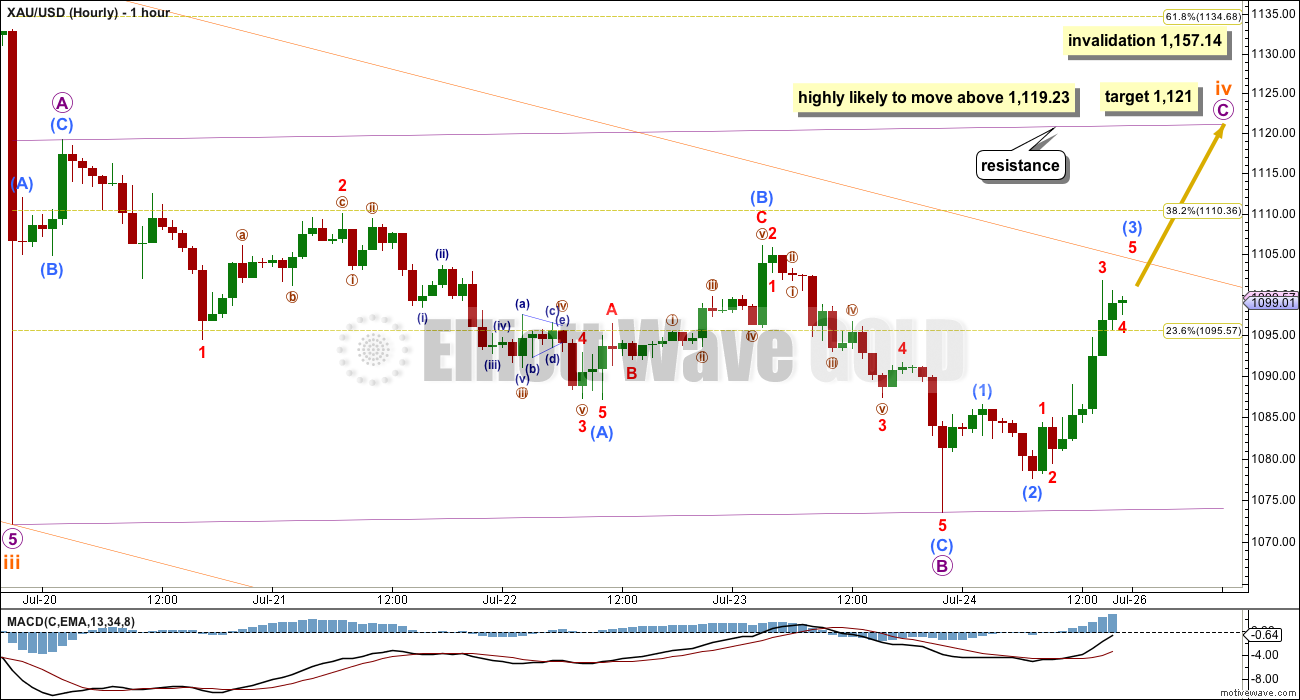
Upwards movement to end Friday’s session does not look like another second wave correction within a fifth wave down as per last analysis, because the movement is too high and too strong.
Downwards movement from the high labelled micro wave A to the low for Friday will not subdivide as a five, neither an impulse nor an ending diagonal, but it will subdivide as a three.
My conclusion has to be that Gold is in a multi-day correction against the trend that has turned up sooner than expected, and comes before price and RSI exhibited divergence at the daily chart level. Last analysis would have seen this as micro wave 4, but it would be unlikely that micro wave 4 would be more than four or five times the duration of micro wave 2. It is more likely that this correction is subminuette wave iv.
Ratios within subminuette wave iii are: there is no Fibonacci ratio between micro waves 1 and 3, and micro wave 5 is 3.83 longer than 1.618 the length of micro wave 3.
There is no Fibonacci ratio between subminuette waves i and iii. This makes it very likely submineutte wave v will exhibit a Fibonacci ratio to either of subminuette waves i or iii. When subminuette wave iv is over and the start of subminuette wave v is known, then the target of minuette wave (iii) to end can be calculated also at subminuette wave degree. At that stage, the target may widen to a small zone or it may change.
For now the target can only be calculated at minuette degree. At 1,035 minuette wave (iii) would reach 4.236 the length of minuette wave (i). Look out for the possibility that subminuette wave v downwards may be very swift and strong.
Subminuette wave ii was a relatively deep 0.58 zigzag. Subminuette wave iv is exhibiting some alternation as a regular flat correction. If subminuette wave iv reaches the target, then it would be less than 0.5 of subminuette wave iii and so would be shallower than subminuette wave ii. Subminuette wave iv is unlikely to reach the 0.618 Fibonacci ratio of subminuette wave iii at 1,135.
At 1,121 micro wave C would reach equality in length with micro wave A. Micro wave C should find resistance at the upper edge of the violet channel drawn about this regular flat of subminuette wave iv. Micro wave C is highly likely to move at least slightly above the end of micro wave A at 1,119.23 to avoid a truncation.
The target expects that subminuette wave iv will breach the best fit channel drawn about subminuette waves i, ii and iii. That’s okay, fourth waves aren’t always contained nicely within channels. If this happens, then the channel should be redrawn when subminuette wave iv is over using Elliott’s second technique. The redrawn channel may be useful to show where subminuette wave v downwards may find support and may end.
Subminuette wave iv may not move into subminuette wave i price territory above 1,157.14.
Yesterday’s alternate wave count would now see this correction as minuette wave (iv), one degree higher. I will not publish that idea again for three reasons:
1. Within minuette wave (iii) (if it was over at the low labelled subminuette wave iii), there would be no Fibonacci ratios between its actionary waves.
2. Minuette wave (ii) was a regular flat correction. Minuette wave (iv) would also be a regular flat correction. There would be no alternation.
3. Minuette wave (iii) does not have the right look at the daily chart level.
TECHNICAL ANALYSIS
Click chart to enlarge.
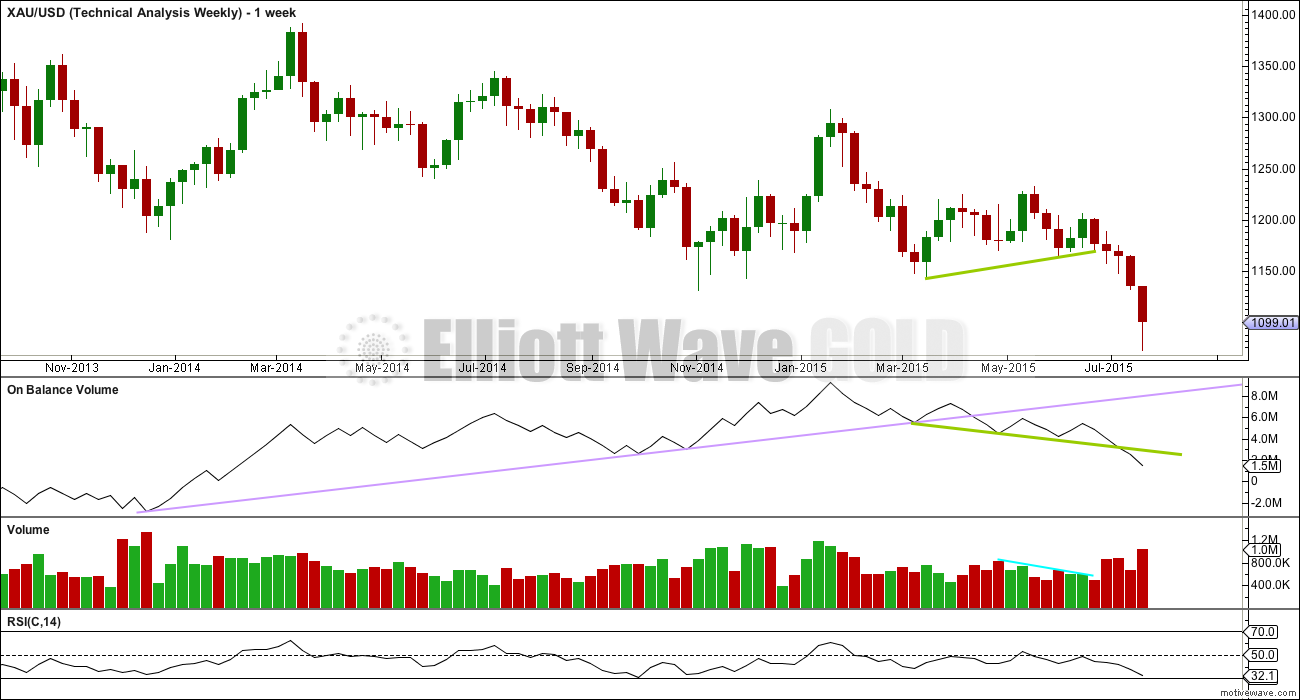
Weekly Chart: The lilac trend line on On Balance Volume has been breached, which is a longer term bearish indicator.
OBV is now breaking below the shorter green trend line, another bearish indicator.
Volume for this week shows a strong increase. The fall in price is well supported by volume at the weekly chart level.
RSI is usually a fairly reliable indicator of lows. At the weekly chart level, RSI is well above 30 indicating there is room yet for Gold to move lower.
Click chart to enlarge.
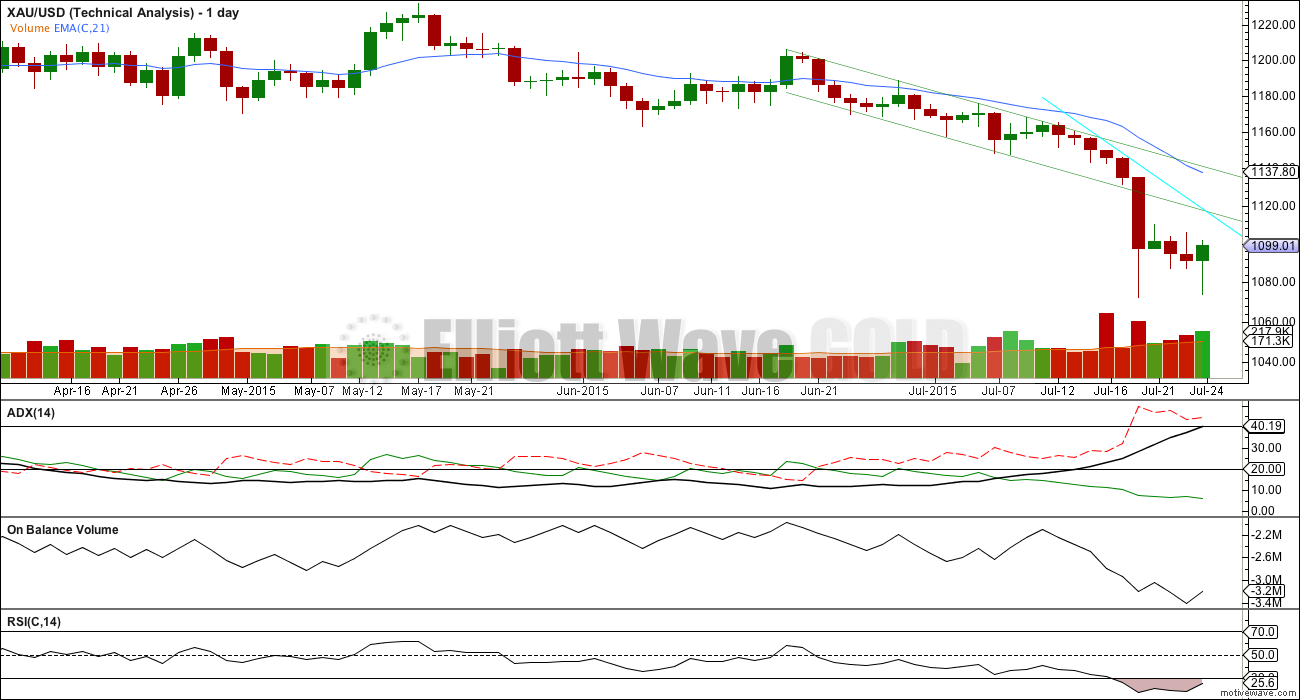
Daily Chart: What is quite stark on this daily chart is the strong volume for Monday. This strong downwards movement was supported very well by volume. There is nothing suspicious about it.
I have looked back again at the ends of third and fifth waves within primary wave 3 during April, May and June 2013. During that downwards movement, there were a few strong down days with volume spikes similar to what we have seen this week for Monday. Each time this happened, it was not the temporary price low: the low was seen one to six days later with divergence between price and RSI. I had expected this pattern to repeat with the price low to coincide with divergence on RSI, but it has not.
ADX is still clear at the end of the week. The ADX line is above 20 and still rising indicating a strengthening trend. The -DX line (red dashed) is above the +DX line (solid green) indicating the trend is down. A trend following trading system should be used.
The simplest system for a downwards trend like this is to use resistance lines: each time price touches resistance that represents an opportunity to enter in the direction of the trend. Trades may be held until price either reaches support, a target, or if the trade is held for one day if you are a day trader. Depending upon your trading style, your risk management, and management of the equity in your account, stops as always are essential: they may be money management stops, they may be just above lines of resistance (allow for small overshoots), or they may be Elliott wave invalidation points.
The Trend Is Your Friend. Trading against the trend may be possible for very experienced professionals, but for everyone else it is strongly advised to trade only with the trend. It is relatively easy to profit in a clearly trending market, but only if you trade with the trend.
Today I have added another likely trend line (in aqua blue) showing resistance.
This approach outlined here is just one trend following method of many.
There is a little positive bullish divergence this week: the low for 23rd July did not move below the prior low of 17th July, but On Balance Volume did make a new low. OBV moved lower while price did not. This bullish divergence supports the wave count which expects upwards movement for Monday (at least to start the session) and indicates that Monday may produce another green candlestick.
The long lower wick of Friday’s candlestick is another slight bullish indicator for the short term. It also completes a bullish engulfing pattern for the last two days.
This analysis is published about 06:51 p.m. EST.
I will have two hourly wave counts for you today: the first expecting subminuette wave iv to complete as a regular flat, target 1,121, confirmed above 1,105.18.
The second subminuette wave iv is completing a regular contracting triangle currently in wave D down which may not move below 1,073.56. To drift sideways in an ever narrowing range for another one to three days.
Either way it’s most likely that this fourth wave is incomplete today.
Use the upper edge of the orange trend channel on the daily chart; copy it over carefully to the hourly chart. Price keeps finding resistance at the upper edge, it is most likely to not break above that line. That’s the line of resistance and opportunity.
ADX remains clear and strong, the trend is still down, the structure is still incomplete.
Remember, when this fourth wave is complete the next wave down is a fifth wave to end a third wave one degree higher. They can be really swift and strong. It may come as a surprise, but hopefully we’ll all be ready if it turns out to be strong.
Momentum at the daily chart level is now slightly stronger than within minor wave 1. But for a third wave I’d still expect it to be much stronger, not just slightly. I still expect an increase in downwards momentum for this structure to look typical.
Good luck everybody!
While price remains above 1,086.57 this downwards move could be submicro wave (4) within micro wave C.
A new low below 1,086.57 would indicate micro wave C is over and was truncated.
A new high above 1,105.18 would indicate micro wave C is completing to the target 1,121.
Thank you Lara for giving us these parameters. : ) !
Upwards movement is finding pretty strong resistance at the upper edge of the orange channel from the daily chart. That may force micro C to be truncated.
There’s another possibility. Subminuettte wave iv could just drift sideways and complete a triangle. That means it may keep finding resistance at the orange trend line and won’t move higher, yet may take it’s time to end in one to maybe even three days time. Triangles have a purpose; take time and test our patience!
Today US oil, US equities, US dollar dropped, yet Gold dropped as well?
China syndrome? Shanghai composite index was bashed badly today. I think oil is the worst victim.
Tham, what are your current thoughts on oil?
Hi davey. I think oil is completing minuette 3. Minute 3 goes 53.50 – 50.14 – 51.58 – (today’s low at 47.06, wave 3 not ended yet) – ? – ?
I feel there is a small window of opportunity to short at Minute 4 (most likely around 48+), targeting 42.87. I plan to use DWTI, and I estimate the gains will be in the region of $20-25 on DWTI. Lara said that target would be reached on Aug 10.
Lara: If possible answer every ones questions below in new post so we do not have to scroll down ro each one below.
Thanks.
I’m answering above.
Lara,
Is gold target range 1119 – 1121 still in effect or any bounce above 1100 in the next day?
Or is gold already continuing down in bear waves towards the 1035 target?
Gold price really needs to break below $1091 and stay there~! Upside $1099-1105 still seen as containing with $1110-11 on the outside and 10dma ($1116) further out…. With Gold price bearish down trending, am staying with Sell for a take out of $1075-74 targeting $1052-51… Lets wait for an update.
*There appears to be a slow down / erosion in the down trend, I wonder why; the lower band also seems to have moved up…*
Sorry guys, I was following DUST and use gold only as a reference. There is a possibility that DUST has completed its down move at 30.53 this morning. and is now on the way up towards 45+ in the first of five waves. Anyway, just being a bit gungho and bought some. But. no regrets. It is now up by more than $5 from the low, technically a 16% gain.
Gold, on the other hand, is very sluggish. If gold is going to reach the target of 1121, then it is probably in the C wave of miniscule 2 of submicro 5. I don’t know whether timewise this is too slow.
The bigger implication is that if my wave count for DUST is correct then either (a) DUST has diverged from gold, or (b) gold has already completed its upwards correction, maybe as far back as Friday’s high of 1191.21, and is currently beginning its slow descent towards 1035.
Any comments?
Tham, glad you got in DUST rally today.
Gold day high of 1102.33 at 10:06 am.
Not sure if that will end up being the high of today or if Lara’s rally to 1119 – 1121 has already ended? However it is clear that miners’ rallies will be sold fast.
I still have GDX and in a very small loss, however missed big DUST rally.
I think that 1094.41 the 10:55 low has to hold for this possible gold rally to continue?
If this is the C wave of miniscule 2, then it can drop below 1094.41 before rising in miniscule 3. So far, it is on track, although slow.
The other possibility is that DUST is correcting 39.82 – 30.53 – today’s rally – steep drop towards 27.
I will exit at 36.20 and await developments.
If so, then gold will be soaring towards the target of 1121.
I note the action in USD is kinda bearish. Getting hit hard today.
Also I’m showing very high volume on the outside day reversal in Gold on Friday. One would expect follow through.
This could turn into a pretty decent countertrend rally in Gold, and may last more than just 2 days. However that is, of course, a very difficult trade to make.
Hi Tham. Glad to see you here.
You know I’m not count EW yet, just aware of it. So is there anyway on XAU the highs around 1104 could be the submicro 5 end and we are seeing a zigzag with the subsequent 1088 being an x wave… this would mean there is further up move coming?
Dust is poised to go higher, but, if the smaller 10-min, 5-min, 3-min time frames reverse it would be shortterm before the further push up.
Thoughts?
Hi dspropering. So nice to chat with you again.
I would still think, as I mentioned above, that gold is getting ready to rise towards 1121. 1088 would have been submicro 4 as micro c must show up in 5 waves. Today’s rise to 1102.33 would be the first subwave of submicro 5, that is miniscule 1. The current long drawn out drop is miniscule 2. Once this finishes miniscule 3, 4 and 5 will complete at 1121 target.
The alternative is that the correction has ended at Friday’s high of 1119.21.
DUST will also have two options as I mentioned above. I’m waiting for this to resolve, but I will still take profit first as insurance against a large drop towards 27. Let’s see how this works out. Since we are in a downtrend, and DUST is the favoured buy, my strategy is to monitor DUST closely and use gold only as a reference.
Thanks Tham. But I don’t see any price at 1119 anywhere, except on Lara’s analysis charts. Do you need glasses? (lol. no offense.) Where are you looking and seeing 1119?
I also monitor Dust and use gold as a guide on overall direction.
You are right. I am wearing glasses. Just that I remembered the value wrongly. (Now I need memory pills, lol). 1119 was the high on July 20. It was higher than Friday’s high.
To Tham -can’t respond under your comment… (edit: I’ll be darned it did post under your comment)
Oh wow! You too! I know my memory is affected from Oxygen deprivation at night. (sleep apnea) Not good. But so glad to see you laugh.
I totally missed entering Dust today — FORGOT I had planned to at final low and let myself be distracted by other life demands alll morning!
Now I have to find a decent entry. : (
Any wave count?
The current wave count supposed to have gold move to 1119 by this morning or full session today.
Wave count changed or gold is going down from here.
Rambus bot JDST and DUST back this morning on backtest by miners.
I think we are either in submicro 4 or miniscule 2 of submicro 5.
Looks like gold couldn’t stay above $1,100
I should of sold GDX at 10:06 am at 14.38 at the gold day high of 1102.33 at 10:06 am.
DUST is up at $34.50 up $4.00 since day low of 30.50.
Not to say gold won’t hit Lara’s target, however each miners high is an opportunity to take profits or cut losses. Investors bailing out of GDX since 10:06 am.
Lara: IS there an alternate hour wave count if gold does not get up to 1119> today?
Dreamer, your calculation of future GDX price (below) was an exceptional outside-the-box approach to confirming GDX target.
Maybe consider the same approach to Silver? Looking at Lara’s last Silver chart shows a possible 60% downside–which implies phenomenal potential gains in 3X short Silver if 60% downside is correct.
Davey, glad you found the calculation useful. I don’t trade any of the Silver 3x ETF’s. For me, the volume is just too low for my comfort and easy entry/exit. That said, I took a look at the Gold to Silver comparison for you. I don’t have as much confidence in this comparison since the Silver top was about 4 months before the Gold top and because of this 4 months difference, I did the calculation 2 ways as shown. Either way, the calculation shows targets lower than Lara’s first Silver target, but well above her 2nd target. There are plenty of sites online that show the historical ratio of Gold/Silver. Over time, this ratio seems to vary widely. Hope this helps. Good luck trading Silver.
Lara,
Do you expect this corrective C wave to subdivide as a 5-3-5? At the time of this comment, the first 5 up is complete, and the first 2 waves of the 3 down as well.
If I have interpreted this correctly, gold will now dip back into the 1080s, and then turn back around to aim for a new high above 1119.
I am sure that I am speaking for all of your subscribers when I say that we would very much appreciate an update.
Thanks in advance.
I believe the C wave is expected to be a flat, in which case it should divide as a 5 (or 5-3-5-3-5). I am assuming it is not over because did not get near the target.
I agree, it is not over.
The first 5 wave structure up looks very clear to me. Beyond that, I am not certain. There could have been a 3 wave down to the low that was seen about three hours ago and gold is now doing another 5 up. Either this, or what I suggested above.
In any case, I am just going to wait this one out until I see higher prices to get back in again.
The decline over the past few months has been characterized by drawn out corrections. None of us should be shocked if this one is a bit longer than one would normally expect.
I think a 5th wave may have started at 1088.58 at 8:30 am
There are a lot of possible 5-th waves in play. Are you talking about submicro 5 wave up as part of micro C of this correction (with target 1121)?
Yes my guess is submicro wave 5 may have started at 1088.58 at 8:30 am.
I already sold GDX near it’s high and bought it back cheaper this morning.
Would really be great to have gold peak at Lara’s target today.
DUST low this morning $30.50. Would be even better under $30.00 for the big drop to $1,023 to end minute wave iii. Then buy GDX again as Lara had previously mentioned a 5 day bounce up in minute iv. That may be a good NUGT play as well to buy it dirt cheap.
That’s my count too. Submicro wave (5) up unfolding.
Does the larger correction we are seeing indicate that we will have a larger move to the upside?
No.
I will sell GDX when gold hits Lara’s target of 1121 Monday or above 1119.
Then buy DUST for the drop down to 1035.
Here’s another analyst with a more bullish target; however, Lara has previously explained why a count like this is invalid.
There’s quite a lot wrong with that wave count. And it’s invalid, although you can’t see the subdivisions, it won’t work.
Dspospering, Richard, fencepost, lara etc…
Thank you for all responding to an earlier post so fully and with genuine empathy, support and valuable guidance.
I have unfortunately been caught out by poor advice from a ‘professional’ who was ‘sure’ of a bear rally from 1155… Being a gullible guinea-pig I put all of my portfolio into miners… The rest is history.
To compound this;
– I have just sold my house and put all my capital into the markets for ‘this great opportunity…’
– I was in dust with lots and sold at $15.60…
I am now lots down in nugt and miners combined. Life changing sums that I have only accumulated through hard work and hard work in property.
So… Whilst broken mentally, emotionally and financially I will endeavour to save what I have and ‘go again…’
Let’s hope that Gdx does rally for a month and I can put this nightmare to bed.
Best wishes.
I feel your pain, but Hope is not a strategy. For what it’s worth
I think the best you can hope for is a gap fill to $5.20. At that
point I would consider selling and following Lara’s advice and
invest with the trend. Also any professional adviser who told you
to go all in, in a triple ETF has huge liability and you can probably
sue and recover your loses.
Good Luck
Aiden,
Fortunately, you have found the best Gold analyst on the web in Lara. Don’t be afraid to take a loss on a trade when it goes against you. Trade with the trend. Between now and October, there will likely be several up and down opportunities to trade for profit as Gold and the miners navigate a series of 4th wave corrections before the expected bottom hits below Gold 1,000. You can recover your losses with a few good trades. Good luck.
Aidan
Unfortunate circumstances still requires wise trading with caution.
3X Gold ETF’s are risky so limit your exposure with them as no sure thing as look at Friday when when NUGT went from -8% to +10% in 4 hours.
Follow the trading guidelines Lara gave you last week.
I highly recommend that you still add some of the world’s best indicators to your trading platform in addition to using EW. I limit my exposure with all my trades to about a maximum 2% loss, then I sell. However by successful trading it does add up.
I am so sorry to hear that. You’re not alone. It’s common for people new to markets and trading to experience a loss, sometimes big, before they find a system which is profitable.
You’ve discovered the hard way to not listen to gurus. Including me, and I certainly don’t aim to be or profess to be one. I’m just an analyst.
Even an average to bad system can still be profitable if risk is managed properly. I’m guessing that when you put your money in you probably didn’t have a clear exit strategy; “what does price have to do to show me my analysis is wrong? where should my stop be? how much am I prepared to lose on this trade?”
A good rule is to never risk more than 2% of your equity in any one trade. This allows your account to sustain 10 losses in a row and not be wiped out. Theory Of Runs.
It may mean your trades at this time are very small. If so that may be necessary if you want to stay in this game long term.
I highly recommend you purchase and read “Technical Analysis of Stock Trends” by Magee and Edwards, 10th Edition. It’s a classic for a reason. It will cover some money and risk management, boring but absolutely essential. It covers the basics very well.
Finally, I would also recommend stepping back and taking a little time out from trading at this time (unless you’ve already done this). After a big loss emotionally you may not yet be ready to trade. You can still watch, read and learn. If you haven’t taken a break I would also recommend you take a break from this site too, really step back, and come back refreshed.
The market will always offer another opportunity. It’s okay to wait if you need to.
Thank you for the support Richard, Dreamer, Robert, Lara
I am still holding and will take each day as it comes.
Kindest regards
Aidan
Are you going to follow Lara’s gold suggestion on near term peak today then big drop in 5th wave? Or just keep your NUGT even if gold drops?
Your decision can make you money or lose money?
Absolutely superb analysis and comments this weekend.
Great community here working together.
AND finally from Avi Gilbert on GLD/SLV EW count:
“Current Analysis of GLD and Silver
As far as GLD and silver are concerned, there is still nothing on the chart to suggest that the bottom has been struck, nor is there anything that makes me want to trade this chart in a counter-trend fashion. As you can see from my attached daily silver chart, there is nothing to even speak of regarding a counter-trend rally until the downtrend line in red is breached. Until that happens, I am looking for wave (3) to head lower.
In the GLD, we are also caught in a downtrend channel, and it too suggests that no counter-trend trade should be taken as long as we remain within the channel.
The one note I want to add about GLD and silver is that the downtrend is not terribly impulsive looking from the recent highs, which makes it more likely that we are in an ending diagonal for this last segment of the decline. It makes it much more difficult to set downside targets on the micro-scale, since we have no impulsive pattern to follow. It also means we can see some whipsaw as we continue lower. But, once completed, we often see a very strong reaction in the opposite direction, taking us back to the region from which these diagonals began, which would be a minimum initial target back towards the May high once all 5 waves down have completed.
Ultimately, the market is setting up for our final approach towards the runway of the long term wave 2 correction. But, since we do not have a clear impulse pattern in this last stage down towards our lower targets, I am not going to be shocked if the market has a few surprises in store before this downtrend is completed.”
I am staying with Lara’s wave count.
More weekend reading from Avi Gilbert letter. I do not follow him.
On GDX EW:
” As I also noted on Wednesday, the GDX is providing us with the cleanest and clearest of the wave structures. And, based upon that wave structure, once we complete wave iii of 3, we will then see a wave iv of 3, followed by the completions of wave 3, 4 and 5.
Furthermore, since the 2nd wave of this current down trend was quite short, it is likely that wave 4 will take up a relatively large amount of time, and potentially last for as long as a full month. It is for this reason, along with the extension in wave iii of 3, that I am not going to expect a low in the GDX until at least September. But, once wave iii of 3 completes, it means that we are only “squiggles†away from the 4 year correction completing.”
Wave iv Correction of GDX to last a full month???????WOW
Can GDX rally without GLD? Does not make sense.
They’ll both rally at the same time. They both still need some fourth wave corrections.
Do we have a wave IV target for the GDX?
Could prove invaluable.
Market Letter authors already getting ready for the up coming multiyear bull market in PM sector. Here is a para from AVI Gilbert.
“How We Are Preparing For The Resurrection Of The Bull Market
As I also reminded members this past week, as per the request of many members at Elliottwavetrader.net over the last year, Larry, Zac, Garrett and I have been diligently working on our managed miners portfolio and allocation percentages to prepare for the final bottom in the miners. For those that may not know, we are creating our own miners portfolio within our StockWaves service at Elliottwavetrader.net, with the goal of outperforming the GDX. We are analyzing all the stocks within the GDX, and taking out the ones that we feel will underperform, and replacing them with stocks we expect to outperform, once the bottom has been struck. Furthermore, our “committee†will be regularly reviewing all the stocks within the portfolio every two weeks to assure that we maintain an outperforming portfolio.
And, since my expectation is for bottoming to occur no earlier than September, we should have our list and allocation percentages completed by our roll out date of September 1. And, we thank you, our membership, for constantly pushing us for this over the last year. Ultimately, we expect this will place us in the enviable position of having recommended exiting the market at the exact top in 2011, and attempting to time the publication of our managed miners portfolio right at the expected bottom.”
My opinion: one does not need this service. There are handful of mining companies that one can put them in portfolio. LOL
More to come in another post for the weekend reading. As long as Lara does not mind.
I don’t mind at all. Post away.
These Leveraged ETFs Show Just How Bad the Commodities Crash Has Been
So bad that 3-times inverse ETFs are producing 4-times returns
http://www.bloomberg.com/news/articles/2015-07-24/these-leveraged-etfs-show-just-how-bad-the-commodities-crash-has-been
Rambus public post. Sees Gold target at 850.
http://rambus1.com/?p=41389
Thirdeyeopentrades target = 892
But…we just bounced off of support. If the EW count is correct, we will beak through this support after the bounce.
To Aidan,
Not sure how these comments work– if you’ll be notified of a response. I responded to your 7-21-15 post.
I hope that you are doing well.
Lara, any chance of the current comments system being able to email a poster when someone replies to their post? That was a handy feature of Disquis. Now it’s very easy to miss a reply especially when it’s posted a day or more after the original post, hence dsprospering having to refer Aiden back to a prior day.
Yes, that would be a handy feature. If you could turn it off and on.
I don’t know. I’ll ask Cesar to look into it.
Similarly, Disqus gave notifications in real time on whether and where there was a new post in the comments section, without the need to refresh and then try and locate what the new comment was among the many existing ones. That was a terrific feature and sorely missed
I agree.
By the way. Been looking at USD as well. I think momentum has this coming down a little further – agreeing. We shall see.
Lara, I have gdx intermediate 5 projected at 261.8% of intermediate 1 which equals: $13.21
Gdx bottomed at $13.17 or four pennies away from this target which also would theoretically complete primary A. This is scary considering we got a big bounce on high-volume from precisely this point; could you check into this? The fifth wave subdivides as a three so far… so bottom doesn’t make sense particularly if gold is to reach 960. But this sudden stop 261.8% raises a flag. How did you calculate your target at 11.22? Also, gold is about 13% from target while gdx is 20% from target. Does this sound reasonable? Has anyone figured out the average ratio between gold and gdx movement? I’m guessing gdx is 3:1? (Just a guess). Look forward to your oil count also..
GDX decline vs Gold has been accelerating and is likely unsustainable.
http://www.cnbc.com/2015/07/24/the-very-contrarian-case-for-gold-miners.html
The structure for intermediate wave (5) just is not complete. You’re right; on the monthly chart it looks so far like a three. Very strongly indeed. It has to keep going to be a five.
I have intermediate wave (1) from 66.98 to 50.42; 16.56 in length total. I have intermediate wave (5) beginning at 27.78. The target I calculate for intermediate wave (5) to = 2.618 X intermediate wave (1) is:
27.78 – (16.56 X 2.618) = -15.57. Which is impossible.
Are you referring to a different wave of another degree?
My target for intermediate wave (5) is to reach equality in length with intermediate wave (1):
27.78 – 16.56 = 11.22
The thing about Fibonacci ratios is it’s often really hard to pick which one will be seen. If the one which eventuates is a longer one (say 2.618 or 4.236) then along the way price will pass shorter ratios (0.236, 0.382 etc) and at those points support / resistance may also occur. But that doesn’t mean the end of the wave. And that’s often quite tricky to analyse.
Jaf, I did the ratio analysis on Gold decline vs. GDX decline from the 2011 top to present. Based on the ratio and the Gold target of 957, the target for GDX would be 11.31. Almost the same as Lara’s target. Amazing! Bob
Would love to see your charts anytime you feel like posting.
While it may not always work, especially on short term moves, we can try to calculate targets for this up move based on Lara’s gold target of 1121.
Gold: 1121-1098.4 = 22.6
GDX: 22.6/15.66 = 1.44, so GDX target = 14.08+1.44 = 15.52, which is a 10% move.
Based on 10% GDX move,
NUGT target = 3.74 x 1.3 = 4.86 and then the DUST buy target = 32.61x.7 = 22.83
This implies a gap fill for GDX, more than a gap fill for DUST, and only a partial gap fill for NUGT.
Let’s see how this works out.
Really appreciate these projections.
Kind regards
A
studying jdst this weekend
jdst
values are approx.
1st wave 6.3-8.2
2nd wave 8.2- 7.0 (63.1% retracement)
3rd wave 7.25 to 18.25
4th wave (in progress) about 39% so far, should not go deeper, since wave 2 was deep, but who knows
if this wave count is correct then this next wave, wave 5, will take us past the previous high of 18.25! Wow!
With EWG forecast and analysis we are on the verge of next wave to profit from PM sector.
Thanks Lara for your excellent analysis.
Rambus kamakzi portfolio (3xPM etf) profit booked:
DUST from 15 to 35 in 2 months
JDST from 7.50 to 15 in 2 months
Expect More to come after a brief Short Cover Rally.
This shows what I also determined a while back on a different time period. That Dust is more profitable than Jdst. Even though you can buy twice as many shares (in your example)
Dust profit $20 share
Jdust profit $7.50 share
Buy 100 Dust @ 15
Buy 200 Jdst @ 7.50
Dust: Make (15–35) $20 * 100 shares = $2000
Jdst: Make (7.50–15) $7.50 * 200 shares = $1500
I personally prefer Dust for this reason. Just thought I’d share it for anyone else interested.
Good analysis of DUST vs JDST. I favour DUST only and not bother with jdst.
The reason for this difference i believe is that seniors have held up well during last two years and juniors have dropped to bottom.
Now senior are ready to capitulate for final low in gold. Just compare the RGLD/FNV/AEM/GG etc.
A lot of sites have commented that its the juniors that can really make profits, and despite dreamer’s comparisons, I’m still with the seniors.
DUST does not always outperform JDST. The attached chart shows DUST (candles) vs. JDST (purple line) over the past year. Note that at tops last NOV, DEC, and MAR, JDST gained more than DUST. That said, recently since May, DUST has clearly outperformed JDST.
Now lets look at NUGT (candles) vs. JNUG (pink line) over the past year. Obviously, it would not have been good to be in either of these except for a couple of bounces. Note that JNUG has declined faster than NUGT during the entire past year. My bet is that once we hit the bottom in Gold (Cycle A), that both will blast up fast and that JNUG may lead NUGT to the upside.
Awesome Dreamer. I should have done a complete comparison as did you. I only compared a few selected moves.
Papudi. First, congratulations for exit of DUST at top.
Currently, what do you believe are upside targets for DUST and JDST in “brief Short Cover Rally” you mentioned ? And timeline–how long to hit top of short term rally?
Lara: As usual fabulous report.
Is it possible for Wave iv to get over higher than 1121 next week to backtest mulimonth strong support line breakout poinf at 1131.03 for the last time?
Last kiss beforea run to the final target 957 to 850.
Yes, it is. The invalidation point is at 1,157.14 and theoretically subminuette wave iv can move right up to that point, but not above.
I would expect price to find strong resistance at the lower edge of the green base channel which is on the daily chart. If upwards movement were to hit that line on Monday it would reach it about 1,115.
I really would not expect much if any movement above that line.
Lara, does the callout on the hourly chart then have a typo?? Cause you are saying there that price is “highly likely to move above 1119.23”. Wondering which you mean.
No, that’s what I mean.
Subminuette wave iv is a regular flat correction. Micro wave A ends at 1,119.23 so for micro wave C to avoid a truncation it is highly likely to move at least slightly above that point. The target for micro wave C to = micro wave A would see it avoid a truncation and touch the upper edge of its channel.
Right. and “If upwards movement were to hit that line on Monday it would reach it about 1,115.
I really would not expect much if any movement above that line.” was where I thought you’d contradicted yourself and I got confused. Not to worry. 1115 1119.23
Today’s analysis has clarified price expectations.
Papudi, after the short term upward movement expected for Monday and then drop to new lows, expect more upside surprises before the final low of 957. Gold may have a strong counter trend rally for several weeks/months before getting all the way down there.
Lara, great analysis. I was stopped out of my JDST with a $3/share gain today but late to grab a small JNUG position, still up about 4% on it though. Also took some profits on DGLD today.
I’ll look to get back on the short side early next week.
Have a great weekend!