
Price began the session with some upwards movement, which the last Elliott wave analysis expected, but price then moved lower to complete a red candlestick.
Summary: A new high above 1,105.18 would indicate more upwards movement to a target at 1,121. A new low below 1,086.57 would indicate sideways movement as most likely for another one to three days to complete a fourth wave triangle. A new low below 1,073.56 would indicate the fourth wave is complete and a fifth wave down is underway to a target at 1,035. The fourth wave is most likely incomplete today. When it is done, then the next wave down may be very swift and strong.
To see weekly charts click here.
Changes to last analysis are bold.
MAIN ELLIOTT WAVE COUNT
Click chart to enlarge.
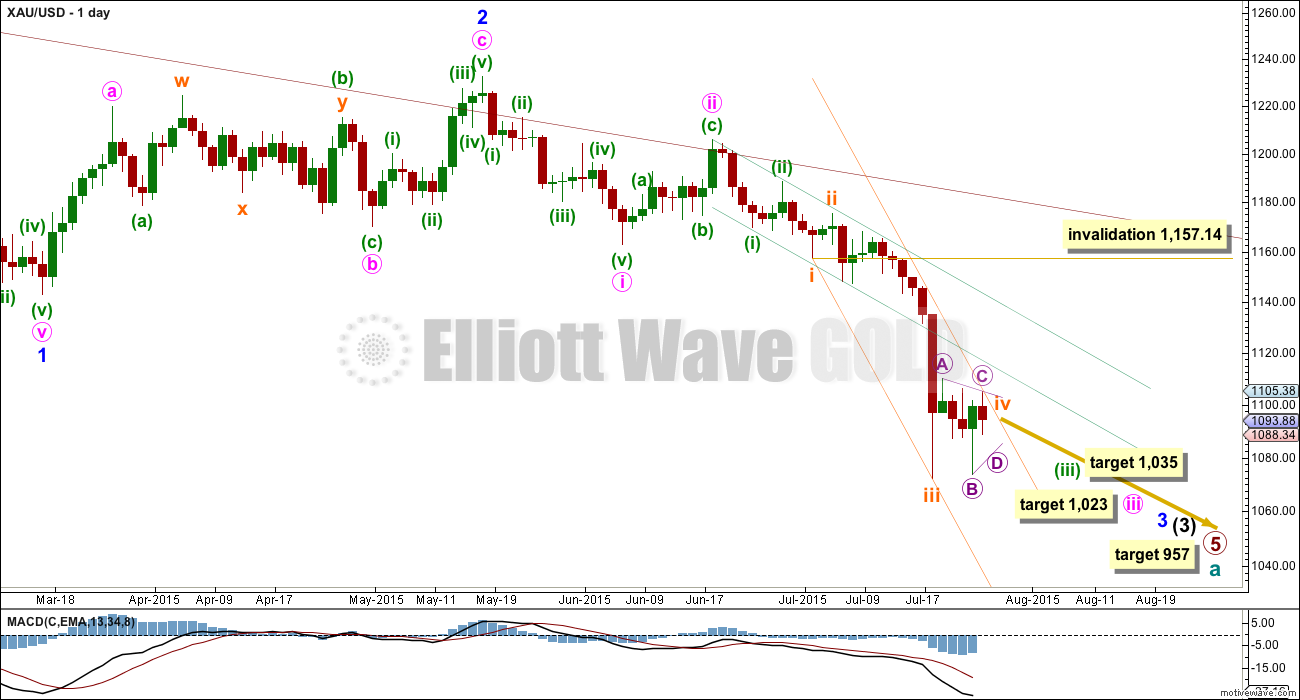
Cycle wave a is an incomplete impulse.
Within primary wave 5, the daily chart focuses on the middle of intermediate wave (3). Within intermediate wave (3), minor wave 3 now shows a slight increase in momentum beyond that seen for the end of minor wave 1 at the left of the chart. Third waves for Gold usually have clearly stronger momentum than its first waves, so I still expect to see a further increase in downwards momentum. The strongest downwards momentum may appear in a fifth wave somewhere within minor wave 3, or maybe the fifth wave to end minuette wave (iii) or minute wave iii, or that to end minor wave 3 itself.
Draw a base channel about minuette waves (i) and (ii) as shown (green trend lines). If the steeper orange channel is breached then look for the lower green trend line to provide resistance. Only if the upper green line is breached would I consider the wave count to be wrong.
Subminuette wave iii looks like it is over at the daily chart level. Subminuette wave iii has a typical curved look to it at the daily chart level and this wave count has the right look.
Subminuette wave iv may not move into subminuette wave i price territory above 1,157.14.
Draw a channel about minuette wave (iii): draw the first trend line from the ends of subminuette waves i to iii then place a parallel copy now on today’s high. Do the same on the hourly chart. The upper orange trend line may continue to provide resistance.
When subminuette wave iv is complete, then subminuette wave v down should unfold. It may be swift and strong, typical of Gold. At 1,035 minuette wave (iii) would reach 4.236 the length of minuette wave (i). When subminuette wave iv is complete, then I can add to this target at a second wave degree and at that point the target may change or widen to a small zone.
At 957 primary wave 5 would reach equality in length with primary wave 1.
HOURLY CHART – TRIANGLE
Click chart to enlarge.
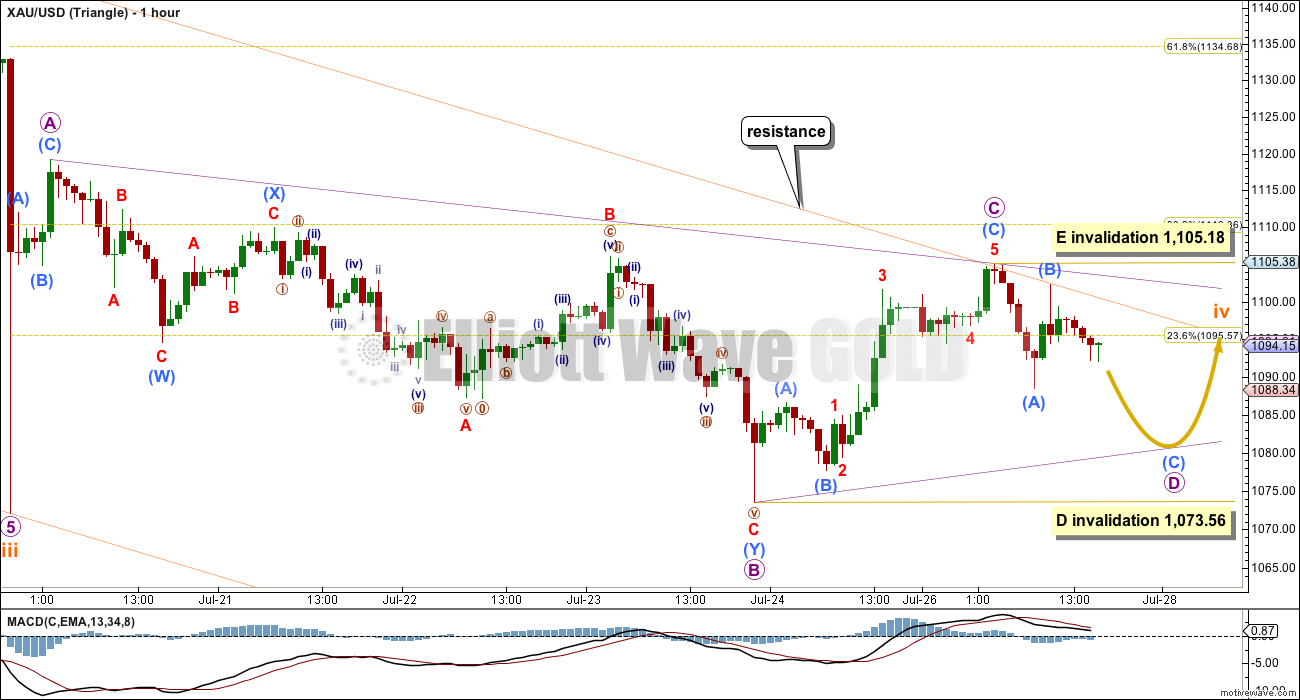
There are multiple structural possibilities for a fourth wave. At this stage, one possibility is that this fourth wave is most likely unfolding as a triangle, or a second possibility is that it may complete as a flat correction (second hourly chart below).
Subminuette wave iv may be a regular contracting or barrier triangle. All five sub waves must be corrective structures, and four of them must be zigzags while one of five sub waves must be a zigzag multiple (longer lasting and more complicated). So far, it looks like micro wave B was most likely a double zigzag, which may have been the longer lasting more complicated triangle sub wave. Micro waves D and E may complete as simple zigzags, most likely.
If subminuette wave iv is a regular contracting triangle, then micro wave D may not move beyond the end of micro wave B below 1,073.56. Micro wave E to complete it may not move beyond the end of micro wave C above 1,105.18. Micro wave E is most likely to end short of the A-C triangle trend line particularly if it finds resistance at the orange trend line. Alternatively and less likely, micro wave E may overshoot the A-C trend line.
If subminuette wave iv is a regular barrier triangle, then micro wave D should end about the same level as micro wave B at 1,073.56 so that the B-D trend line is essentially flat. What this means in practice is that micro wave D can move slightly below the end of micro wave B at 1,073.56. This lower invalidation point is not black and white, and this is the only Elliott wave rule which is not black and white.
The triangle may complete in one more day most likely; if not, then it may take up to three days. It looks like it is running out of room if that upper orange trend line is to continue to provide resistance.
At its end, subminuette wave iv would be very shallow and provide perfect alternation with the relatively deep 0.58 zigzag of subminuette wave ii.
HOURLY CHART – FLAT
Click chart to enlarge.
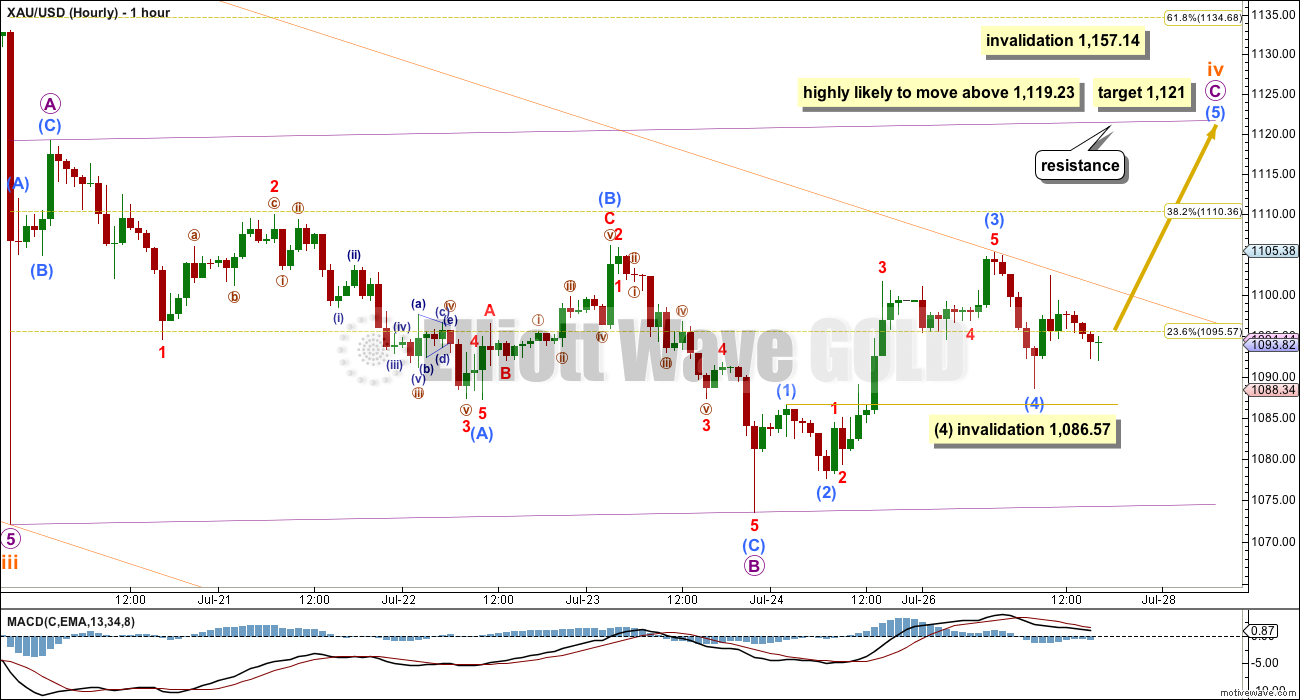
While price remains above 1,086.57, then it will remain possible that subminuette wave iv is completing as a regular flat correction.
Flat corrections subdivide 3-3-5 and the B wave within them must retrace a minimum 90% of the A wave. Here micro wave B is 97% of micro wave A. Micro wave C must subdivide as a five wave structure, either an impulse or an ending diagonal. So far it is subdividing as an impulse.
Within the impulse of micro wave C, the fourth wave of submicro wave (4) may not move into submicro wave (1) price territory below 1,086.57.
Micro wave C would be highly likely to make at least a slight new high above the end of micro wave A at 1,119.23 to avoid a truncation. At 1,121 micro wave C would reach equality in length with micro wave A. Micro wave C would most likely end when it touches the upper edge of the violet channel, because regular flat corrections normally fit nicely within their channels.
This idea expects subminuette wave iv to not find resistance at the upper edge of the orange channel. Sometimes fourth waves aren’t nicely contained within Elliott or best fit channels so this is possible. But now it has a lower probability because it is more common for the channel to be adhered to than not.
Subminuette wave iv may not move into submineutte wave i price territory above 1,157.14.
TECHNICAL ANALYSIS
Click chart to enlarge.
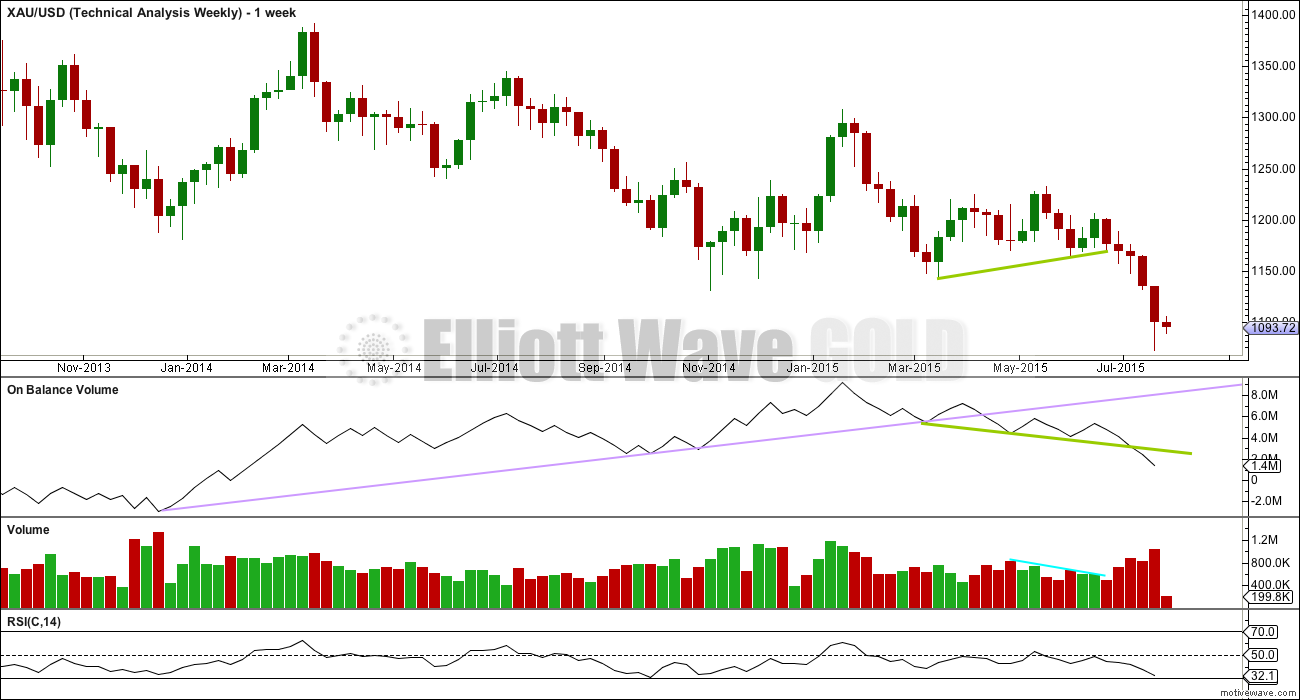
Weekly Chart: The lilac trend line on On Balance Volume has been breached, which is a longer term bearish indicator.
OBV is now breaking below the shorter green trend line, another bearish indicator.
As price falls volume is increasing and OBV is moving lower. This fall in price is supported by volume at the weekly chart level.
RSI is usually a fairly reliable indicator of lows. At the weekly chart level, RSI is still above 30 indicating there is room yet for Gold to move lower.
Click chart to enlarge.
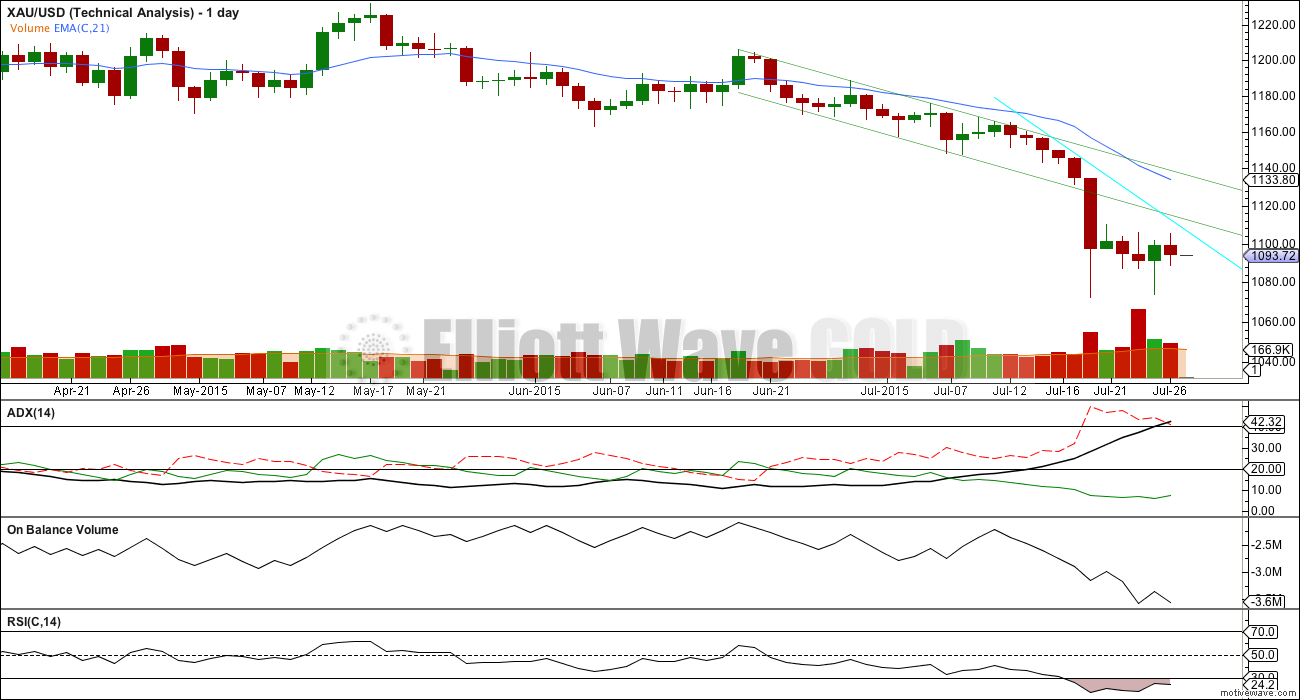
Daily Chart: Volume is flattening off. If this fourth wave correction is incompletem, then I would expect to see lower volume at its end for tomorrow’s session.
ADX is still clear. The ADX line is above 20 and still rising indicating a strengthening trend. The -DX line (red dashed) is above the +DX line (solid green) indicating the trend is down. A trend following trading system should be used.
The simplest system for a downwards trend like this is to use resistance lines: each time price touches resistance that represents an opportunity to enter in the direction of the trend. Trades may be held until price either reaches support, a target, or if the trade is held for one day if you are a day trader. Depending upon your trading style, your risk management, and management of the equity in your account, stops as always are essential: they may be money management stops, they may be just above lines of resistance (allow for small overshoots), or they may be Elliott wave invalidation points.
The Trend Is Your Friend. Trading against the trend may be possible for very experienced professionals, but for everyone else it is strongly advised to trade only with the trend. It is relatively easy to profit in a clearly trending market, but only if you trade with the trend. Corrections against the trend offer an opportunity to join the trend at a good price.
The aqua blue trend line may show where this correction finds resistance.
This approach outlined here is just one trend following method of many.
There is a little positive bullish divergence last week: the low for 23rd July did not move below the prior low of 17th July, but On Balance Volume did make a new low. OBV moved lower while price did not. This bullish divergence supports a wave count which expects upwards movement to end the correction, and it also supports a wave count which expects sideways movement for a correction. Overall it indicates a correction against the trend to unfold here.
The red candlestick for Monday has about equal lengths for upper and lower wicks indicating balance and indecision with bears slightly favoured.
This analysis is published about 06:11 p.m. EST.
I have no problem with subminuette wave iv not respecting that orange trend line. Fourth waves just are not always contained nicely within their channels. They are more often contained than not, but this one isn’t.
This sideways movement does not look like part of an impulse up to complete micro wave C, but the flat correction remains technically possible. The fourth wave within micro wave C would be forming a triangle for submicro wave (4) with submicro wave (5) to break out upwards towards the target 1,121. That would see a fairly large breach of the orange trend line.
But what looks much more likely today is the triangle forming for subminuette wave iv. I see that some members would prefer to see the flat unfold because it may offer a better opportunity, but the market does not know nor care what we want. The triangle would see a smaller breach of the orange trend line, with price to return below it more quickly.
MACD is right at the zero line, the small inside day completing a tiny doji looks like the end of a triangle. In terms of proportion it fits better as the end of a larger triangle for subminuette wave iv. I judge it to be possible but less likely now that it’s submicro wave (4) within micro wave C of the flat correction.
Volume is down, this consolidation is mature, it will break out soon. The direction is very likely to be a downwards breakout.
The next fifth wave may be short and quick if it follows a triangle, should make a new low below 1,072 to avoid a truncation and is most likely to be about 31 in length to equal the first wave.
If the flat completes then the fifth wave down may be longer and stronger. Maybe 1.618 the length of the first wave about 50.51.
I’m off to write that up now. Good luck everybody!
Lara is gold still in triangle and expecting to first break up to 1119 – 1121 or first down to 1073?
Yes it’s most likely still in a triangle, the breakout should come soon and yes it’s most likely to be down.
So what u gonna do short/long GDX?
I sold my GDX at high of the morning and bought DUST before the close because gold is most likely following the Triangle wave and soon break out down swift and strong $31 down to 1068.
Unlikely gold will go up to 1119 – 1121.
Wednesday I may buy more DUST if low before the 2 pm FOMC or else when the news comes out at 2 pm I’ll watch how gold reacts.
At 1:15 pm Gold just broke above an all day 1,2,3,5,10 minute pmbull trend line. plus 1 minute and 39 minutes Fired Bullish.
Gold price having a narrow trade range and an inside day to Monday H 1104.40 / L 1087.70, that’s a potent combination for a breakout and possibly large move to occur. Will remain to be seen if Gold price has an inside week….
Breakout up to 1121 or down towards 1035?
Hi Richard – Gold price is bearish and firmly in a down trend. I would expect the breakout to occur to the downside to take out the weekly $1073.70 low…. On a weekly basis, a homing pigeon is in play, with the three black crows exerting downward pressure…. I would expect the decline to be brief (in terms of duration, I think Lara has mentioned about a swift 5th wave down) and form a southern doji to act as a reversal for price to rise in a V shape…It is of concern that daily RSI having stayed below 30 for so many days is beginning to stir and slowly rise / has risen to above 20; Gold price may not be too far off from bottoming and reversal…. It is best to follow Lara’s wave counts though. Thanks
Fifth waves to follow fourth wave triangles are often swift and short. I would expect it to make a new low below the end of the third wave at 1,073.56 to avoid a truncation.
The final fifth wave down after this triangle may reach equality with the first wave so be 31.22 in length. That would take it to about 1,068.
Then minuette wave (ii) should unfold up / sideways to last about three or five days total.
But the structure has to keep going down to end minute wave 3, minor wave 3 and intermediate wave (3). The trend remains down.
Volume today is low. Typical of a maturing consolidation. Within the consolidation it is a down day which is very clearly strongest. That would indicate a downwards breakout is most likely, supporting the Elliott wave count.
This consolidation represents another opportunity to join the trend.
BGMI 70 years chart. Finally break out to down side???
BGMI (Barrons Gold Mining Index) going back to 1940s, so drew in some trend lines. Not good. 70 year uptrend broken. This bear market is a lot worse than I thought…the worst in last 70 years.
Load up DUST/JDST at right time of EW.
Papudi, yes miners really beaten down in price to record lows. Four years of gold bear market brought them to their knees.
The lowest price that the flat can achieve is 1086.57. For the present wave, it should not be lower than 1091.69 by my computations. Price went to 1094.57 and looks like it is turning up again. If the flat is the correct count, then price should be moving up all the way past 1105.18 invalidating the triangle. (Personally I don’t like the triangle option because it drags; can’t wait for the larger drop to occur in subminuette 5).
I have my doubts about the triangle as well. My reasons have to do with the large discrepancies noted for the start of the A wave. Many data feeds showed that it started at 1080, not 1072. That would make the B wave look even longer and more cumbersome.
There is no point in arguing which price is right, but it does IMO lower the odds of a triangle forming.
Price will likely remain in limbo until Weds 2pm, or a few hours before, and then we’ll have our answer.
The falling orange line is also being ignored as gold creeps sideways. The odds of a triangle forming are decreasing.
The C wave that should be forming (hourly triangle) is too long compared to the prior A & B waves. Another strike against the triangle idea IMO.
Gold is looking bearish today. DUST moving back up now
If my current analysis is correct, DUST should be falling now, and the drop could be hard. It was backtesting yesterday’s high of 36.90. I have two targets depending on two possible counts: 32.96 or 27.61.
Gold should not have dropped below 1194. Now it is resistance. It is critical to hold 1187 until tomorrow. If falls below 1187 I will go short buying DUST only.
One hour chart has HnS developing neck line from 1105 to recent 1103 and right shoulder at 1188.
Monday all the back testing are done in a small bounce.
Do you mean 1094 and 1087?
I meant 1087 not 1188.
“In real terms gold prices would have to fall to as low as $750, suggesting that even at current levels gold can still not be considered cheap.”
Starting The Week With a Big, Big Gold Bang
Monday July 27, 2015 18:03 Gary Wagner
http://www.kitco.com/commentaries/2015-07-27/Starting-The-Week-With-a-Big-Big-Gold-Bang.html
The carnage isn’t over in gold, other metals-mining stocks
July 27, 2015 4:27 p.m. ET
http://www.marketwatch.com/story/the-carnage-isnt-over-in-gold-other-metals-mining-stocks-2015-07-27?page=1
Tomorrow is Gold Options Expiration, which could trigger the move up for tomorrow. I missed the JDST buy this morning, i will look for it tomorrow or wednesday morning before FOMC.
I’d like to see the flat formation personally. Would be great for short set ups.
Thanks Ben.
GDX idea
Dreamer I also would prefer 1121 target as I have a little GDX and want to buy DUST cheap as I missed it today as focusing on Lara’s 1121 target and GDX.
DUST would be much cheaper at 1119 – 1121.
One of the hourly charts may be invalidated before the open.
That’s a 15% move in GDX from close today, if momentum is pulling down, I don’t think it will fill the breakdown gap on this try. Especially if Gold is heading to 1030’s. after that target it would then bouncing from there and that would then equate to the end of a 5 wave move for GDX in the 12’s or 11’s, and then it could head up and fill the gap.
Is this at all realistic???
Seems very optimistic – Personally would LOVE it to be true… but gold bears look in control.
Tham, thanks for comments on oil in 24 July forum.
Dreamer, thanks for your effort and comments answering my question about silver in 24 July forum. I watch parallel charts of gold, silver and gdx. Downside move by gdx has been much faster and deeper than norms compared to silver, possibly silver will move to catch up with gdx? We shall see.
You’re welcome.
Davey,
You’re looking for Silver charts?
Their is one Silver chart here around the middle of the article
with Silver dropping down to $6.25
Shows commodities, gold, silver, HUI, miners
Commodities and Precious Metals Next Leg Down
July 22, 2015, 11:15 pm by Rambus
http://rambus1.com/?p=41180
Richard, thanks. What I’m looking for is confirmation on silver’s expected major move down. Lara’s last silver chart showed silver moving down about 60% with gdx only about 20% yet to go. I ‘m just double checking the probability silver will be down so significantly.
Charts from different sources vary but they do tend to confirm silver downside may be significantly more than gdx.