
Upwards movement was unexpected.
I have two hourly Elliott wave counts for you today.
Summary: It is most likely a triangle has just ended a fourth wave correction. This should be followed by a fifth wave down which is highly likely to make at least a slight new low below 1,072 to avoid a truncation. The target is again 1,071. This first idea has a higher probability, maybe about 80%. Alternatively, a flat correction may be continuing, which would be confirmed if price moves above 1,105.18. If that happens, then upwards movement should continue to at least above 1,119, with the target at 1,121, but this has a low probability of about 20%.
To see weekly charts click here.
Changes to last analysis are bold.
ELLIOTT WAVE COUNT
Click chart to enlarge.
Cycle wave a is an incomplete impulse.
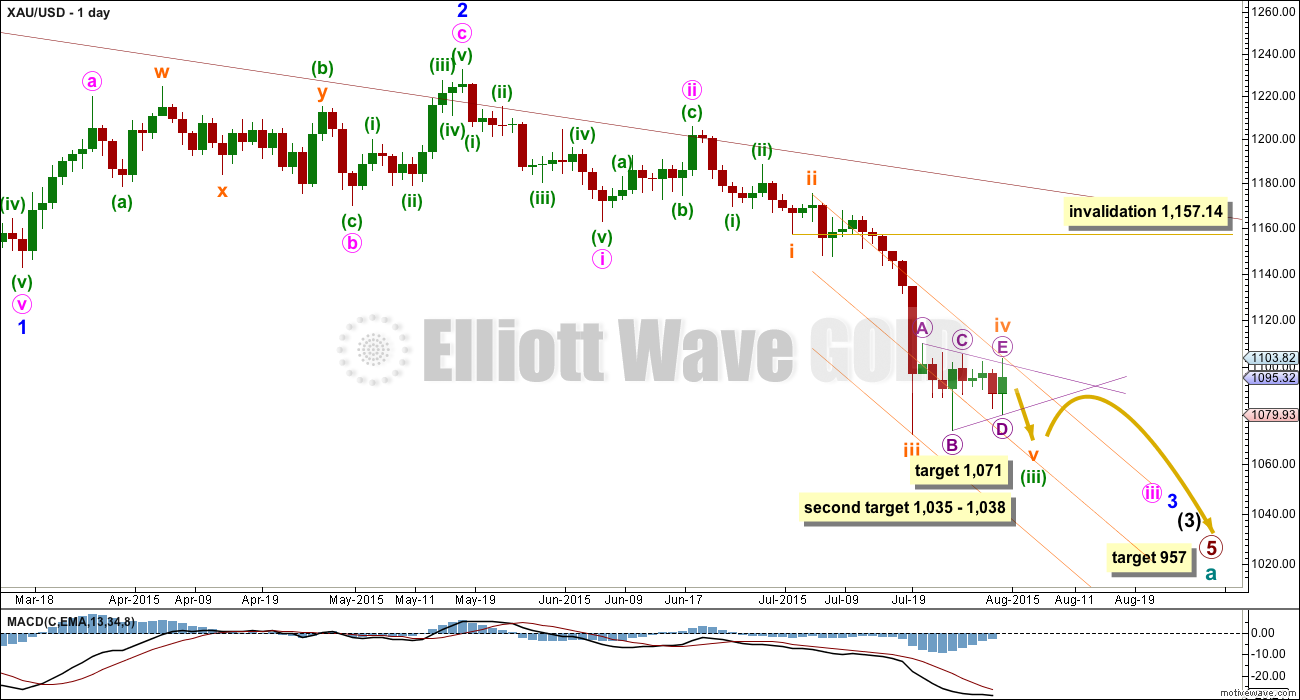
Within primary wave 5, the daily chart focuses on the middle of intermediate wave (3). Within intermediate wave (3), minor wave 3 now shows a slight increase in momentum beyond that seen for the end of minor wave 1 at the left of the chart. Third waves for Gold usually have clearly stronger momentum than its first waves, so I still expect to see a further increase in downwards momentum. The strongest downwards momentum may appear in a fifth wave somewhere within minor wave 3, or maybe the fifth wave to end minuette wave (iii) or minute wave iii, or that to end minor wave 3 itself.
Draw a base channel about minuette waves (i) and (ii) as shown (green trend lines). If the steeper orange channel is breached then look for the lower green trend line to provide resistance. Only if the upper green line is breached would I consider the wave count to be wrong.
Subminuette wave iii looks like it is over at the daily chart level. Subminuette wave iii has a typical curved look to it at the daily chart level and this wave count has the right look.
Subminuette wave iv may not move into subminuette wave i price territory above 1,157.14.
Subminuette wave iv was most likely a regular contracting triangle. The structure is clear on the daily and hourly charts. Subminuette wave ii was a relatively deep 0.58 zigzag lasting two days, and subminuette wave iv exhibits perfect alternation as a shallow 0.29 triangle lasting nine days. Zigzags are normally quicker than triangles, so some disproportion would be expected; the disproportion is now bigger but still acceptable.
Redraw the channel about minuette wave (iii) using Elliott’s second technique: draw the first trend line from the ends of subminuette waves ii to iv, then place a parallel copy on the end of subminuette wave iii. Subminuette wave v may end midway within this channel so add a mid line. Along the way down, upwards corrections against the trend should find resistance at the upper edge of this channel.
At 1,071 subminuette wave v would reach equality in length with subminuette wave i. At this stage, this would be my preferred target because fifth waves to follow fourth wave triangles are sometimes surprisingly short. The target would avoid a truncation.
If price reaches this target and the structure is incomplete, or if price just keeps falling through it, then a second target may be at 1,035 – 1,038; at 1,035 minuette wave (iii) would reach 4.236 the length of minuette wave (i) and at 1,038 subminuette wave v would reach 0.618 the length of subminuette wave iii.
Extend the triangle trend lines outwards. The point in time at which they cross may see a trend change. Sometimes this is when the fifth wave to follow ends. Sometimes it is a trend change within the fifth wave. If the fifth wave ends, then it may be a long extension and the lower target may be met.
Once price is below 1,072, look for the structure of subminuette wave v to be a completed five wave impulse on the hourly chart. Once that is clear, a subsequent breach of the upper edge of this orange channel would provide trend channel confirmation that minuette wave (iii) would be over and minuette wave (iv) would have begun.
Minuette wave (iv) should unfold sideways. It may be very shallow because minuette wave (ii) was relatively deep at 0.52. Minuette wave (ii) lasted three days and was an expanded flat. Minuette wave (iv) may exhibit alternation as another triangle or a zigzag most likely, and may last about five to eight days.
At 957 primary wave 5 would reach equality in length with primary wave 1.
MAIN HOURLY ELLIOTT WAVE COUNT
Click chart to enlarge.
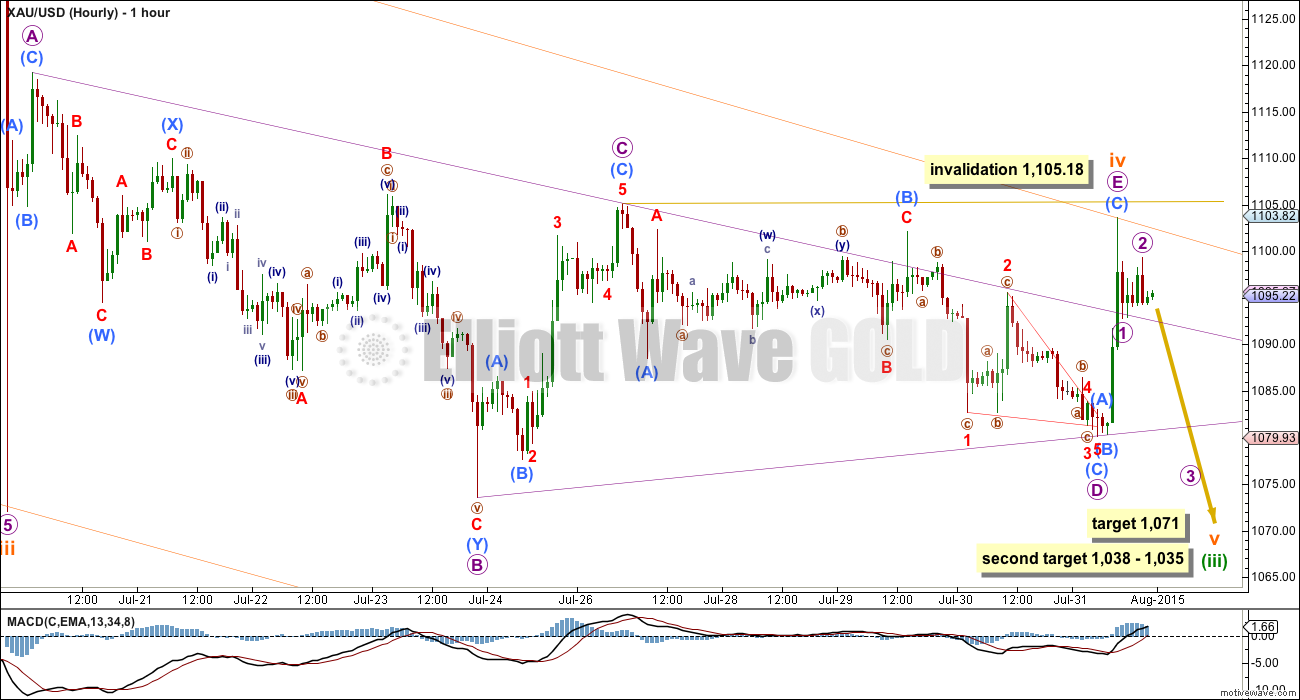
The triangle is still the neatest fit for this fourth wave correction and it has the best look so far at the daily chart level. I would judge this idea to have about an 80% probability.
At the daily chart level the upper A-C trend line is perfectly adhered to, but at the hourly chart level it is not. The overshoot for submicro wave (B) within the triangle is small though, which is acceptable.
Micro wave E ends with an overshoot of the A-C trend line. This is the second but less common way for E waves to end. The upper triangle trend line is so far providing support to downwards movement.
Subminuette wave v must subdivide as a five wave structure, either an impulse or an ending diagonal.
It is most likely to be relatively short, and reach equality with subminuette wave i in length. It may last about one to three days, with a shorter time frame more likely than longer.
Alternatively, it may be much longer lasting and extended to reach the second target.
Along the way down, micro wave 2 may not move beyond the start of micro wave 1 above 1,103.61. If that price point is breached, then the triangle for subminuette wave iv may not be over; if it is continuing, then micro wave E may not move beyond the end of micro wave C above 1,105.18.
If price moves above 1,105.18, then I would use the alternate below.
ALTERNATE HOURLY ELLIOTT WAVE COUNT
Click chart to enlarge.
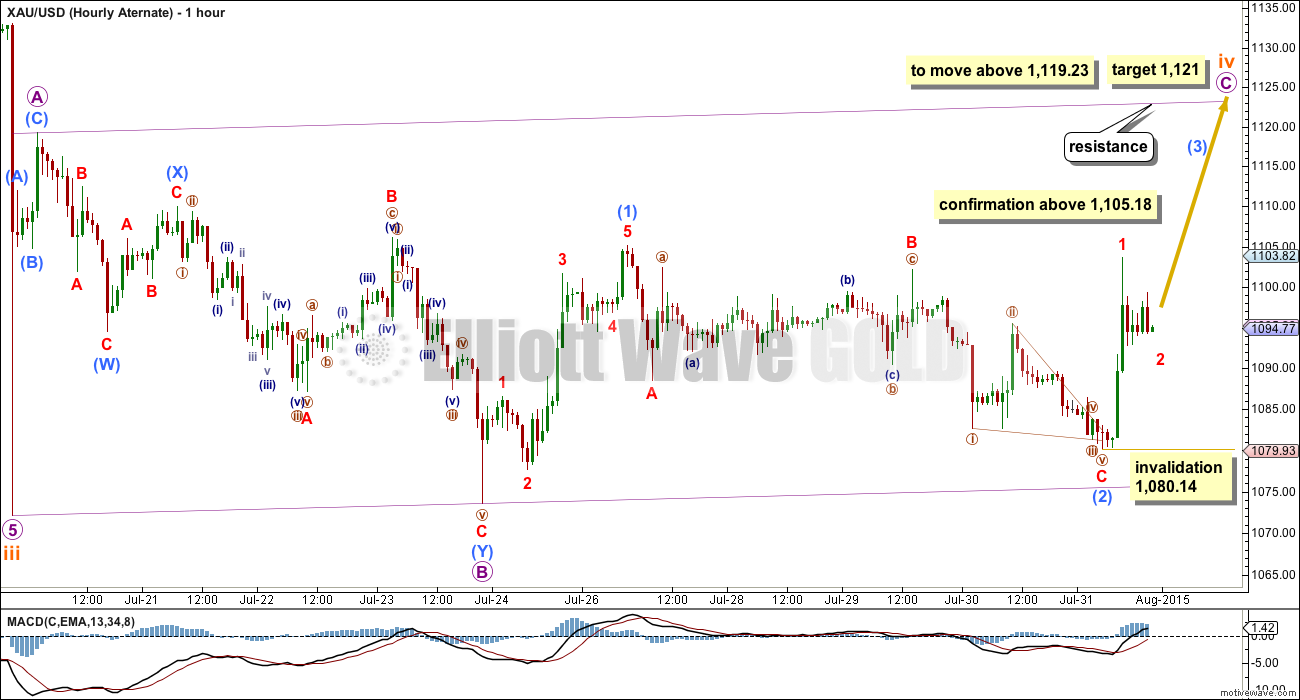
I have considered other structures. A combination does not work, because there is no flat correction within it, so this idea can be eliminated at this stage. A double zigzag would fit at the hourly chart level, but it would have completely the wrong look at the daily chart level. Double zigzags look like single zigzags, but they don’t move price sideways and should have a clear slope against the trend. This is very obviously a sideways movement, so I will discard the idea of a double zigzag.
By a process of elimination the only alternate I am comfortable with today is a flat correction.
This wave count has a very low probability because within micro wave C submicro wave (2) is huge. The proportion looks all wrong. But this is the best alternate that I can see, at this stage.
At 1,121 micro wave C would reach equality in length with micro wave A. This is a regular flat correction because micro wave B is between 90% and 105% of micro wave A at 97%, and a ratio of equality between the A and C waves is most common for a regular flat.
Regular flat corrections normally sit well within their parallel channels. Micro wave C would be likely to end when price touches the upper edge of the channel.
Micro wave C would be highly likely to move at least slightly above the end of micro wave A at 1,119.23 to avoid a truncation.
Within micro wave C, minuscule wave 2 may not move beyond the start of minuscule wave 1 below 1,080.14.
If this wave count is confirmed above 1,105.18 and this is how the fourth wave correction ends, then the following fifth wave down should be expected to be long, extended and very strong. Once the fourth wave is over, then a target for the final fifth wave can be calculated at two wave degrees. For now the target may likely be about 1,035 where minuette wave (iii) would reach 4.236 the length of minuette wave (i).
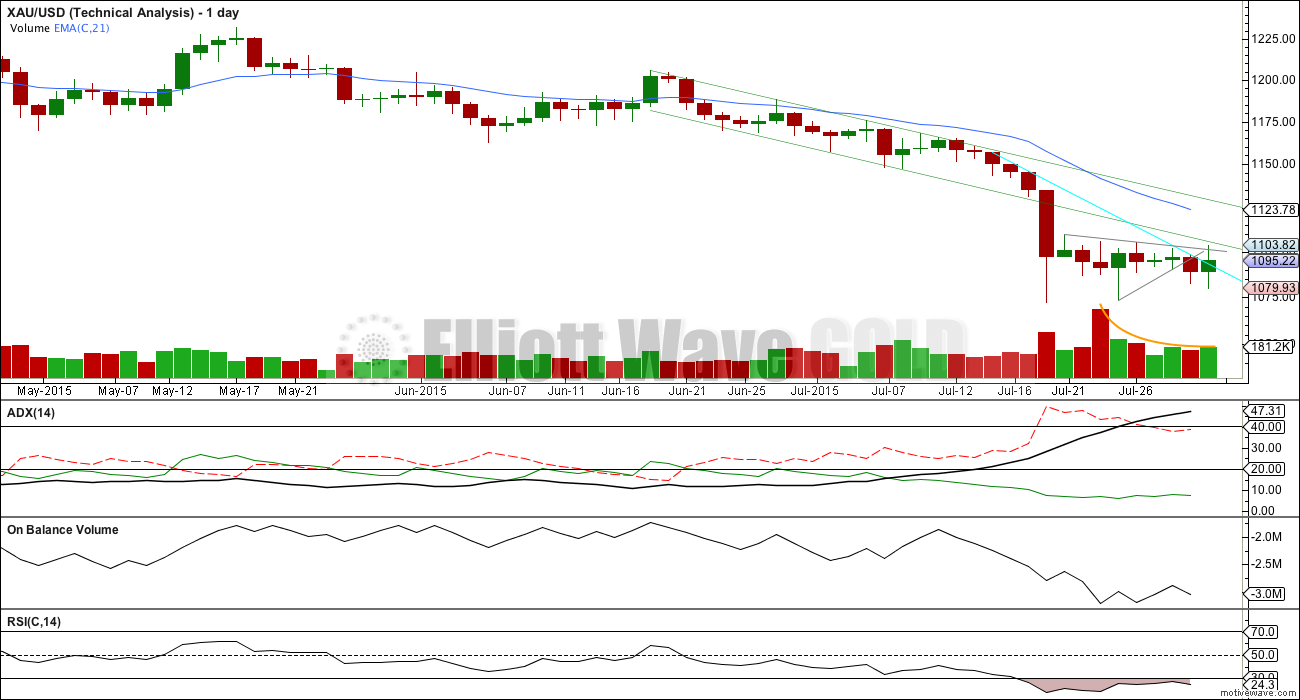
TECHNICAL ANALYSIS
Click chart to enlarge.
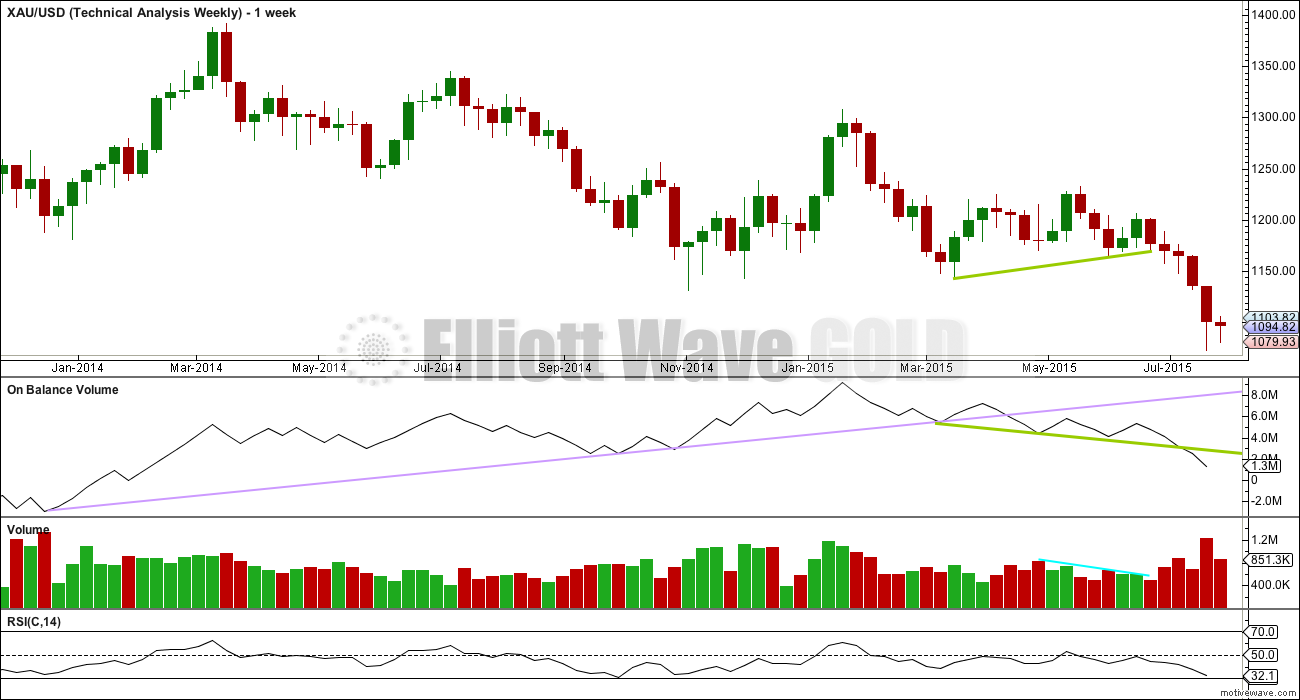
Weekly Chart: The lilac trend line on On Balance Volume has been breached, which is a longer term bearish indicator.
OBV is now breaking below the shorter green trend line, another bearish indicator.
As price falls volume is increasing and OBV is moving lower. This fall in price is supported by volume at the weekly chart level.
This week’s small doji indicates some indecision, which would be expected for a smaller correction against the trend. It comes with reasonable volume; volume continues to support the fall in price.
RSI is usually a fairly reliable indicator of lows. At the weekly chart level, RSI is still above 30 indicating there is room yet for Gold to move lower.
Click chart to enlarge.
Daily Chart: The small pennant pattern is still overall working well: a new low was seen before the high and the high is not substantially above the upper pennant trend line.
The aqua blue trend line is not working perfectly. It is not breached, but overshot with price closing above it. The lower edge of the green channel is now providing resistance (previously the lower line provided support).
The lower green trend line is more technically significant than the aqua blue trend line: the trend line is shallower and repeatedly tested. That line now should hold, but if it does not, then the alternate Elliott wave count may be correct.
ADX continues to rise during the formation of this consolidation. Despite price drifting sideways the trend continues to strengthen and remains down.
A trend following strategy should be used. Trading with the trend is advised. A mean reverting system which allows trades against the trend should only be used by the most experienced professional traders, and for all others it is strongly advised to never trade against the trend.
The simplest system for a downwards trend like this is to use resistance lines: each time price touches resistance that represents an opportunity to enter in the direction of the trend. Trades may be held until price either reaches support, a target, or if the trade is held for one day if you are a day trader. Depending upon your trading style, your risk management, and management of the equity in your account, stops as always are essential: they may be money management stops, they may be just above lines of resistance (allow for small overshoots), or they may be Elliott wave invalidation points.
Corrections against the trend offer an opportunity to join the trend at a good price.
This approach outlined here is just one trend following method of many.
There is a little positive bullish divergence last week: the low for 23rd July did not move below the prior low of 17th July, but On Balance Volume did make a new low. OBV moved lower while price did not. This bullish divergence indicates a correction against the trend to unfold, which is what has been happening. This correction should resolve this divergence.
Friday’s candlestick has equal upper and lower wicks representing a balance between bulls and bears, with bulls in favour as the candlestick is green. With lower volume, it looks like this day is the end of a consolidation against the trend and not necessarily the start of a new upwards trend. Overall the trend remains down.
This analysis is published about 05:16 p.m. EST.
If I still had DUST and it’s up 11% a strong day, I’d sell it now as usually starts adjusting around 3 pm end of day profit taking although I may be wrong?
Looks like you were right. DUST briefly dropped into the mid-37 area.
It looks still most likely that the triangle is complete and the fifth wave down is underway.
So far within subminuette wave v I can see four overlapping first and second waves; micro waves 1 and 2 , submicro waves (1) and (2) (submicro (2) was an expanded flat), minuscule waves 1 and 2 (a quick zigzag, lasted just one hour) and now nano wave i and ii. Nano wave iii is underway, the middle of the third wave.
To end micro wave 3 I would expect a swift strong fifth wave down, that may be the strongest part of downwards movement.
It looks like it will not complete today.
The two targets remain the same, at this stage I can’t say which one will be correct, the first one may be slightly more likely only because Gold tends to have short fifth waves after it’s fourth wave triangles. At this stage the first target at 1,071 still allows enough room for the structure to complete.
I am again concerned that volume is light today. And so the alternate wave count must be understood to still be viable today. The risk is the alternate could be correct. I’ll move the invalidation point down for the main wave count today to 1,097.90.
On the hourly chart when the triangle trend lines are extended out they cross over in two days time. That may be when this fifth wave ends. It may not, but it is still likely that a trend change will occur at that point in time.
Lara, thank you for the end-of-day update.
Do you still have an 80/20 ratio for main hourly likeliness over alternate?
Yes.
On further consideration the flat correction idea looks so unlikely today I want to discard it.
Because of low volume today the more likely alternate is that the fourth wave is not over and it’s ending wave D of the triangle, still to have wave E up.
The invalidation point for the E wave is at 1,103.61. It must end below that point. Most likely to fall short of the A-C trend line.
If price breaks below 1,073.56 the triangle must be over because D can’t move beyond the end of B.
Unfortunately the confirmation point is pretty much the same as the target for this move out of the triangle to end for the main wave count.
My concern today is volume is light, which may indicate the triangle is still unfolding. The market can fall of it’s own weight though, but strong volume on a downwards breakout does make the breakout more reliable. We don’t have that today.
**** PLEASE READ ABOVE***
Thanks Lara.
I think you misunderstood. She favours not the alternative over main count, but a different alternative than given last time.
Yes it’s just that she favors the triangle continuing rather than the flat as an alternate, but the main count, that we have begun wave 5 down, is favored overall as the most likely scenario.
Hi Alister
I expect up to 1103 area and then down to 1072 and beyond. Is that not correct?
No. I think she is saying that for this new alternative (triangle) we would have further downward movement (to end wave D) and then have wave E up to finish the triangle, but that E can’t go beyond 1103.61.
Yes, that’s what I was saying.
And it looks like the alternate triangle is correct now. And D is over, and now E up is underway.
Sold out of dust to take some profits off the table.
Added to nugt on a small size pot to gather a few percent on the basis that E wave doesn’t look to be over.
Has anyone else mirrored this?
Buying NUGT on a Lara’s big down day for gold is hazardous unless you are thinking of selling it within a few minutes.
The E wave looks 100% over to me.
Lara prefers 1 day for gold down to 1071.
I’d be afraid of buying NUGT today since DUST today only has had very minor reversals that may average about 10 minutes. If you got DUST profits great. But NUGT is investing against a long term clear gold downtrend.
The triangle has completed last week.
We are now in the 5th wave (subminuette 5) down to 1071.
The first two subwaves, micro 1 and micro 2, have completed.
The first subwave of micro 3 (submicro 1) has completed.
Now we are in submicro 2. This looks like a regular flat. I am expecting it to complete before loading up on DUST for the third of a third down.
I would not buy NUGT unless Lara’s alternate count is correct. For the main wave count, it is against the trend. Coupled with this, reversals in DUST has so far been very small, and so the losses incurred would be significant.
Tham, do you have an idea where submicro 2 might end?
Good question. And about how long until it ends? Today?
I did figure we were in subminuette wave 5 down and just making some minor corrections along the way.
Minimum 1093.43. But I am more inclined to think it would actually be about 1094.70.
Counting to smaller degree waves, we are currently just beginning the 3rd subwave of the c wave of submicro 2. Timewise, I reckon it should end pretty near to market close, and may more likely be in the after hours. Personally, I would load up on DUST before the close. I would also like to hear Lara’s view before doing that.
Thank you, Tham!
Alternatively, submicro 2 has already ended at 1093.43, and price is now moving down in submicro 3 and its first subwave looks like a leading diagonal. If so, I will wait for the rebound upwards before buying DUST.
Looks like it’s started.
Tham, this is all good news. Thank you so much for keeping on top of the counts. I have dust from the 30th and been waiting to see if the dust diamond breaks to the upside. Looks like here we go.
Gold price narrow range and in an inside day so far – likely build up for a break-away….
Syed, which way are you inclined to think it will break?
Looks like miners may be answering that Q for us now!
Hi Alister (sorry was away): Remains to be seen if Gold price can be kept pegged within and below 1093-97-98 range…. There is not much resistance overhead other than 1100-02 with layered support below at 1089-86-83…. Knowing that Gold price is bearish, down trending, I am inclined to keep it short with upside risk hopefully to break below 1083-80 with 1078-77 probably hard to take out….
Thanks Syed. Your point about support/resistance is well made. I took profits on DUST earlier, but it may well have been too early.
I bought DUST Friday based on Lara’s comments and already took profits today, however sold too early or would of doubled my profits. I didn’t buy bullish. I’ll just wait for another DUST low. Profitable with lower risk. Just have to stay with winning DUST longer.
I totally agree with you. I certainly didn’t sell Dust in order to go long. Hoping to get back into DUST lower.
Early release of ISM index shows drop to 52.7 in July – Aug 3, 2015 9:40 a.m. ET
http://www.marketwatch.com/story/early-release-of-ism-index-shows-drop-to-527-in-july-2015-08-03
US Dollar and stocks down with US news ISM report weaker than expected.
That tends to move gold up.
Ahead of the opening bell, data from the Commerce Department showed personal spending rose slightly less than expected in June, while income was slightly above forecasts.
Stocks edge lower as investors sift economic data – Aug 3, 2015 10:08 a.m. ET
http://www.marketwatch.com/story/us-stocks-on-pace-for-lower-open-2015-08-03
9:43am Dollar falls to 124.04 yen, from 124.20 yen ahead of the index
9:43am Dollar tumbles after ISM manufacturing index
This downwards movement looks awfully corrective. Any thoughts?
Agreed – not very much strength to it at all.
Miners are down a minimal amount.
This would fit with the idea that the E wave of the triangle is not over yet.
Worth exiting DUST then and looking for a better entry price?
I decided to play it safe/didn’t hold my nerve and took profit from Friday at 35.75.
36.25 now – hmmmm
Yes, I’m just stating the fact, not trying to imply I was smart/right! (Last week I saw overnight DUST profits evaporate during the day more than once.)
My comment was me mulling over whether to sell. Your input appreciated.
That’s always a comment I see when an impulse is beginning.
When third waves extend (which is very common) they necessarily begin with overlapping first and second waves. Then they increase momentum towards the middle, and the end of them can be very fast for Gold as their fifth waves can be explosive.
On the five minute chart it looks like fives down and threes up.
Thanks Lara yes it’s always a bit scary and not the easiest thing to be confident that 1s and 2s are unfolding!
Very true.
I know. We had a doubter here a couple of weeks ago, and it always happens. When you see a series of overlapping first and second waves psychologically it’s really hard to see a third wave developing. But that’s how they begin.
It hasn’t been the case this time, the alternate which saw the triangle continue looks like it’s the correct count.
Be we shall see it again. And people will doubt it again. And that’s okay.
According to Lara’s EW gold is close to bottom and miners are oversold. Below is Bullish sentiment of miners in daily Ranko chart.
A long term look at commodities.
http://blog.kimblechartingsolutions.com/2015/08/commodities-20-year-bear-market-in-play/
Gold EW Daily chart
https://www.dropbox.com/s/rvbminuv5q8eocg/gold%20daily%2002%20aug%2015.png?dl=0
Gold EW Weekly chart
https://www.dropbox.com/s/b6rchnt7tjv05mb/gold%20weekly%2002%20aug%2015.png?dl=0
IMHO Gold price appears to have hammered in good support at 1080/1077-76…. I would be watchful of the short side here to see if Gold price can get below pivot 1093-92… With a slowdown in momentum and ROC along with an upturn in MacdMA is indicating a possible short term rally / upward price movement to occur for Monday (risk Buy with stochastic %K crossed above %D which can easily go the other way) for likely take out of 1098 for a test check of 1100-04 range…. Trend is firmly down and bearish but Gold price appears to be showing some slack….
I like your posts. You use TA indicators for gold.
Can you list your indicators with parameters you use?
Have you been successful with these indicators?
Thanks in advance.
Hello and Good day @Papudi: The best indicator is right here where we are all at, EWG~!! But yeah, the bands are the goal posts or boundary lines, moving averages, support, resistance, RSI/MACD and retracement levels help, other than stochastic, CCI (its short), DMI (its down trending), ADX (is strong and rising though appears to have slowed down some) combined with parabolic SAR….. Really, gold price ought to be heading for 1041-1005…. Bearish for as long as Gold price remains below 200dma and bearish until signs of bottoming and reversal are not seen…. A snap rally / up turn during the week expecting though.
Now that Lara has eliminated bull wave count and it is almost certain gold is heading down time to short the ex long etf .
These 3xetf in PM sector have price decay. To take advantage of the decay one can short the long etf at top of major wave iv or corrective wave and hold for long time. Risk reward above the invalidation point.
Example: In Jan 2013 NUGT :
NUGT : short 1oo share at $ 80 amount $8000
NUGT reverse split two times 10 to 1 and 5 to 1.
At today one has only 2 shares at NUGT price $3 , total amount $ 6.
A long term trade with profit of 99%.
Short trade one can maximum is 100%.
Thanks for the update.
Lara, do you plan to make a new update on NZDUSD?
It went out of the trendline last week!
Yes.
Bulls Weigh on Gold as Losses Mount in Direxion Shares Exchange Traded Fund Trust (NYSEARCA:NUGT
July 31, 2015 By Paul Shea
http://learnbonds.com/122197/bulls-weigh-on-gold-as-losses-mount-in-direxion-shares-exchange-traded-fund-trust-nysearcanugt/
Late Friday Night Charts…PM Impulse Move Gaining Traction
July 25, 2015, 2:55 am by Rambus
http://rambus1.com/?p=41389
GDX EW chart July 31st Friday close
https://www.tradingview.com/x/AIyb2wa4
The Daily Sentiment Index based upon %BULLS polled as of July 30th (Thursday’s Close):
Gold 9.0% Bullish Sentiment
Silver 17.0% Bullish Sentiment
http://www.tag618.com/
The contrary investor studies crowd behavior in the stock market and aims to profit from partcular conditions where investors act on their emotions rather than reason. Such extremes of fear and greed are often seen at major market turning points, providing the astute contrarian with opportunities to both enter and exit the market.
The DSI or Daily Sentiment Index is a proprietary sentiment indicator from MBH Commodities in Chicago. The DSI shouldn’t be used as the start and end of a trading plan; Market sentiment is a component to a trade set-up / program. In other words, it is not a direct nor specific call to action but rather a sentiment based indicator that alerts traders to potential action – a timing trigger.
Always a surprise on features of this board!!! I posted a chart in my following post and then edited some typo but chart disappeared on repost?????
Here is the chart: GDXJ to GLD 2 hour.
Sorry!!!
I have watched the indicators on this GDXJ to GLD ratio chart: TSI (7,4,7), ADX (Lara inspired), MACD, OBV and RSI (5) x-over 5 and 3 ema.
The only thing I look every day is the TSI level in second panel above before looking at the price. If TSI is in the blue block above trade DUST long and if TSI is in bottom yellow block buy NUGT.
During the day regardless of what gold is doing if thi s ratio is trending that’s the miners direction.
Also watch D1+ (green) and D1- (red). When they turn and cross it alert the change in trend.
Current assessment: If ratio out of the 2 hour triangle down hold DUST position or if ratio BO to up sell DUST and buy NUGT.
According to Lara EW counts gold is in limbo up/down and the ratio also says so.
Study the chart most important for miner traders.
Same is true for GDX/GLD ratio.
Weekend gossip only!!!
BPGDM is bullish sentiment for miners. It is extreme at 0%. Whenever this indicator is at this level miners have rallied. But the 5 ma needs to cross 8ma from beneath.
Richard
what is gold sentiment??
LARA ****
The $BPGDM chart Papudi has above really concerns me that gold is about to bounce quick and high. Gold bounced high the last times gold hit extreme bottom.
November 7th gold bottomed then bounced $50
Demember 1st gold bottomed then bounced $80
July 20th gold bottomed then bounced $40
Yet you mention the bounce may be very shallow from the bottom in the next 1 – 3 days?
Just a rough guess that if gold drops to 1038 – 1035 it may bounce up $40.
The Daily Sentiment Index based upon %BULLS polled as of July 30th (Thursday’s Close):
Gold 9.0% Bullish Sentiment
Silver 17.0% Bullish Sentiment
It concerns me too.
I will take a closer look at this before markets open tomorrow (during Sunday NY) and will let you know.
Terrific, you are the best gold analyst, forecaster, and EW expert.
If the first target only is reached at 1,071 and then minuette wave (iv) bounces up to the 0.382 Fibonacci ratio of minuette wave (iii) that could be a $44 bounce.
As for this sentiment indicator and timing of a low, it seems it’s not exact.
For November the sentiment low was 4th Nov, and the price low was three days later on 7th November 2014.
For the huge bounce in price December 1st there was no sentiment low just before or even after that date. The low you see on Papudi’s chart was December 15th. After the huge bounce.
So no, I’m not concerned. It does not appear to be a reliable indicator, and if it is an indicator I would expect price to follow sentiment about three days later.
Which interestingly is what the Twitter study found as a relationship between sentiment and price, a three day lag.
Which actually fits with our EW count quite nicely.
So in three days time we may see a new price low. And from there a bounce. For a fourth wave.
Incidentally, minuette wave (ii) was an expanded flat so minuette wave (iv) may be a zigzag, it may be quick.
Lara may be correct. There is a lag oe few days. On chart 8ma and 5ma are far apart. when 5ma crosses above 8ma trend has change.
I am trying to relate to Lara’s EW projection and these indicators.
Rob
Welcome to EWG. Some of us are long time subs and love it.
I agree with you and have the same concern from COT data. Comm shorts last week dropped dramatically by 30000. That appears very bullish. But here EW analysis rules until the wave changes.
Lara is the best wave analyst that I know. Lately gold is been following EW count but do not know which one; Triangle or Flat. As you can see one is for bear and the other bull.
I do not have expertise in trading using COT data and have not found one yet.
Below is recent COT data which shows gold to go higher next week OR it already did in one day in a surprised move on Friday session??????
7/31 Commercial shorts 273993, Spec long: 180989
7/24 Commercial shorts 316862, Spec long: 183702
7/14 Commercial shorts 307511, Spec long: 189648
7/10 Commercial shorts 298834, Spec long: 192322
For shorts this should be concerning???????
Thanks Papudi. Watching the U.S. Dollar since it will have an impact on GLD/GDX. Today’s report on wage growth is at a 3 decade low made the dollar sell before it rallied back. If the dollar continues to sell next week with weaker job numbers than it should be good for Gld/GDX. I won’t play with Nugt/dust since too much risk. I see members here long dust which takes a lot guts since gold is at a 5 year low. Since Lara said that her pattern is 80% correct that’s pretty good odds for dust. Have a great weekend!
I’m just a beginner when it comes to EW, but it’s hard for me to understand why gold could go lower…I read for the 1st time since records began, hedge funds(speculators) are net short gold futures according to CFTC. Really, when gold is at a 5 year low. The previous time when gold was at the lowest net gold position was Oct. 2006, before gold rallied and peaked in March 2008 with almost a double in price. According to the CFTC, the commercial hedgers(smart money) have scaled down their short positions to one of lowest in years. The hedgers(smart money) don’t see much downside risk. I guess the trend is your friend until it ends. Full disclosure…I’m long GDX and GDXJ with a stop out close below last Friday’s low(7/24). Why Last Friday? GLD/GDX had an intraday reversal with big volume.
It is a complicated endless topic.
It you think gold can’t go any lower and it still does then I suggest you rethink your beliefs about gold or how you can profit with gold so you can move with the market and make some profits. I just want to figure out how the gold price will move.
Basically there are a lot of things in the marketplace that effect peoples sentiment towards gold and as the sentiment moves the price moves.
Let go of propaganda on fundamentals and of having a fixed mindset such as bullish.
Gold price moves up and down so I change my outlook and one day I’m bullish next may be bearish even if a billion people are now permanently bullish gold.
However sentiment is the % bullish people on for something like gold.
The more bullish the more people want it so the price goes up.
The less bullish the less % the market is bullish in gold and the price will go down.
Elliott Wave studies sentiment and then does a projection on the price of gold and the way the price will move in waves.
When gold was $1,921 in 2011 the market may of been 95% bullish gold so people were bidding up the price to an all time high.
Now the market may be 6% bullish in gold so less interest less bidding up the price so price drops. Lara thinks it hasn’t bottomed yet.
Just because someone thinks gold should be worth more has no effect on the price, however if a huge % of the market want gold because they think it is valuable then the price will be much higher.
Lara says not to trade against the trend unless you are very careful and skilled and wise. She recommends to trade with the trend.
So I follow her advice and I personally buy and sell DUST often on golds journey up and down.
Rob, I apologize for the long comment above. After I wrote it I decided to edit it then I decided to delete the whole thing. Unfortunately the system timed me out so my revision, then delete didn’t happen. Sorry and good luck with your trades.
Thanks for your sage advice. Best to you.
Hedgefunds and CFTC may be more accurate than regular investors but Elliott Wave is more accurate then them. I don’t follow them at all. A lot of Elliott Wave analysts don’t even read the business news as it doesn’t forecast gold movements in proven to be accurate and predictable ways.
Here are a few things that may make gold go lower.
If the US dollar or the stock market goes up.
It oil goes down.
If interest rates go up or people think they will go up soon.
The list is endlless however not an accurate way to predict gold movement like EW can.
and an important distinction; EW theory says it’s social mood which moves the markets, not what any other market is doing nor what politicians are doing or what the Fed is doing.
Social mood of market participants.
The big players are usually on the right side of the market, and the small players are usually on the wrong side of the market. At least, that’s why my TA textbooks tell me.
From an Elliott wave point of view the approach is very contrarian. If sentiment is at an extreme then EW expects the market to move in the opposite direction. It only works for extremes though I think.
So if sentiment is currently extremely bullish then an EW POV would expect more downwards movement.
Lara thanks for the good news. In your comments before the close you didn’t mention that gold may still drop way below 1071 down to 1035- 1038 area. I see we still have the much lower targets as a potential drop that is great.
“If price reaches this target (1071)and the structure is incomplete, or if price just keeps falling through it, then a second target may be at 1,035 – 1,038.”
I know, and I’m sorry Richard. What often happens is after I leave comments to go write up the analysis and finish the charts the process continues and I add or change things.
Lara nothing to be sorry for as it was only a quick comment and since I’m in DUST it is a plus that 1038-1035 is still possible.