
A small upwards correction was expected for the very short term, which is what is happening as the week comes to a close.
Summary: It is likely that Monday will see a little more upwards movement to 1,181 – 1,184. Thereafter, both bull and bear wave counts need more downwards movement. The bear wave count is more likely; it expects a strong third wave down is nearing its middle.
To see the bigger picture and weekly charts go here.
Changes to last analysis are italicised.
Bear Wave Count
Click chart to enlarge.
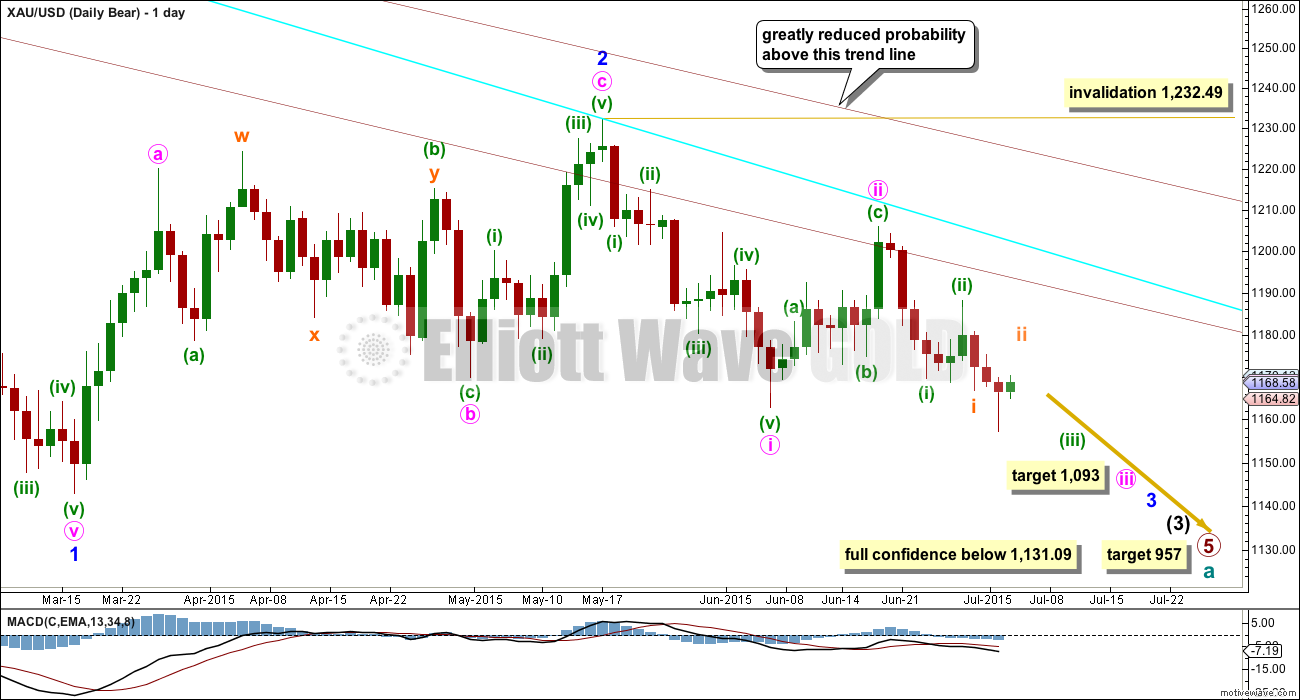
The bear wave count has increased in probability with a new low below 1,162.80. Full confidence may be had in this wave count with a new low below 1,131.09.
This wave count follows the bear weekly count which sees primary wave 5 within cycle wave a as incomplete. At 957 primary wave 5 would reach equality in length with primary wave 1.
Pros:
1. Intermediate wave (1) (to the left of this chart) subdivides perfectly as a five wave impulse with good Fibonacci ratios in price and time. There is perfect alternation and proportion between minor waves 2 and 4. For this piece of movement, the bear wave count has a much better fit than the bull wave count.
2. Intermediate wave (2) (to the left of this chart) is a very common expanded flat correction. This sees minor wave C an ending expanding diagonal which is more common than a leading expanding diagonal.
3. Minor wave B (to the left of this chart) within the expanded flat subdivides perfectly as a zigzag.
4. Volume at the weekly and daily chart continues to favour the bear wave count. Since price entered the sideways movement on 27th March, it is a downwards week which has strongest volume and downwards days which have strongest volume, five of them.
5. On Balance Volume on the weekly chart breached a trend line from back to December 2013. This is another bearish indicator.
Cons:
1. Intermediate wave (2) (to the left of this chart) looks too big on the weekly chart.
2. Intermediate wave (2) (to the left of this chart) has breached the channel from the weekly chart which contains cycle wave a.
3. Within minor wave 1 down, there is gross disproportion between minute waves iv and ii: minute wave iv is more than 13 times the duration of minute wave i, giving this downwards wave a three wave look.
4. Minor wave 2 is much longer in duration than a minor degree correction within an intermediate impulse normally is for Gold. Normally a minor degree second wave within a third wave should last only about 20 days maximum. This one is 44 days long.
Minor waves 1 and 2 are complete. Minute waves i and ii are also complete. Gold may be ready to move to the strongest middle of intermediate wave (3).
Minute wave ii may not move beyond the start of minute wave i above 1,232.49.
Minute wave ii is now very likely to be over here. If it moves any higher, then it should find strong resistance at the blue trend line.
At 1,093 minute wave iii would reach 1.618 the length of minute wave i. If minute wave iii ends in a total Fibonacci twenty one days, then this target may be reached in another ten days time.
Hourly Bear Wave Count
Click chart to enlarge.
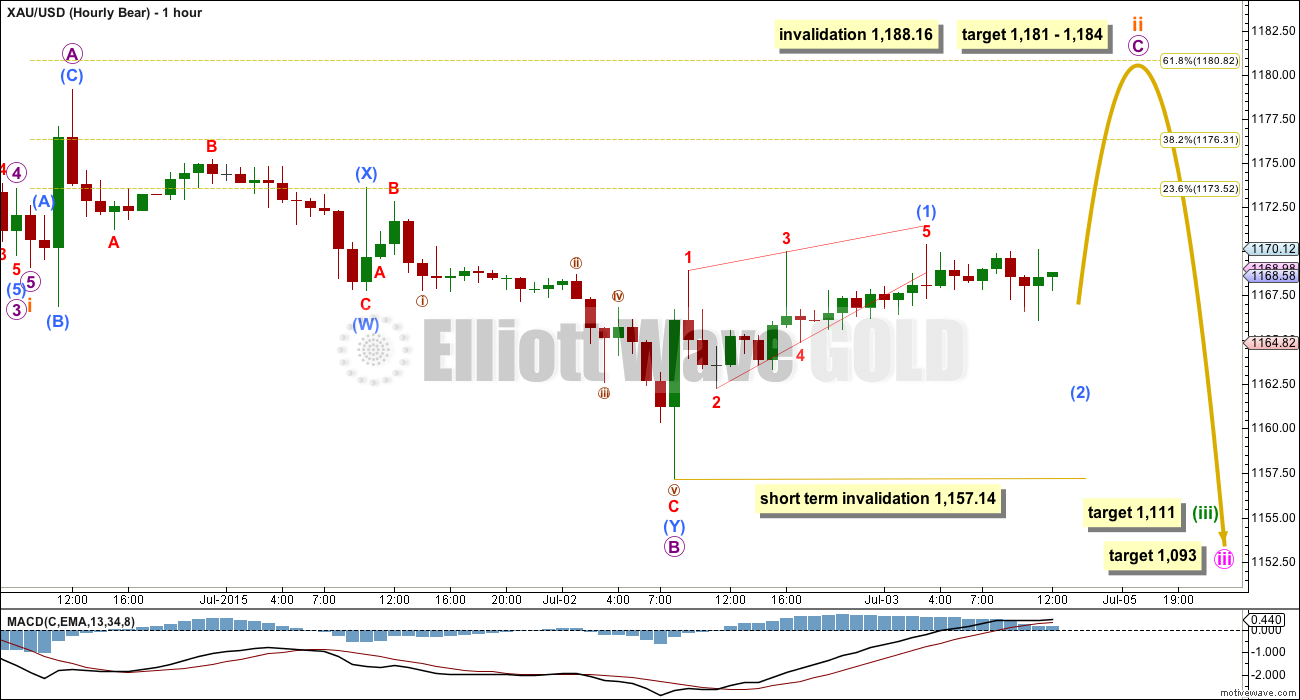
I am swapping over my main and alternate hourly wave counts because upwards movement for Friday shows on the daily chart as a green candlestick, and it would more likely the movement is part of subminuette wave ii and not micro wave 2 one degree lower (alternate below).
These two hourly charts work in exactly the same way for the bull wave count. The only difference there would be the degree of labelling which would be one degree lower.
Subminuette wave ii may be an incomplete expanded flat correction, subdividing 3-3-5. Micro wave C must be a five wave structure and is extremely likely to make at least a slight new high above the end of micro wave A at 1,179.17 to avoid a truncation and a very rare running flat.
At 1,184 micro wave C would reach 2.618 the length of micro wave A. This would bring subminuette wave ii close to the 0.618 Fibonacci ratio of subminuette wave i at 1,181.
Submicro wave (1) fits as a leading contracting diagonal, but the lower diagonal trend line does not look right. Diagonals normally adhere well to their trend lines. This one is breached and overshot reducing the probability of this part of the wave count, but this problem may resolve itself because this may also be labelled as a series of overlapping first and second waves, which may be followed by a short strong third wave and a series of fourth waves that remain above first wave price territories. Either way, the expected direction is still up for the short term.
Submicro wave (2) may not move beyond the start of submicro wave (1) below 1,157.14.
Mid term targets for the third waves remain the same. At 1,111 minuette wave (iii) would reach 2.618 the length of minuette wave (i). If minuette wave (iii) lasts a total Fibonacci eight or (more likely) thirteen days, then this target would still be four or nine days away.
At 1,093 minute wave iii would reach 1.618 the length of minute wave i. If minute wave iii lasts a total Fibonacci twenty one or thirty four days, then this target may be a further eleven or twenty three days away.
Alternate Hourly Bear Wave Count
Click chart to enlarge.
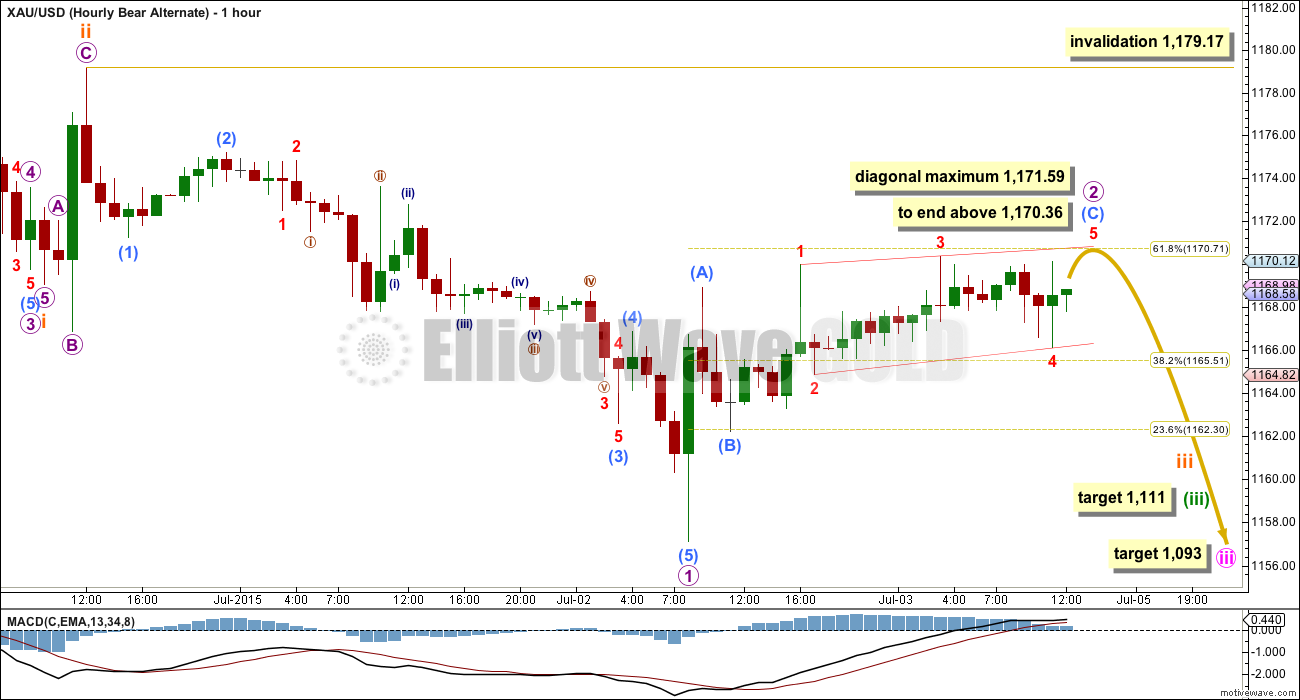
This idea has a big problem of proportion: micro wave 2 is much larger in duration than subminuette wave ii one degree higher. This reduces the probability of this wave count to an alternate today.
Micro wave 2 may be very close to completion, and within it submicro wave (C) is an almost complete ending contracting diagonal. The final fifth wave should make a new high above the end of the third wave at 1,170.36 to avoid a truncation, and it should be shorter than the third wave so it may not move above 1,171.59. A new high above 1,171.59 invalidates this diagonal because the third wave would then be the shortest violating a core Elliott wave rule.
Micro wave 2 may not move beyond the start of micro wave 1 above 1,179.17.
Bull Wave Count
Click chart to enlarge.
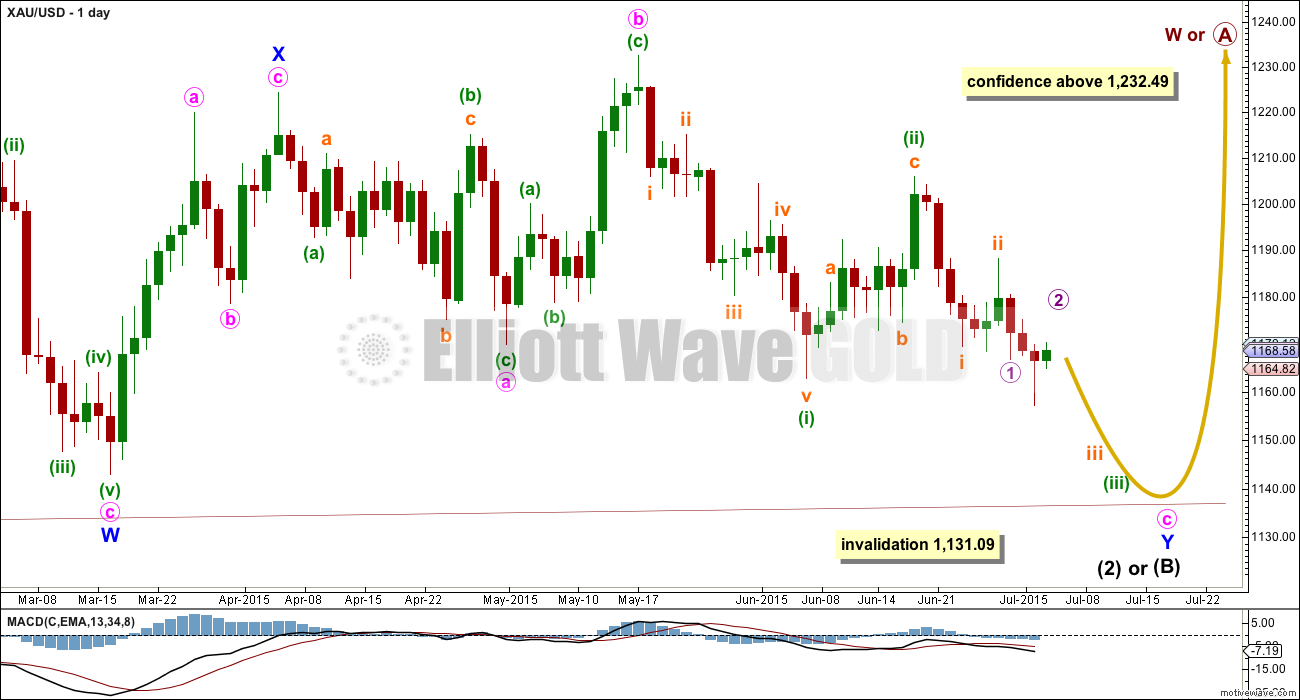
The bull wave count sees primary wave 5 and so cycle wave a a complete five wave impulse on the weekly chart.
Pros:
1. The size of the upwards move labelled here intermediate wave (A) (to the left of this chart) looks right for a new bull trend at the weekly chart level.
2. The downwards wave labelled minor wave W looks best as a three.
3. The small breach of the channel about cycle wave a on the weekly chart would be the first indication that cycle wave a is over and cycle wave b has begun.
Cons:
1. Within intermediate wave (3) of primary wave 5 (to the left of this chart), to see this as a five wave impulse requires either gross disproportion and lack of alternation between minor waves 2 and 4 or a very rare running flat which does not subdivide well. I have tried to see a solution for this movement, and no matter what variation I try it always has a problem which substantially reduces its probability.
2. Intermediate wave (5) of primary wave 5 (to the left of this chart) has a count of seven which means either minor wave 3 or 5 looks like a three on the daily chart.
3. Expanding leading diagonals (of which intermediate wave (A) or (1) is) are are not very common (the contracting variety is more common). There is also now a second expanding leading diagonal for minute wave i.
4. Volume does not support this bull wave count.
5. Intermediate wave (B) or (2) may only be continuing as a double combination. Minor wave X is shallow, and X waves within double combinations are normally very deep. This one looks wrong.
For volume to clearly support the bull wave count it needs to show an increase beyond 187.34K (30th April) and preferably beyond 230.3K (9th April) for an up day. Only then would volume more clearly indicate a bullish breakout is more likely than a bearish breakout.
Intermediate wave (A) (to the left of this chart) subdivides only as a five. I cannot see a solution where this movement subdivides as a three and meets all Elliott wave rules (with the sole exception of a very rare triple zigzag which does not look right). This means that intermediate wave (B) may not move beyond the start of intermediate wave (A) below 1,131.09. That is why 1,131.09 is final confirmation for the bear wave count at the daily and weekly chart level.
The only option now for the bull wave count is to see intermediate wave (B) or (2) continuing sideways as a double combination. The first structure in the double is a zigzag labelled minor wave W. The double is joined by a brief three in the opposite direction labelled minor wave X, a zigzag. The second structure in the combination is an expanded flat labelled minor wave Y which is incomplete.
Within minor wave Y, minute wave b is a 1.15 times the length of minute wave a indicating an expanded flat. Both minute waves a and b are three wave structures.
Minute wave c downwards must subdivide as a five, and because the first wave within it is an impulse and not a zigzag minute wave c may only be unfolding as an impulse.
Within minute wave c downwards, the third wave is incomplete for minuette wave (iii). At the hourly chart level, this bull wave count sees the subdivisions in exactly the same way as the bear (the bull sees everything one degree lower) so the hourly charts are the same. For this reason I will publish only hourly charts for the bear because they work in exactly the same way for the bull.
There does not look to be enough room for minute wave c to complete as a five wave impulse and remain above the invalidation point at 1,131.09. This is now the biggest problem with the bull wave count.
Technical Analysis
Click chart to enlarge.
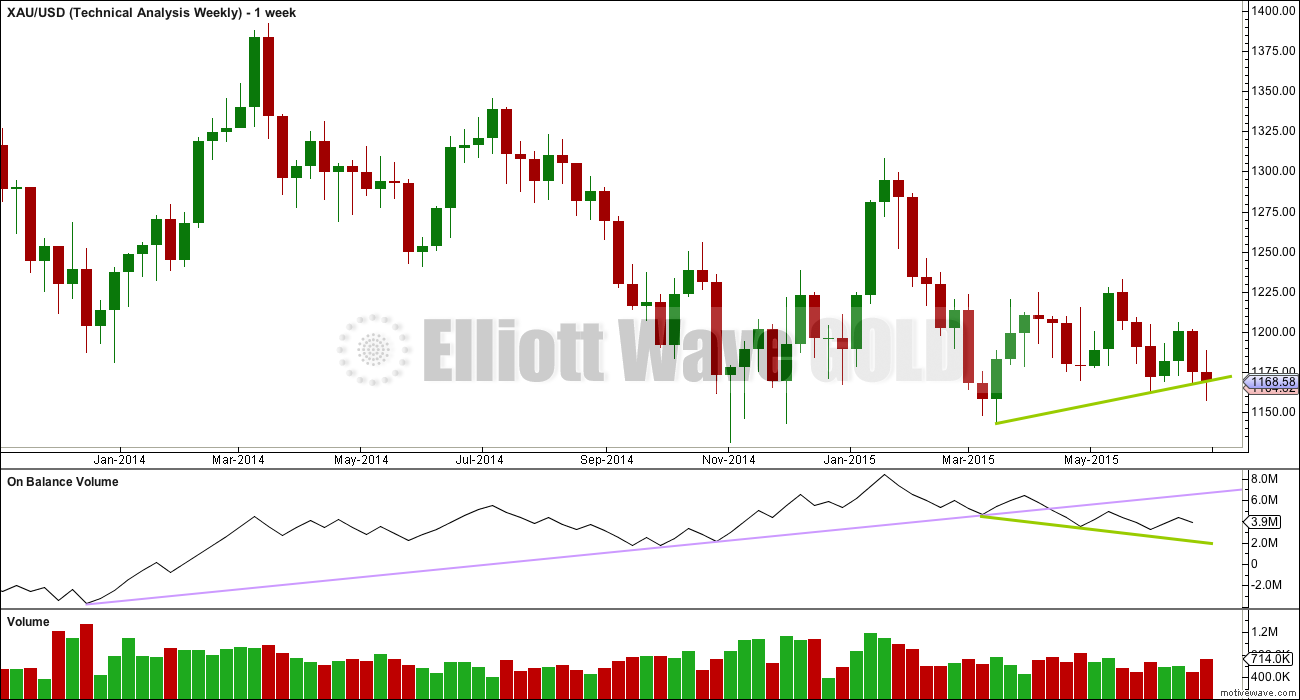
Weekly Chart: Overall volume still favours a downwards breakout eventually. During this sideways movement, it is still down days and a down week which have higher volume. On Balance Volume breaches a trend line (lilac line) which began in December 2013, and the breach is significant.
While price has made higher lows, On Balance Volume has made lower lows (green trend lines). This small rise in price is not supported by volume, and it is suspicious. Price is now breaking below support at the green trend line, which is another bearish indicator.
At the weekly chart level, volume is strongest in a down week. Overall volume is declining, typical of a maturing consolidation. Each series of down weeks includes a week with stronger volume than the following series of up weeks. The breakout should come very soon now and volume indicates a downwards breakout is more likely than upwards.
Despite a quiet day for Friday (due to the USA holiday), the week finishes with stronger volume. If a downwards breakout is beginning, then this is exactly what would be expected.
Click chart to enlarge.
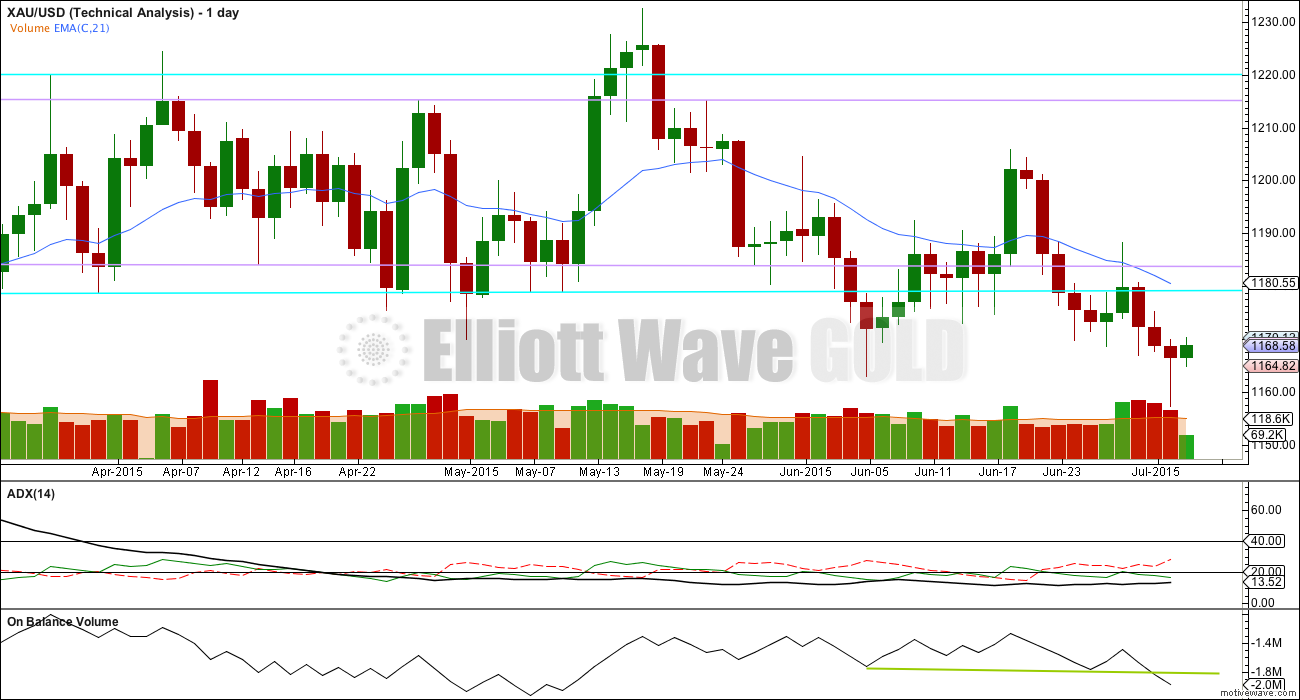
Daily Chart: While ADX still indicates no clear trend yet, price is making new lows. I will no longer illustrate a range bound trading system, because it is too risky to expect an upwards swing from here to be substantial. The sideways consolidation is now so mature the breakout is imminent; the breakout may be beginning now.
A close 3% or more of market value below the lower blue horizontal trend line would confirm a downwards breakout. That price point would be at 1,142.23.
The very low volume for Friday would be expected due to the USA holiday. It comes on an up day, indicating this upwards movement is likely a correction against a downward trend.
On Balance Volume at the daily chart level agrees with this week’s fall in price; there is no divergence between the last two lows.
I am moving the green trend line on OBV. OBV has broken through support at that trend line, and may show when price finishes the upwards correction when OBV touches the trend line again, which should now provide resistance.
Overall the regular TA picture is more bearish than bullish.
This analysis is published about 05:00 p.m. EST.
X-Large lots traded on GDX afterhours 6.6M+
Would this be long or short? What do you think?
I cannot get a wave count which sees subminuette wave i over at the low of 1,157 to work. It just won’t subdivide as an impulse and meet all EW rules.
So my conclusion is that more upwards movement should reach 1,181 – 1,184.
I’ll have just the one hourly wave count today.
Thank you.
And that’s the problem right there with trying to give you all a quick update in comments while I’m still working on the analysis.
I did manage to get it to work, it fits as a leading diagonal.
And when I looked further at the regular TA it looks like the upwards movement is over for today.
June FOMC meeting minutes will be published this Weds, for those interested. Along with EU decisions on Greece, expect another turbulent 48 hours.
thanks for reminder
Ben,
My thanks for your detailed post at bottom of this page. I am kindred spirit regarding:
” energy vibrations, and their hidden unconscious force, which is what attracts me to Elliott wave and Martin Armstrong. I chose to subscribe because I am not committed to becoming an EW expert, I’ll let Lara own that”.
I hope you will continue posting your trade strategies.
Awesome Davey. I will continue to post updates along the lines of what I am doing/thinking.
No changes in position today, and the COT looks awesome for longs from my perspective. And to be clear what I mean by that is I don’t see much downside risk in the next week or two, and I am willing to accept some downside in the miners (maybe 3-5% in GDX/GDXJ), but I will use that as a buying opportunity for a short swing trade.
JNUG hit $15.90 area premarket a few days ago, I would not be surprised to see that mark tested during market hours.
Lara Is the hourly bear still the preferred chart? Is the 1181-1184 still the target range and if so in how long and is it a 5 wave or an ABC wave up?
Good call by the way so far considering the wild Greek weekend that rocked the world.
It is, and I’m discarding the alternate bear.
I’m looking again to see if subminuette wave i could have been over at the low at 1,157 and not higher up.
If it can then it may be over now.
If I figure that out I’ll publish it. So far it has a few problems, I may need to spend some time on the five minute and one minute charts for it.
Lara, request for clarification:
“if it [subminuette i] can then it [???] may be over now.” Lara, not sure I follow you on the second it.
Maybe look for subminuette wave i on the daily chart maybe it didn’t end few days ago and ended today?
got it.
just wondering if Lara’s original Bear is correct, where are we on the upward movement target. Guess I need to wait. grrrr.
The target will be the same, 1,181 – 1,184.
The other idea I’m looking at sees upwards movement over.
starting to scale into jdst, hopefully it leads gold down!
Gold high of 1174.64 Sunday at 7:00 pm open. Gold just peaked so far today at 1174.57 at 1:00 pm, which is only 7 cents below Sunday’s high. Strange that Gold might still hit 1180 area? It looks like a big impulse wave up of $8 in 6 minutes just ended. That was the top of a 3rd or a 5th wave?
Most likely 1 of 3. Wave 3 or c is in 5 waves.
On closer examination, it looks like 3 of 3.
1174.57 at 1:00 pm was wave 3 of 3. Does that mean gold may NOT go up to 1180 area or that it may still go up to 1180 area?
I didn’t count 5 waves up yet for C.
Hi Tham. Wondering if you think 4 of three is near completion?
Know that you sure will be missed while you are on vacation.
Thought about it for a while and said to myself, hmm if Tham’s going on vacation, based on position of gold in EW, maybe an entry soon won’t need too much management. Wouldn’t that be nice! Trying to catch 3rd wave down, like you. Next want to go on vacation like you! lol. 🙂
Thanks dsprospering for your kind words. I will try to come on at least briefly while I am away, especially when I sense that the market is behaving weirdly, as of late.
🙂
Oil getting hammered!!!
looks like we’ll be getting some new counts??
Nothing invalidated. However we will just get the new analysis as usual.
This is what I make of the price movement so far.
Let us first look at the material facts to eliminate what cannot be, so as to establish an illuminating path.
One thing for sure, the diagonal for the alternate bear is invalidated with movement above 1171.59.
The alternate bear will be invalidated if price moves above 1179.17.
The bear expects price to move above 1179.17 to avoid a truncation, so 1179.17 may be a divergence point for the two.
The bear expects 5 waves up while the alternate bear expects an ABC 3 waves.
The bull can still move higher but not higher than 1187.61. The current movement must be in three waves as this is a second wave correction micro 2.
Lara has counted 5 waves up at 1170.34. This is most likely not the end of the rise but only submicro 1 for the bear and submicro a for the alternate bear.
Since price movement went higher to 1174.64, wave submicro 2 (or submicro b) must be an expanded flat 1170.34-1166.09-1174.64-1162.96.
Price is now rising in wave submicro 3 (or submicro c). I am waiting for this upward swing to end before loading up on shorts. Hopefully, it could happen by tomorrow. I am going on a 1 week short holiday beginning Wednesday. Good luck guys.
Tham, I appreciate your insight and strategy on count and buying. I will do the same and wait for near term top and then buy DUST at a cheaper price than now. DUST has already dropped $1.41 or 7% of today’s high of 19.28. Meanwhile I have a good lookout spot on the fence. Lara may add her insight before the close.
Thanks Richard. I am also in cash now. The risk-reward ratio is too poor to trade the countertrend.
Lara advised that if gold went above 1171.59 than should go above 1179.17.
However I was expecting that would happen last night. Instead Gold opened at 1174.64 at 7:00 pm then dropped to 1162.96 at 9:20 am. Possible retrace .618 of that is 1170.18.
Any wave counts or opinions on retrace targets etc?
Could gold have just completed a B wave, with C up to come (or in progress)? I really don’t like making calls against the trend, but I am leaning this way. Any one else have any thoughts?
Alternatively, upward movement could be a smaller 2nd wave….
Although gold generally went up then down as per both Lara’s hourly charts it didn’t follow the targets of either of them.
It followed the Hourly bear.
Clive Maund gold update:
http://www.clivemaund.com/article.php?art_id=68
Thanks to the regular contributors, whose comments I follow giving me a broader spectrum of things…. My two cents worth: Gold price had a very tight / narrow $5-6 trade range on Friday finding resistance at 1169-70 and looks to me unlikely for Gold price to break above here / 5dma with the regression channel at 1172 just above for a drop to take out 1159-57 for 1153-52…. In any case I would look for sell short signals anywhere between 5dma/20dma….
Hi Lara, any chance for a GDX update sometime soon? Many thanks, Bob
Yes, I’ll do it today.
Lara, I forgot to thank you for the silver analysis you did the other day. Thanks for putting the time in on that.
You’re most welcome.
The real reason gold has been falling – July 3, 2015 11:11 a.m. ET
http://www.marketwatch.com/story/the-real-reason-gold-has-been-falling-2015-07-02?mod=MW_story_recommended_default&Link=obnetwork
I’m not in front of a computer right now – so I can’t verify this – but, on the surface, it looks like there is a very clear trend line that can be drawn beneath the November, March and current lows. In hindsight, this is an obvious point for an upside correction. This gives me a little more confidence in Lara’s call for a bounce here.
Yes you are correct. Check pmbull ‘weekly’ time frame and bottomed or very slightly below trend line Beginning of November, middle of March and this week.
On the ‘daily’ time frame gold went below the trend line one or a few days.
That is no guarantee gold will bounce again.
Although I am curious what EW makes of those 2 big bounces will it happen again?
http://www.pmbull.com/gold-price/
Yes, there are no guarantees. I am mostly fearful of trying to profit on upward movement at this time and I certainly won’t let go of my longer term short position. Bounces for me are mainly opportunities to add to shorts, but I am super skeptical that real bounces will occur.
It is pretty clear, yes. And on a semi-log scale price is not quite touching it.
This may illustrate the trend line you refer to. In addition to the trend line, there is a falling wedge and multiple H&S patterns in play. Key point for the market. Chart from ThirdEyeOpenTrades on public stockcharts.
Ben,
I follow your posts with interest as I am open to learn from success. If I understand your posts for last several days, you tend to follow EW for long and mid term but rely on quantity of options bought and sold for short term decisions.
Is that correct? Would you explain your strategy?
Thanks
My ‘strategy’ is currently in development….
I am a believer in quantum physics, energy vibrations, and their hidden unconscious force, which is what attracts me to Elliott wave and Martin Armstrong. I chose to subscribe because I am not committed to becoming an EW expert, I’ll let Lara own that.
Overall here is what I occupy my analysis with:
1) hypothesis of what capital flow could look like in the short and medium term. This could be looking at correlative moves/inverse moves from dollar/yen/bonds/gold etc. so I’m always looking at these to see what those technicals are doing. I have a few main hypothesis, and I bet others do too because they are all waiting to be confirmed one way or another. Something big is coming in the world markets, and I think all of this sideways movement taking so long is so the right people can get better and better positioned for when it does happen. Not just gold, but all markets, especially currency and bonds.
2) I follow Lara and Avi’s site for EW analysis. I prefer Lara hands down and use Avi for helping to keep me honest. Plus the folks he has over there have helped me profit on some other non-gold trades.
3) COT and BPR analysis, I’ve created some ways that I observe extremes in recent trends (I don’t look at a given week, it’s all in the context of the trends of positions). The further the extreme, the likelihood of medium term trend change. I usually just look at swaps and MMs for futures.
4) futures and options open interest volume and at what strike price. Option writers make the money, option purchasers lose more often. So once again I look at where extreme commitment is coming in. Like this week, there was no way GDX was getting over $18.50 with over 20,000 option contracts out of about 30,000 TOTAL all sitting on the $18.50 call strike. Same with the 17th, there are over 40,000 contracts at $18 and $18.50 on the put side. It’s LIKELY gdx is higher than these on July 17th.
5) I look at short term technicals like 15 and 60 minute charts to see when RSI and MFI get oversold.
6) I look at etf Money flows reports to look for clues. GDX and NUGT have over $400 million each positive money flow since May 18th. I haven’t figured out if this is smart money, dumb money, or short covering yet…
Finally, I take all of this together and try to see what gets narrated out of it all. That’s where I develop my point of view that there will be enough sideways and up action that Gold will stay high enough over the next 8-10 trading days such that GDX recovers about 6% – 9% into options expiration. And I am prepared for a drop yet this week before the move up into opex.
I say it’s all in development because I’m trying to design what works for me. Using these elements I’ve been able to reduce risk and increase probability of positive returns. BUT, I still lose money, like my USLV which is underwater by about 5% right now. This is one of my no-mans land trades. I should have sold it options and futures expiration week when my original plan didn’t amount to much. But it’s a small position so looking at other data, I felt it was low risk to keep it for a little while longer.
I’ve had quite a few good grades this year on short term swings, but my tendency has been to hold short term trades too long ending up in this middle no-mans land of more than a day trade, less than a multi week swing….I’m beginning to change that so I have some positions for weeks/months and some are strictly for positions that last a day or two tops.
Last year I lost about 3%. This year I’m up about 72% so far.
In short, im still figuring out my strategy, and I’m sure some on this board wonder what I’m doing sometimes with my positions. But I’ve got to experience it with real plans, real money and real emotions in order to develop myself.
Hope that helps you see a little of where I am coming from!