
Upwards movement was expected for Monday, which is what happened.
Summary: It looks like upwards movement may be over for now: a second wave correction looks complete and today’s volume spike indicates the end of this correction. A third wave down may be ready to begin. Alternatively, it is still possible the correction may move higher to 1,181 – 1,184.
To see the bigger picture and weekly charts go here.
Changes to last analysis are bold.
BEAR WAVE COUNT
Click chart to enlarge.
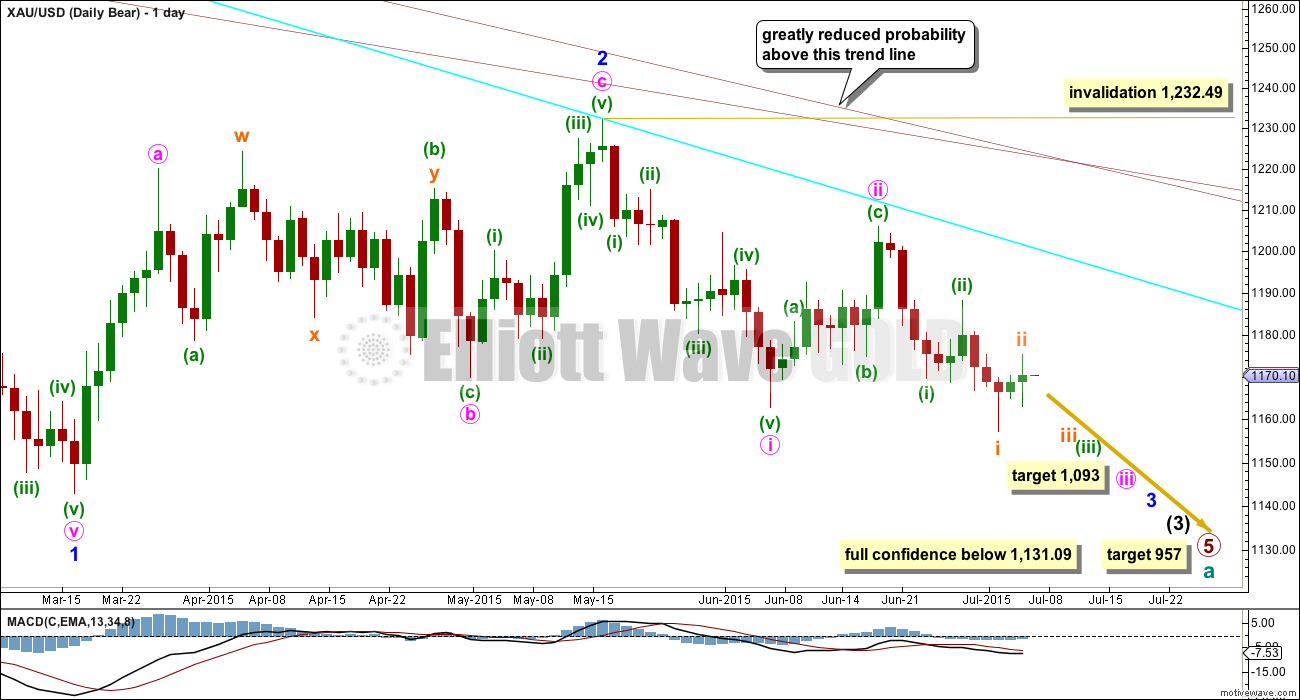
The bear wave count has increased in probability with a new low below 1,162.80. Full confidence may be had in this wave count with a new low below 1,131.09.
This wave count follows the bear weekly count which sees primary wave 5 within cycle wave a as incomplete. At 957 primary wave 5 would reach equality in length with primary wave 1.
Pros:
1. Intermediate wave (1) (to the left of this chart) subdivides perfectly as a five wave impulse with good Fibonacci ratios in price and time. There is perfect alternation and proportion between minor waves 2 and 4. For this piece of movement, the bear wave count has a much better fit than the bull wave count.
2. Intermediate wave (2) (to the left of this chart) is a very common expanded flat correction. This sees minor wave C an ending expanding diagonal which is more common than a leading expanding diagonal.
3. Minor wave B (to the left of this chart) within the expanded flat subdivides perfectly as a zigzag.
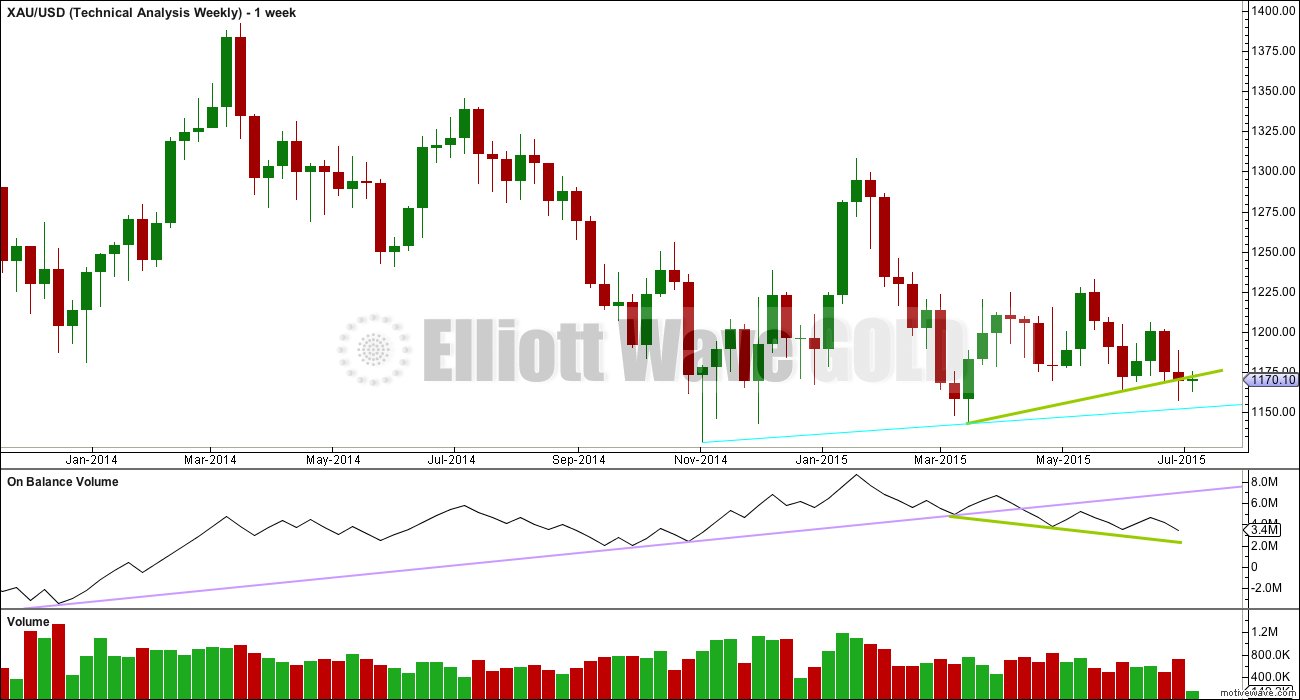
4. Volume at the weekly and daily chart continues to favour the bear wave count. Since price entered the sideways movement on 27th March, it is a downwards week which has strongest volume and downwards days which have strongest volume, five of them.
5. On Balance Volume on the weekly chart breached a trend line from back to December 2013. This is another bearish indicator.
Cons:
1. Intermediate wave (2) (to the left of this chart) looks too big on the weekly chart.
2. Intermediate wave (2) (to the left of this chart) has breached the channel from the weekly chart which contains cycle wave a.
3. Within minor wave 1 down, there is gross disproportion between minute waves iv and ii: minute wave iv is more than 13 times the duration of minute wave i, giving this downwards wave a three wave look.
4. Minor wave 2 is much longer in duration than a minor degree correction within an intermediate impulse normally is for Gold. Normally a minor degree second wave within a third wave should last only about 20 days maximum. This one is 44 days long.
Minor waves 1 and 2 are complete. Minute waves i and ii are also complete. Gold may be ready to move to the strongest middle of intermediate wave (3).
Minute wave ii may not move beyond the start of minute wave i above 1,232.49.
Minute wave ii is now very likely to be over here. If it moves any higher, then it should find strong resistance at the blue trend line.
At 1,093 minute wave iii would reach 1.618 the length of minute wave i. If minute wave iii ends in a total Fibonacci twenty one days, then this target may be reached in another nine days time.
HOURLY BEAR WAVE COUNT
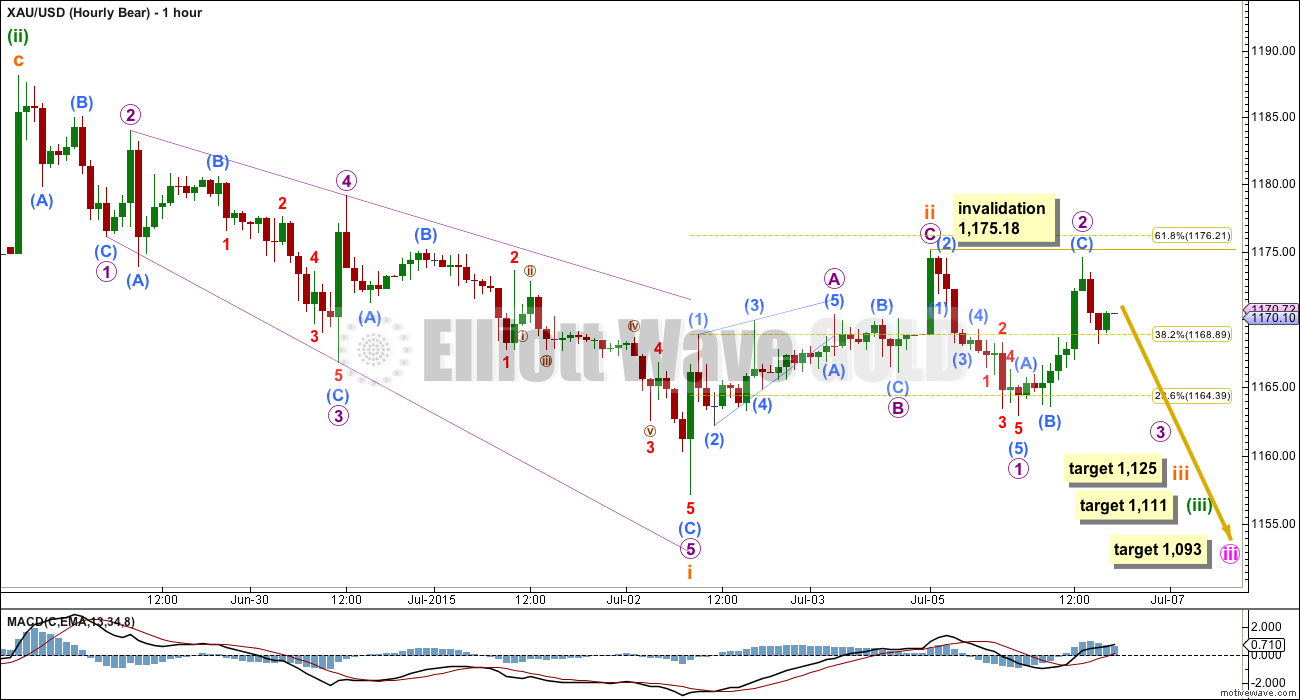
Click chart to enlarge.
This hourly chart, and the alternate hourly below, work in exactly the same way for the bull wave count. The only difference for the bull wave count is the degree of labelling would be one degree lower.
Because today’s session has ended with a strong spike in volume, that may indicate the end of the correction.
I wanted to see if subminuette wave i could be over at the last low rather than higher up. While subminuette wave i will not fit as an impulse that meets all Elliott wave rules, it will fit as a leading expanding diagonal. The fit is quite good and all its rules are met.
Within a leading diagonal, sub waves 2 and 4 must be zigzags and sub waves 1, 3 and 5 are most commonly zigzags, and the fourth wave should overlap first wave price territory. Within this leading diagonal the waves are lengthening, the trend lines diverge, and the diagonal is expanding.
Subminuette wave ii may be a complete zigzag falling just short of the 0.618 Fibonacci ratio and showing up on the daily chart as two green candlesticks. At the daily chart level this idea has the best look, and is another reason I consider this wave count more likely.
Mid term targets for the third waves remain the same. Now at 1,125 subminuette wave iii would reach 1.618 the length of subminuette wave i. This target may be five days away.
At 1,111 minuette wave (iii) would reach 2.618 the length of minuette wave (i). If minuette wave (iii) lasts a total Fibonacci thirteen days, then this target would be nine days away.
At 1,093 minute wave iii would reach 1.618 the length of minute wave i. If minute wave iii lasts a total Fibonacci twenty one or thirty four days, then this target may be a further ten or twenty three days away.
ALTERNATE HOURLY BEAR WAVE COUNT
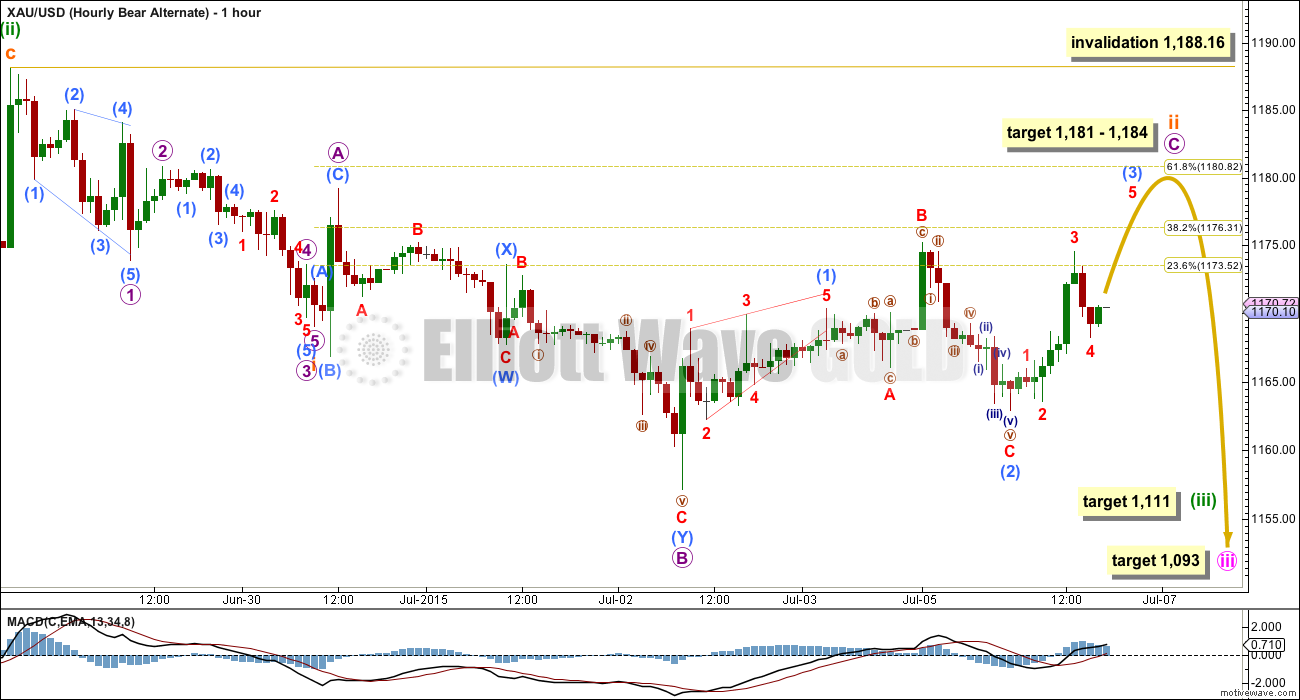
Click chart to enlarge.
Subminuette wave ii may still be an incomplete expanded flat correction, subdividing 3-3-5. Micro wave C must be a five wave structure, and is extremely likely to make at least a slight new high above the end of micro wave A at 1,179.17 to avoid a truncation and a very rare running flat. However, in this instance a running flat may occur due to the strong downwards pull of the middle of a big third wave. This is the kind of situation where running flats show up.
At 1,184 micro wave C would reach 2.618 the length of micro wave A. This would bring subminuette wave ii close to the 0.618 Fibonacci ratio of subminuette wave i at 1,181.
Submicro wave (1) is still seen as a leading contracting diagonal, and submicro wave (2) now a completed expanded flat. Submicro wave (3) is an incomplete impulse. When it is done, then submicro wave (4) may not move below 1,168.73 because it may not move back into submicro wave (1) price territory.
BULL WAVE COUNT
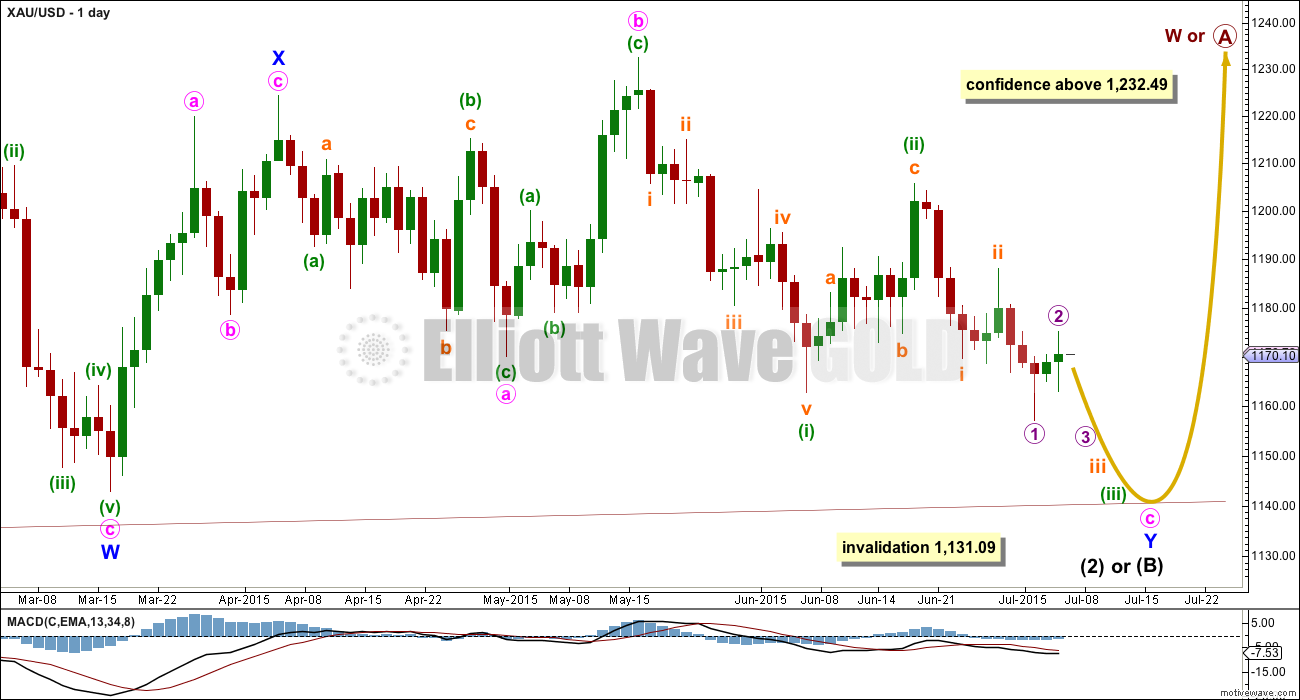
Click chart to enlarge.
The bull wave count sees primary wave 5 and so cycle wave a a complete five wave impulse on the weekly chart.
Pros:
1. The size of the upwards move labelled here intermediate wave (A) (to the left of this chart) looks right for a new bull trend at the weekly chart level.
2. The downwards wave labelled minor wave W looks best as a three.
3. The small breach of the channel about cycle wave a on the weekly chart would be the first indication that cycle wave a is over and cycle wave b has begun.
Cons:
1. Within intermediate wave (3) of primary wave 5 (to the left of this chart), to see this as a five wave impulse requires either gross disproportion and lack of alternation between minor waves 2 and 4 or a very rare running flat which does not subdivide well. I have tried to see a solution for this movement, and no matter what variation I try it always has a problem which substantially reduces its probability.
2. Intermediate wave (5) of primary wave 5 (to the left of this chart) has a count of seven which means either minor wave 3 or 5 looks like a three on the daily chart.
3. Expanding leading diagonals (of which intermediate wave (A) or (1) is) are are not very common (the contracting variety is more common). There is also now a second expanding leading diagonal for minute wave i.
4. Volume does not support this bull wave count.
5. Intermediate wave (B) or (2) may only be continuing as a double combination. Minor wave X is shallow, and X waves within double combinations are normally very deep. This one looks wrong.
For volume to clearly support the bull wave count it needs to show an increase beyond 187.34K (30th April) and preferably beyond 230.3K (9th April) for an up day. Only then would volume more clearly indicate a bullish breakout is more likely than a bearish breakout.
Intermediate wave (A) (to the left of this chart) subdivides only as a five. I cannot see a solution where this movement subdivides as a three and meets all Elliott wave rules (with the sole exception of a very rare triple zigzag which does not look right). This means that intermediate wave (B) may not move beyond the start of intermediate wave (A) below 1,131.09. That is why 1,131.09 is final confirmation for the bear wave count at the daily and weekly chart level.
The only option now for the bull wave count is to see intermediate wave (B) or (2) continuing sideways as a double combination. The first structure in the double is a zigzag labelled minor wave W. The double is joined by a brief three in the opposite direction labelled minor wave X, a zigzag. The second structure in the combination is an expanded flat labelled minor wave Y which is incomplete.
Within minor wave Y, minute wave b is a 1.15 times the length of minute wave a indicating an expanded flat. Both minute waves a and b are three wave structures.
Minute wave c downwards must subdivide as a five, and because the first wave within it is an impulse and not a zigzag minute wave c may only be unfolding as an impulse.
Within minute wave c downwards, the third wave is incomplete for minuette wave (iii). At the hourly chart level, this bull wave count sees the subdivisions in exactly the same way as the bear (the bull sees everything one degree lower) so the hourly charts are the same. For this reason I will publish only hourly charts for the bear because they work in exactly the same way for the bull.
There does not look to be enough room for minute wave c to complete as a five wave impulse and remain above the invalidation point at 1,131.09. This is now the biggest problem with the bull wave count.
TECHNICAL ANALYSIS
Click chart to enlarge.
Weekly Chart: Overall volume still favours a downwards breakout eventually. During this sideways movement, it is still down days and a down week which have higher volume. On Balance Volume breaches a trend line (lilac line) which began in December 2013, and the breach is significant.
While price has made higher lows, On Balance Volume has made lower lows (green trend lines). This small rise in price is not supported by volume, and it is suspicious. Price is now breaking below support at the green trend line, which is another bearish indicator.
At the weekly chart level, volume is strongest in a down week. Overall volume is declining, typical of a maturing consolidation. Each series of down weeks includes a week with stronger volume than the following series of up weeks. The breakout should come very soon now and volume indicates a downwards breakout is more likely than upwards.
Click chart to enlarge.
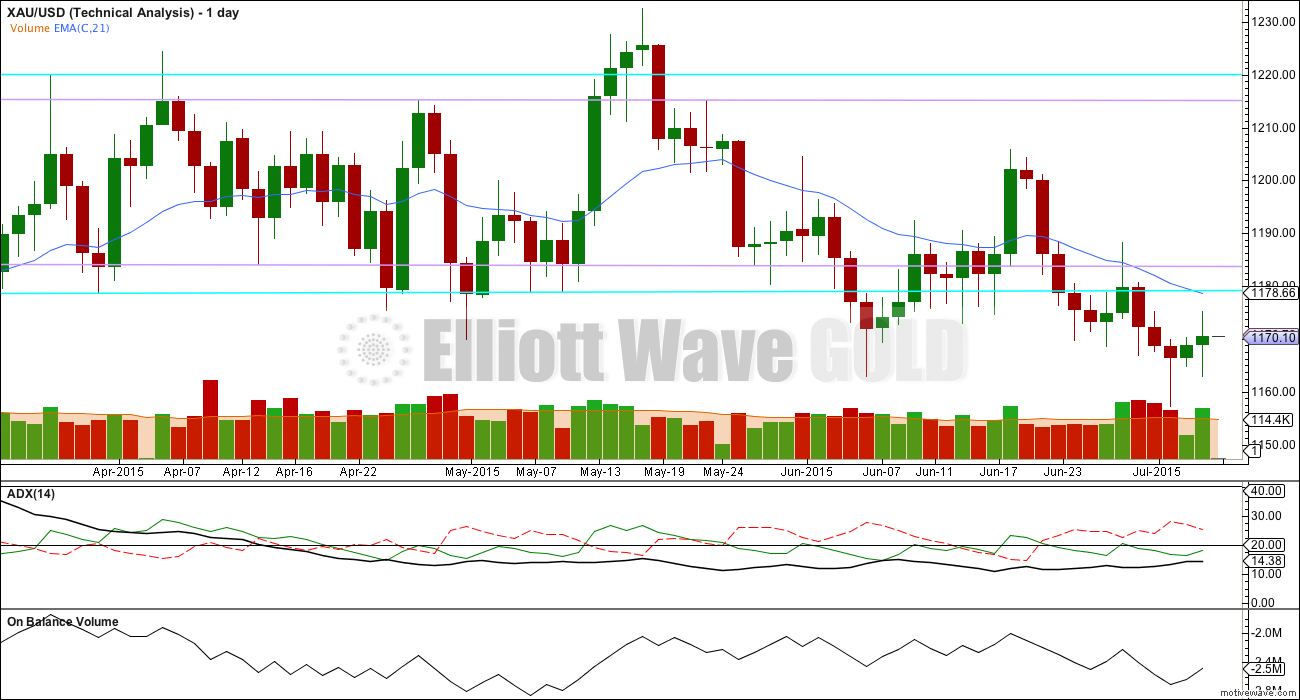
Daily Chart: While ADX still indicates no clear trend yet, price is making new lows. I will no longer illustrate a range bound trading system, because it is too risky to expect an upwards swing from here to be substantial. The sideways consolidation is now so mature the breakout is imminent; the breakout may be beginning now.
A close 3% or more of market value below the lower blue horizontal trend line would confirm a downwards breakout. That price point would be at 1,142.23.
Monday completes with a spike in volume, but importantly Monday’s volume is lower than two of the last three down days. This increase in volume for Monday looks like a typical volume spike to show the end of a correction. It is mainly for this reason that I have swapped over the hourly wave counts today with the new count the main count.
If price continues to move higher on Tuesday, then look for it to find resistance at the lower aqua blue horizontal trend line and the 21 day EMA.
This analysis is published about 06:36 p.m. EST.
Lara
Any idea at what point a big retrace up might occur? Would that be at 1125?
Is today the beginning of the bearish breakout?
Is 1125 about 4 days away thus eliminating the bull count below 1131.09.
My first impression is not for a while yet Richard.
This is nearing the middle of a third wave. There will be corrections, but they may be more shallow and quick than usual.
Draw a base channel on the daily chart for the bear and copy it over to the hourly chart; from the start of minuette wave (i) to the end of minuette wave (ii), with a copy on the end of minuette wave (i). It is perfectly showing support and resistance.
If / when price again comes to touch the upper line it should find resistance there. That may be the retracement you’re looking for.
Anyone know, are we in SM iv yet?
No haven’t reached sub minuette iii at 1125 yet as per the hourly bear chart.
“Now at 1,125 subminuette wave iii would reach 1.618 the length of subminuette wave i. This target may be five days away.”
Perhaps Micro 3 just ended at 1148.04 at 10:32 am
oh, how bad of me. Its right there on the chart. Thanks.
We are most probably in SM 3 micro 3 submicro 3 which may not have ended yet. Now at the 4th subwave of submicro 3. There is a long way to go.
thank you for the detail. I think I’ll take a snapshot of this point in time and your notation because I must learn to count intra-day. Thanks Tham.
You guys are assuming we aren’t in Lara’s bull wave. I’m playing devils advocate but this happened last year and a lot of people got whipsawed. Tham, thoughts? What is probability of this shooting up?
Many signs point to the bear count being the more likely. Look at Lara’s technical analysis for insights. The recent recommendation from one of our members for Clive Maund gives details from COT and Rydex among others. The longer term trend is bearish. Until we break above 1232, I remain bearish.
Kind of think 1 is done but we agree on one thing, there is a long way to go!
Gold dropped $10 in 30 minutes after Job news came out at 10:00 am Tuesday.
Job openings rise to record high of 5.36 million in May – July 7, 2015 10:16 a.m. ET
http://www.marketwatch.com/story/may-job-openings-rise-to-record-high-of-536-million-2015-07-07
TUESDAY, JULY 7
8:30 am Trade deficit May -$41.9 bln -$42.1 bln -$40.7 bln
10 am Job openings May — 5.4 mln
Remember and watch this big news tomorrow.
WEDNESDAY, JULY 8
2:00 pm EST – FED FOMC minutes released
Richard, whats your opinion on how (or if) gold will react to FOMC? Just a catalyst in the current roadmap or de-railing capacity?
You’d think gold would drop because of EW forecast.
However FOMC gold effect depends on minutes of last meeting and how markets react to it. Can go either way so watch gold and US dollar and news closely. Here is the fastest news site I watch at big US news events.
http://www.marketwatch.com/newsviewer
I honestly don’t think rates will raise till Dec/2016, and how the Feds plan to ease that announcement in, well who knows. Saw some historical gold chart comparison s awhile back showing rate good for gold up. Would have to look in notes to find.
Looks like Lara’s breakout downward has begun out of the range?
I have gold on a bearish breakout in 5 time frames from 5 minute up to daily.
Any wave count?
Did Micro 3 just end at 1148.04 at 10:32 am?
This wave won’t give any good entry points for those who want to short nor will it give any reprieve to shorts looking to exit IMO
Did you mean bulls looking to exit?
yes i did!
slow steady grind down, maybe a really large gap down for 3-3-3 soon as well
Main hourly bear count is in play.
What is the target for micro wave 3 (1155) and micro wave 4 up from here?
overlap of 4 and 1 on the hr alt bear count?
alt bear count invalidated by price enter into micro wave 1 territory???