
Yesterday’s main Elliott wave count expected a third wave down.
Downwards movement is showing an increase in momentum, exactly as the main Elliott wave count expected.
Summary: The case for a bearish breakout is strengthened; downwards movement should continue. The base channel on the daily and hourly charts should be used to show where price may find resistance, but downwards movement may be strong enough to break through the lower edge. This is a third wave so expect any surprises to be to the downside. The next interruption to the downwards trend (at the daily chart level) may be the end of subminuette wave iii at 1,125. It is likely we may see only red daily candlesticks while this third wave down unfolds.
It’s time again to look at weekly charts.
Changes to last analysis are bold.
BEAR ELLIOTT WAVE COUNT
Click chart to enlarge.
To see how weekly charts fit into the bigger picture see Grand Super Cycle analysis. All big picture analyses are always filed under the category “Gold Historical”.
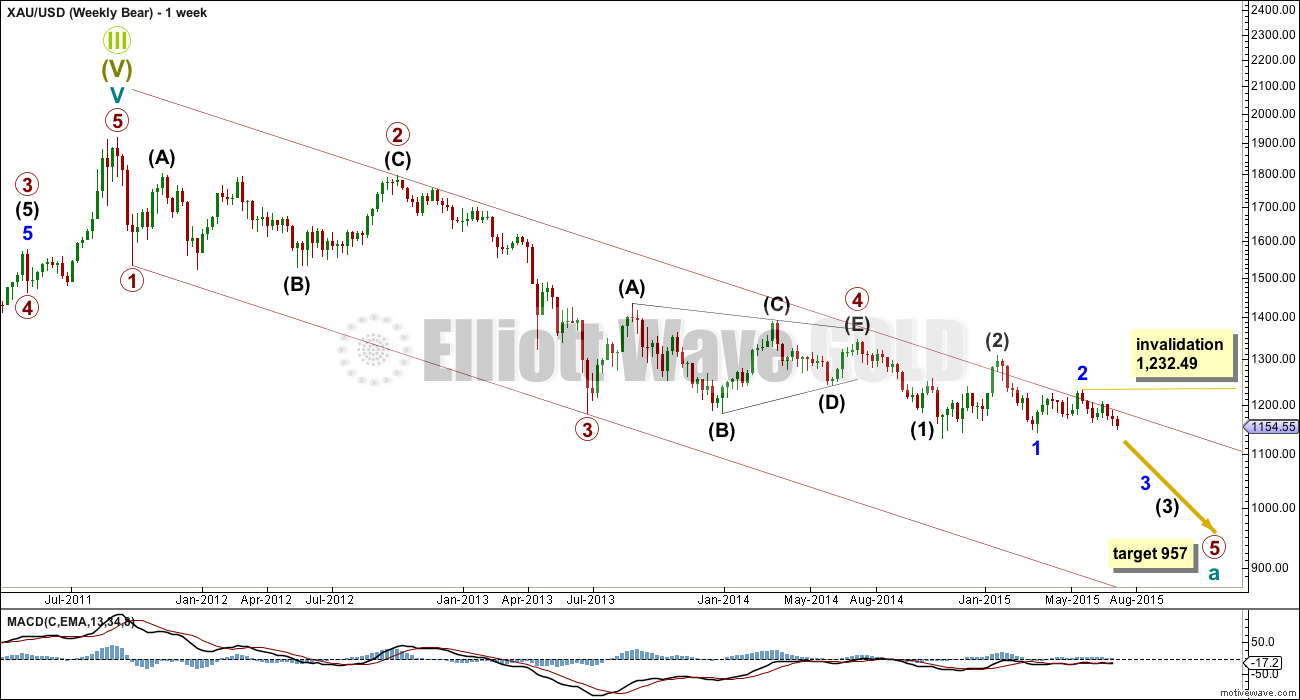
The bear wave count expects that cycle wave a is an incomplete impulse.
Primary wave 2 is a rare running flat and within it intermediate wave (C) is slightly truncated. However, the subdivisions all fit perfectly.
Primary wave 3 is 12.65 short of 1.618 the length of primary wave 1. At 957 primary wave 5 would reach equality in length with primary wave 1, giving the impulse perfect Fibonacci ratios. This is typical for Gold, so this expectation is reasonable.
Primary wave 2 is a deep 0.68 running flat lasting 53 weeks, two short of a Fibonacci 55. Primary wave 4 is a shallow 0.27 regular contracting triangle lasting 54 weeks, one short of a Fibonacci 55. There is almost perfect proportion, and there is perfect alternation between primary waves 2 and 4.
Primary wave 1 lasted a Fibonacci 3 weeks and primary wave 3 lasted 37 weeks, three longer than a Fibonacci 34. So far primary wave 5 is in its 52nd week and is unlikely to end in a total Fibonacci 55 weeks. The next Fibonacci number in the sequence is 89, which means primary wave 5 may be drawn out for a further 37 weeks from the time this analysis is published.
Within primary wave 5 the daily chart focuses on the middle of intermediate wave (3). Intermediate wave (3) has yet to show an increase in downwards momentum beyond that seen for intermediate wave (1).
Click chart to enlarge.
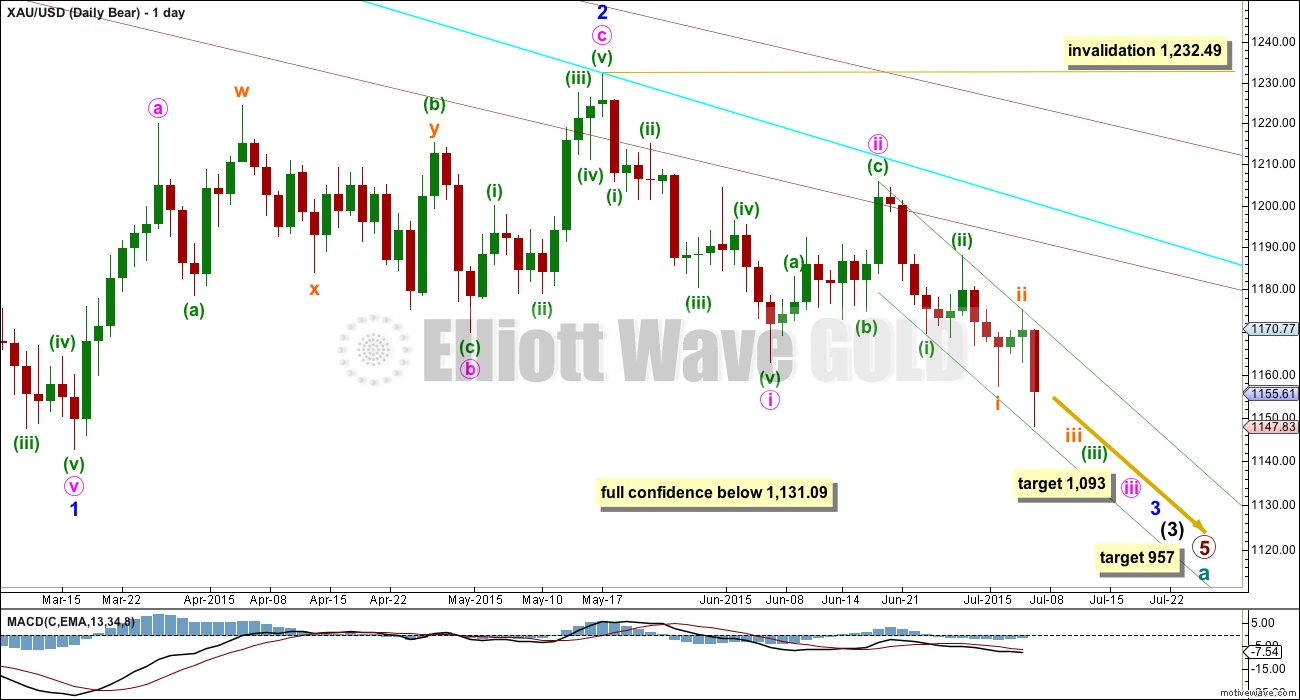
The bear wave count has increased in probability with a new low below 1,162.80. Full confidence may be had in this wave count with a new low below 1,131.09.
Pros:
1. Intermediate wave (1) (to the left of this chart) subdivides perfectly as a five wave impulse with good Fibonacci ratios in price and time. There is perfect alternation and proportion between minor waves 2 and 4. For this piece of movement, the bear wave count has a much better fit than the bull wave count.
2. Intermediate wave (2) (to the left of this chart) is a very common expanded flat correction. This sees minor wave C an ending expanding diagonal which is more common than a leading expanding diagonal.
3. Minor wave B (to the left of this chart) within the expanded flat subdivides perfectly as a zigzag.
4. Volume at the weekly and daily chart continues to favour the bear wave count. Since price entered the sideways movement on 27th March, it is a downwards week which has strongest volume and downwards days which have strongest volume, five of them.
5. On Balance Volume on the weekly chart breached a trend line from back to December 2013. This is another bearish indicator.
Cons:
1. Intermediate wave (2) (to the left of this chart) looks too big on the weekly chart.
2. Intermediate wave (2) (to the left of this chart) has breached the channel from the weekly chart which contains cycle wave a.
3. Within minor wave 1 down, there is gross disproportion between minute waves iv and ii: minute wave iv is more than 13 times the duration of minute wave i, giving this downwards wave a three wave look.
4. Minor wave 2 is much longer in duration than a minor degree correction within an intermediate impulse normally is for Gold. Normally a minor degree second wave within a third wave should last only about 20 days maximum. This one is 44 days long.
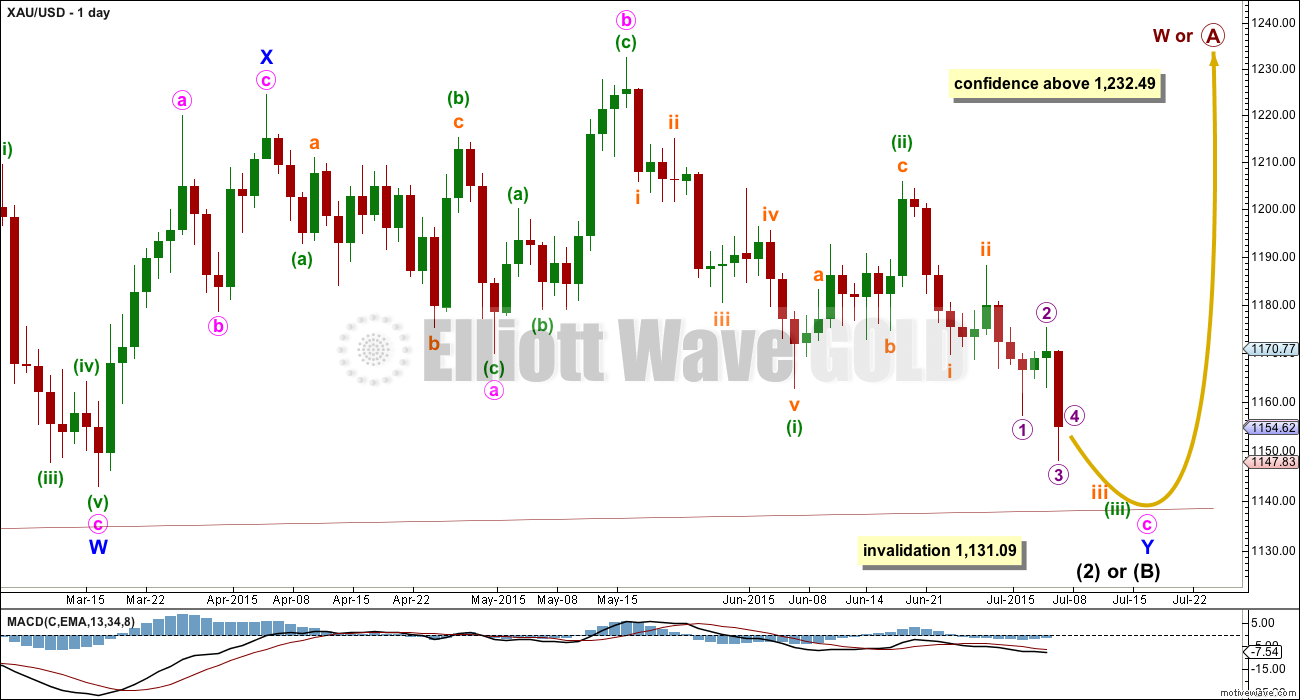
Minor waves 1 and 2 are complete. Minute waves i and ii are also complete. Gold may be ready to move to the strongest middle of intermediate wave (3).
Minute wave ii may not move beyond the start of minute wave i above 1,232.49.
Minute wave ii is now very likely to be over here. If it moves any higher, then it should find strong resistance at the blue trend line.
At 1,093 minute wave iii would reach 1.618 the length of minute wave i. If minute wave iii ends in a total Fibonacci twenty one days, then this target may be reached in another eight days time.
Draw a base channel about minuette waves (i) and (ii) as shown (green trend lines). Look for upwards corrections along the way down to continue to find resistance at the upper edge of that channel. When the strongest part of downwards movement arrives, then it may have the power to break through support at the lower edge of the channel. For now this channel is perfectly showing where price is finding support and resistance.
HOURLY BEAR ELLIOTT WAVE COUNT
Click chart to enlarge.
This hourly chart, and the alternate hourly below, work in exactly the same way for the bull wave count. The only difference for the bull wave count is the degree of labelling would be one degree lower.
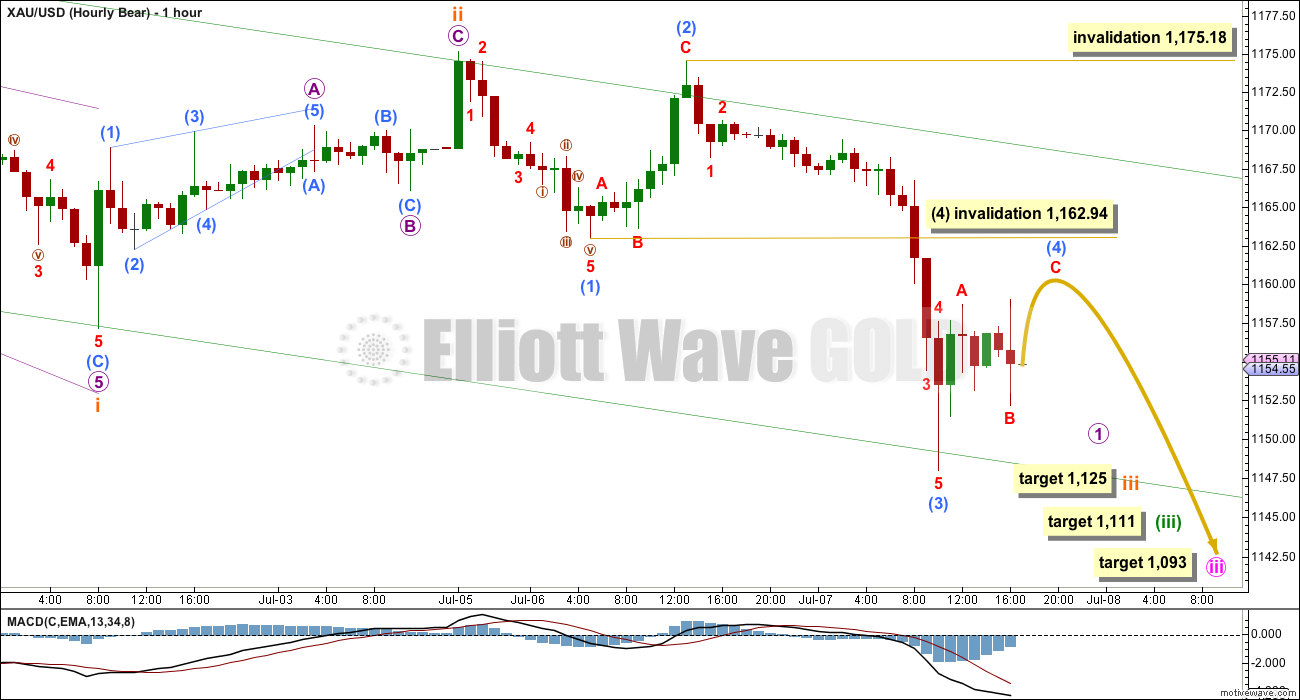
I am moving the degree of labelling of the last wave down all down one degree. Looking at daily and weekly charts, the middle of the third wave has not yet passed so I will not label micro wave 3 as over here. It looks more likely that micro wave 1 is incomplete.
I have checked the subdivisions of submicro wave (3) on the five minute chart. Within it, there are two strong extended fifth waves: one to end minuscule wave 3 and another to end minuscule wave 5. This is common for Gold, typical of commodities, and it often gives Gold’s impulses a curved look. Because this look is so typical and because the subdivisions on the five minute chart all fit perfectly, I am confident a small third wave was over at today’s low. But this is not the middle of intermediate wave (3).
Submicro wave (4) may not move into submicro wave (1) price territory above 1,162.94.
If this invalidation point is passed before submicro wave (5) down completes a five wave impulse for micro wave 1, then my labelling is wrong. I would move the degree of submicro wave (3) down one degree and label it as minuscule wave 1. The invalidation point would be a the higher point of 1,175.18.
When a final fifth wave down completes an impulse for micro wave 1, then the following correction for micro wave 2 may not move beyond its start above 1,175.18.
Copy the green base channel over to the hourly chart. Look for the next upwards correction for micro wave 2 to end close to the upper green trend line. This green line should show us where and when upwards corrections end along the way down.
Mid term targets for the third waves remain the same. Now at 1,125 subminuette wave iii would reach 1.618 the length of subminuette wave i. This target may be five days away.
At 1,111 minuette wave (iii) would reach 2.618 the length of minuette wave (i). If minuette wave (iii) lasts a total Fibonacci thirteen days, then this target would be nine days away.
At 1,093 minute wave iii would reach 1.618 the length of minute wave i. If minute wave iii lasts a total Fibonacci twenty one or thirty four days, then this target may be a further ten or twenty three days away.
BULL ELLIOTT WAVE COUNT
Click chart to enlarge.
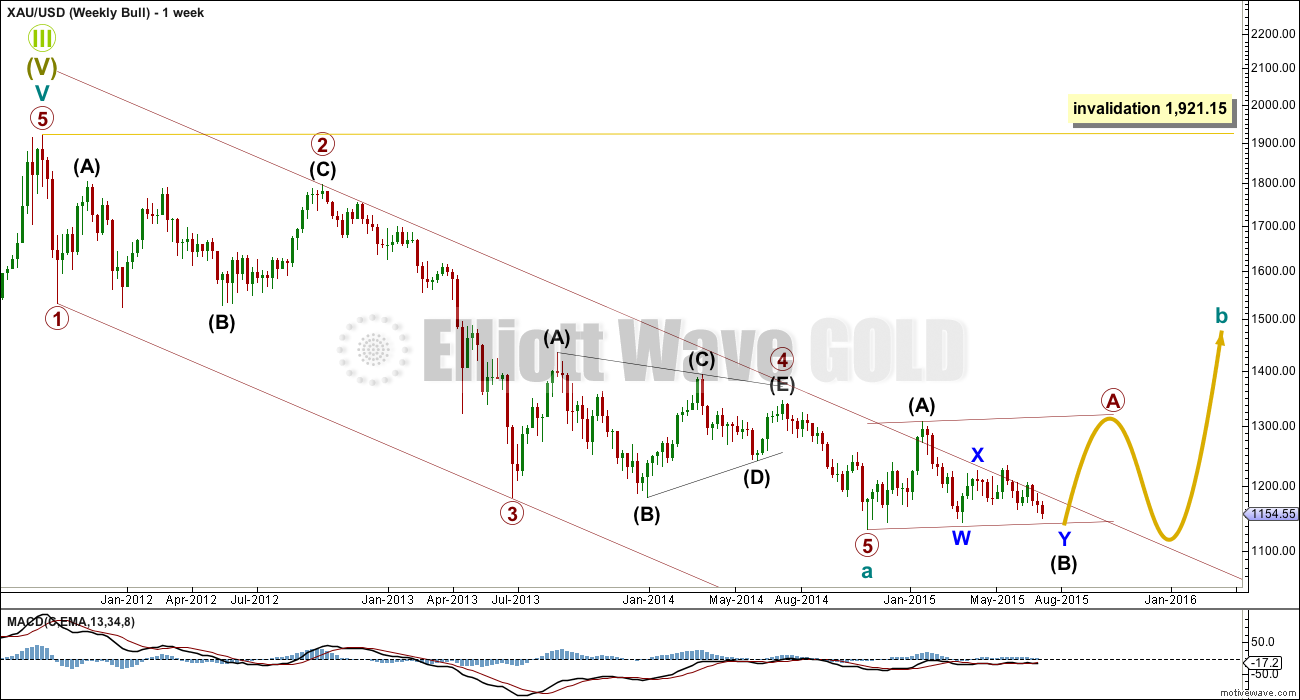
This weekly chart looks at the possibility that cycle wave a is a complete impulse. Because cycle wave a subdivides as a five wave structure cycle wave b may not move beyond its start above 1,921.15.
Cycle wave b may unfold as one of more than thirteen possible corrective structures. Within Cycle wave b, primary wave A may be either a three or a five.
The first wave up within primary wave A, labelled intermediate wave (A), will subdivide only as a five wave structure. This means that primary wave A may be only one of two possible structures: either a zigzag or an impulse. It also means that within it intermediate wave (B) may not move beyond its start below 1,131.09.
The Fibonacci ratios in price and time between primary waves 1, 2, 3 and 4 are all the same. This part of the wave count is the same. If primary wave 5 is over, then it has no Fibonacci ratio to primary waves 1 or 3, lasted 17 weeks, and exhibits no Fibonacci duration.
Click chart to enlarge.
Pros:
1. The size of the upwards move labelled here intermediate wave (A) (to the left of this chart) looks right for a new bull trend at the weekly chart level.
2. The downwards wave labelled minor wave W looks best as a three.
3. The small breach of the channel about cycle wave a on the weekly chart would be the first indication that cycle wave a is over and cycle wave b has begun.
Cons:
1. Within intermediate wave (3) of primary wave 5 (to the left of this chart), to see this as a five wave impulse requires either gross disproportion and lack of alternation between minor waves 2 and 4 or a very rare running flat which does not subdivide well. I have tried to see a solution for this movement, and no matter what variation I try it always has a problem which substantially reduces its probability.
2. Intermediate wave (5) of primary wave 5 (to the left of this chart) has a count of seven which means either minor wave 3 or 5 looks like a three on the daily chart.
3. Expanding leading diagonals (of which intermediate wave (A) or (1) is) are are not very common (the contracting variety is more common). There is also now a second expanding leading diagonal for minute wave i.
4. Volume does not support this bull wave count.
5. Intermediate wave (B) or (2) may only be continuing as a double combination. Minor wave X is shallow, and X waves within double combinations are normally very deep. This one looks wrong.
For volume to clearly support the bull wave count it needs to show an increase beyond 187.34K (30th April) and preferably beyond 230.3K (9th April) for an up day. Only then would volume more clearly indicate a bullish breakout is more likely than a bearish breakout.
Intermediate wave (A) (to the left of this chart) subdivides only as a five. I cannot see a solution where this movement subdivides as a three and meets all Elliott wave rules (with the sole exception of a very rare triple zigzag which does not look right). This means that intermediate wave (B) may not move beyond the start of intermediate wave (A) below 1,131.09. That is why 1,131.09 is final confirmation for the bear wave count at the daily and weekly chart level.
The only option now for the bull wave count is to see intermediate wave (B) or (2) continuing sideways as a double combination. The first structure in the double is a zigzag labelled minor wave W. The double is joined by a brief three in the opposite direction labelled minor wave X, a zigzag. The second structure in the combination is an expanded flat labelled minor wave Y which is incomplete.
Within minor wave Y, minute wave b is a 1.15 times the length of minute wave a indicating an expanded flat. Both minute waves a and b are three wave structures.
Minute wave c downwards must subdivide as a five, and because the first wave within it is an impulse and not a zigzag minute wave c may only be unfolding as an impulse.
Within minute wave c downwards, the third wave is incomplete for minuette wave (iii). At the hourly chart level, this bull wave count sees the subdivisions in exactly the same way as the bear (the bull sees everything one degree lower) so the hourly charts are the same. For this reason I will publish only hourly charts for the bear because they work in exactly the same way for the bull.
There does not look to be enough room for minute wave c to complete as a five wave impulse and remain above the invalidation point at 1,131.09. This is now the biggest problem with the bull wave count.
TECHNICAL ANALYSIS
Click chart to enlarge.
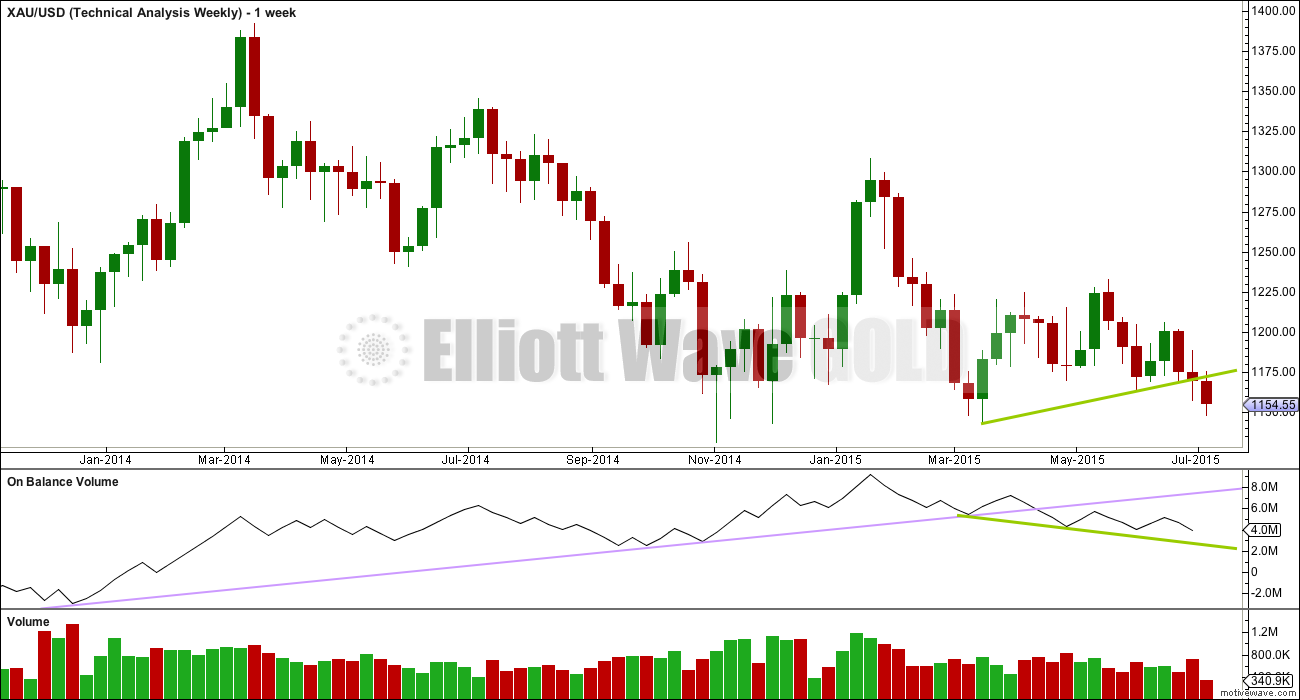
Weekly Chart: Overall volume still favours a downwards breakout which may now be underway. During this sideways movement, it is still down days and a down week which have higher volume. On Balance Volume breaches a trend line (lilac line) which began in December 2013, and the breach is significant.
While price has made higher lows, On Balance Volume has made lower lows (green trend lines). This small rise in price is not supported by volume, and it is suspicious. Price is now breaking below support at the green trend line, which is another bearish indicator.
At the weekly chart level, volume is strongest in a down week. Overall volume up until last week was declining, typical of a maturing consolidation. Each series of down weeks includes a week with stronger volume than the following series of up weeks.
Click chart to enlarge.
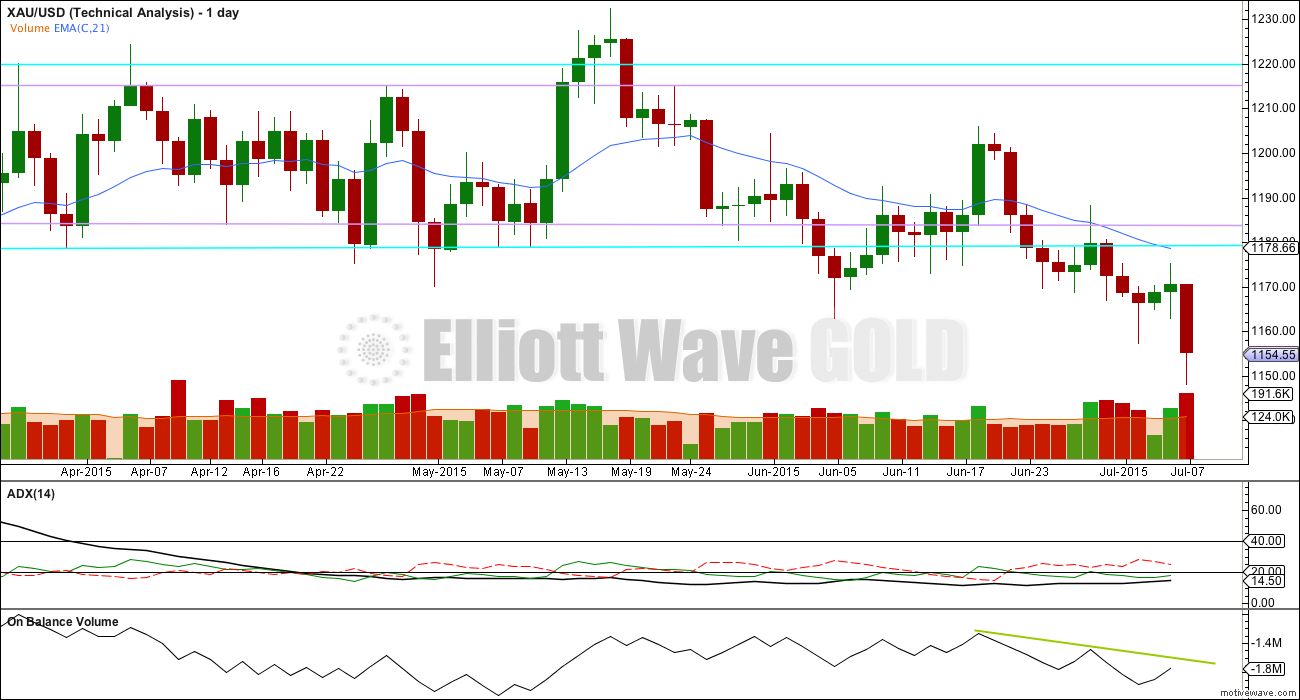
Daily Chart: While ADX still indicates no clear trend yet, price is making new lows. I will no longer illustrate a range bound trading system, because it is too risky to expect an upwards swing from here to be substantial. The sideways consolidation is now so mature the breakout is imminent; the breakout may be underway.
A close 3% or more of market value below the lower blue horizontal trend line would confirm a downwards breakout. That price point would be at 1,142.23.
Downwards volume for Tuesday is again higher than prior upwards days. Volume consistently favours a downwards trend and a bearish wave count. Tuesday’s fall in price is supported by increased volume.
Look for any upwards corrections to end when On Balance Volume comes up to touch its green sloping trend line.
This analysis is published about 06:28 p.m. EST.
This upwards movement subdivides perfectly as a three on the five minute and hourly chart. Micro 2 may be over, falling slightly short of that upper trend line.
This is where the bear count expects to see some really strong downwards movement.
I may move the invalidation point down to today’s high at 1,164.79.
This next move down may break through support at the green trend line.
I am concerned though that today’s up day completed with stronger volume than yesterday’s down day. The bulls are putting up a strong fight against this recent downwards move of price.
Lara,
Is there any reality left to a bull wave count? I know you mentioned that there may not be enough room left. When you look at the waves that need to happen yet, I am curious to know if they can even fit following EW rules at this point.
Also curious if there is a different bull wave option – as I am noting your ‘concern’ about volume today. Is there another bull count that could move up from here?
Thanks
Not much. It’s technically possible. But it’s not going to be easy.
If the fourth waves are shallow and the fifth waves are short it could just do it.
I’ll keep a bull wave count though until it’s finally invalidated by price.
And as always, I’ll keep looking for alternates.
By the way, really like your change to “bold” in the analysis revisions. Thumbs up!
same here
Lara has Micro 2 ended and Micro 3 down begun?
Is 1125 still expected in about 3 days and then we get a bounce and green daily candlestick?
Today’s Micro wave 2 completed a green candlestick so micro wave 4 may do so as well. So there may be another shallow interruption of this trend when that fourth wave arrives.
Micro wave 3 would reach 1.618 the length of micro wave 1 at 1,120. That may now be the next interruption.
Micro wave 2 was deep so the upcoming micro wave 4 should be shallow.
A word of caution though: today’s up day completes with higher volume than yesterday’s down day. The bulls are putting up a big fight. It may indicate that micro wave 2 could possibly move sideways and take longer, although the Elliott wave picture sees that as extremely unlikely.
Avi Gilburt – EW – Tuesday, 7 July 2015
http://news.goldseek.com/GoldSeek/1436298600.php
I bought DUST at 2:01 pm and sold it at 3:03 pm for profit when news came out that would move gold up and minutes later DUST dropped. Will wait for Lara comment or analysis.
me, I bought DUST on Monday sold on Tuesday for nice % profit, then re-bought for pennies less. (Patrick was right, difficult to get in) Am staying profitable in this current trade God willing. Whittling away prior losses. 🙂 Waiting on Lara’s analysis to hopefully confirm continued down movement.
DUST from Monday to Tuesday was a beautiful trade. $3.25 up in 1 day, wow.
It is a big change from no trend for weeks to lots of action this week and what looks like a bearish trend although not official.
Getting in and out of DUST takes watching all the time and the trend lines and prices as some strange momentum swings in miners that may temporarily go against the usual action in gold. Basically have to buy on dips in DUST and sell when looking like an end to a EW swing and DUST top.
Also takes nerves of steel. LOL
Agreed. A bit crazy making. Watched DUST maintaining & going up today while XAU was ascending. Glad I didn’t sell there and hope to keep buying on dips.
Lara : US Oil has dropped to 51ish. When is the time to enter? I got stopped out .
Comments are closed on US Oil report.
Thnx
I missed the entry too. I spend so much time analysing markets I don’t trade…. I don’t have enough time to watch the ones I do. I only have my NZDUSD trade ATM.
I am waiting for another green candlestick on US Oil to enter. I should have done it yesterday, but I missed it 🙁
I’m also waiting to add to my NZDUSD short. Today’s strong green candlestick subdivides perfectly as a three on the hourly chart so I may add to my short on that today and leave an entry for US Oil for it’s next green candlestick.
But to add to that, trading US Oil is new for me with a new broker. I’m being put off by their horrible fees too, but haven’t spent the time yet to find another.
NYSE and Algos turning on any minute.
IMO, still has all the elements of a wave 2 but I fail to see what will launch wave 3.
we are still pressed up against the down trending line
Neither side has really blinked yet. Shorts still seem to have the advantage though. Only option premium sellers winning at the moment lol
Gold just made a new high of 1164.77 at 1:28 pm and Micro 2 may be ending soon.
Don’t know what gold will do between now and 2:00 pm FOMC.
Previous high today was 1164.71 at 9:22 am.
http://www.pmbull.com/gold-price/
Look at hourly chart and see gold is now 1164 and at upper trend line which Lara says will act as resistance.
Open Options positions on Gold Futures contract expiring July 28th. Big wall at 1150.
If I was looking to add to my gold miner longs, now is when I would do it with a tight stop at today’s lows.
Ben, what does your strategy say?
GDX did move down as you anticipated, big question now is are we going to have any sizable move up and or hold sideways for a week or will GDX continue down in a significant 3rd wave?
It did move down, but could have more in it. Lara’s GDX count has a target of $16.17, which could be in play still. No change to my positions at this point. A new low in Gold would cause me to re-evaluate.
Lara’s GDX daily bull chart has $16.17 on what looks to be July 8th.
If it were an hourly chart the July 8th may be more accurate.
However on an daily chart I wouldn’t expect $16.17 to happen today but at a future date.
The daily bear has 12.12 but no exact date given as not to scale.
Look at http://www.pmbull.com 1 hour gold chart covering part of July 2nd up to today.
That is similar to Lara’s hourly bear chart.
Lara said gold may bounce around between the upper and lower trend lines.
Gold hit low of 1147.30 at 2:51 am to end Micro wave 1 (circle)
This morning gold hit the top trend line at 1164.71 at 9:22 am.
GDX peaked and DUST hit it’s low between 9:40 and 9:50 am.
Gold is now up in Micro 2 which may be a ABC zigzag and may be in the last part C.
The US FED FOMC minutes are released at 2:00 pm today.
Fast FED FOMC headlines and or news at
http://www.marketwatch.com/newsviewer
We’ll find out if perhaps that may be the end of Micro 2 and the start of Micro 3 down.
Downward movement may be strong enough to break through lower edge of the base channel.
Next big lower target is subminuette iii at 1125, which may be 4 days away?
That bounce up is expected to have a green daily candlestick.
The target is changed slightly to 1,120.
In the context of the hourly bear, this morning’s rally looks like miniscule c of a regular flat that is submicro (4). Invalidation point 1162.94
My data shows that move down before market open was a lower low. So it could have been an expanded flat for that fourth wave, but either way it went into wave 1 territory. so that was probably an ending 5th wave. Therefore, it could be end of micro 1 and this is micro 2. So far it is a perfect 61.8 retrace. And now the big middle of the 3rd wave down can begin. However, that seems too simple. We’ll see
I agree that we are now in micro 2. It has to be a three-wave pattern and IMO it is not over yet. Invalidation at 1175.18.
Yes. Im hoping it is a simple zigzag and about to complete its 5th wave of its C wave
Maybe it may complete Micro 2 at 2:00 pm FOMC news?
Richard – perhaps. My major concern with all of this is the oversold nature of gold and the potential bottoming action in the miners
I have no miners now and will buy at 2:00 pm FOMC news watching how gold and the US dollar $DXY react.
Just because miners are at major lows doesn’t mean they can’t drop more. Yes miners are oversold, however gold is in a the middle of a 3rd wave down which has a very strong pull.
Lara warns against being bullish now If so use extreme caution as surprises will be downward.
Lara analysis has the first green daily candlestick bounce happening at target of 1125.
not crazy about this action, could launch higher from here
Next bounce: When a final fifth wave down completes an impulse for micro wave 1, then the following correction for micro wave 2 may not move beyond its start above 1,175.18. (It may go to the upper line at 1167.)
Then next bounce: At 1,125 subminuette wave iii would reach 1.618 the length of subminuette wave i. This target may be five days away.
Lara and Elliott Wave gave us a warning.
China fears crash into gold, copper markets
http://money.cnn.com/2015/07/07/investing/china-gold-copper-greece/index.html?iid=hp-stack-dom