
Yesterday’s hourly Elliott wave chart expected an impulse down to end and be followed by another second wave correction to find resistance at the upper edge of a channel.
This is what happened, with the exception of a small fourth wave not moving higher first.
Summary: The main wave count is still bearish and still expects the middle of a strong third wave down to begin from here. The target is slightly recalculated at 1,123.
To see weekly charts click here.
Changes to last analysis are bold.
BEAR ELLIOTT WAVE COUNT
Click chart to enlarge.
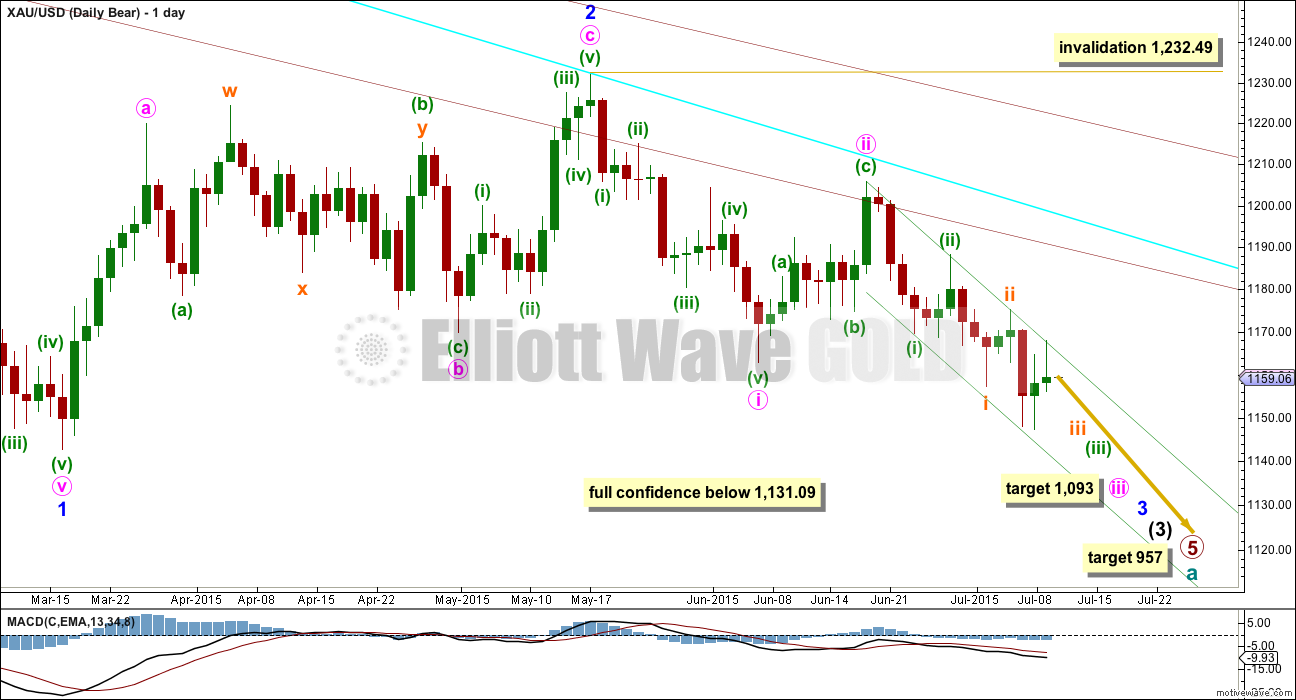
The bear wave count expects that cycle wave a is an incomplete impulse.
Within primary wave 5, the daily chart focuses on the middle of intermediate wave (3). Intermediate wave (3) has yet to show an increase in downwards momentum beyond that seen for intermediate wave (1).
The bear wave count has increased in probability with a new low below 1,162.80. Full confidence may be had in this wave count with a new low below 1,131.09.
Pros:
1. Intermediate wave (1) (to the left of this chart) subdivides perfectly as a five wave impulse with good Fibonacci ratios in price and time. There is perfect alternation and proportion between minor waves 2 and 4. For this piece of movement, the bear wave count has a much better fit than the bull wave count.
2. Intermediate wave (2) (to the left of this chart) is a very common expanded flat correction. This sees minor wave C an ending expanding diagonal which is more common than a leading expanding diagonal.
3. Minor wave B (to the left of this chart) within the expanded flat subdivides perfectly as a zigzag.
4. Volume at the weekly and daily chart continues to favour the bear wave count. Since price entered the sideways movement on 27th March, it is a downwards week which has strongest volume and the downwards day of 9th April which still has strongest volume.
5. On Balance Volume on the weekly chart breached a trend line from back to December 2013. This is another bearish indicator.
Cons:
1. Intermediate wave (2) (to the left of this chart) looks too big on the weekly chart.
2. Intermediate wave (2) (to the left of this chart) has breached the channel from the weekly chart which contains cycle wave a.
3. Within minor wave 1 down, there is gross disproportion between minute waves iv and ii: minute wave iv is more than 13 times the duration of minute wave i, giving this downwards wave a three wave look.
4. Minor wave 2 is much longer in duration than a minor degree correction within an intermediate impulse normally is for Gold. Normally a minor degree second wave within a third wave should last only about 20 days maximum. This one is 44 days long.
Minor waves 1 and 2 are complete. Minute waves i and ii are also complete. Gold may be ready to move to the strongest middle of intermediate wave (3).
Minute wave ii may not move beyond the start of minute wave i above 1,232.49.
Minute wave ii is now very likely to be over here. If it moves any higher, then it should find strong resistance at the blue trend line.
At 1,093 minute wave iii would reach 1.618 the length of minute wave i. If minute wave iii ends in a total Fibonacci twenty one days, then this target may be reached in another six days time.
Draw a base channel about minuette waves (i) and (ii) as shown (green trend lines). Look for upwards corrections along the way down to continue to find resistance at the upper edge of that channel. When the strongest part of downwards movement arrives, then it may have the power to break through support at the lower edge of the channel. For now this channel is perfectly showing where price is finding support and resistance. This channel is drawn in the same way on the daily and hourly charts, but the daily chart is on a semi-log scale and the hourly is arithmetic. At the daily chart level, the channel perfectly shows where price found resistance today; at the hourly chart level, the channel is overshot and that’s okay.
HOURLY BEAR ELLIOTT WAVE COUNT
Click chart to enlarge.
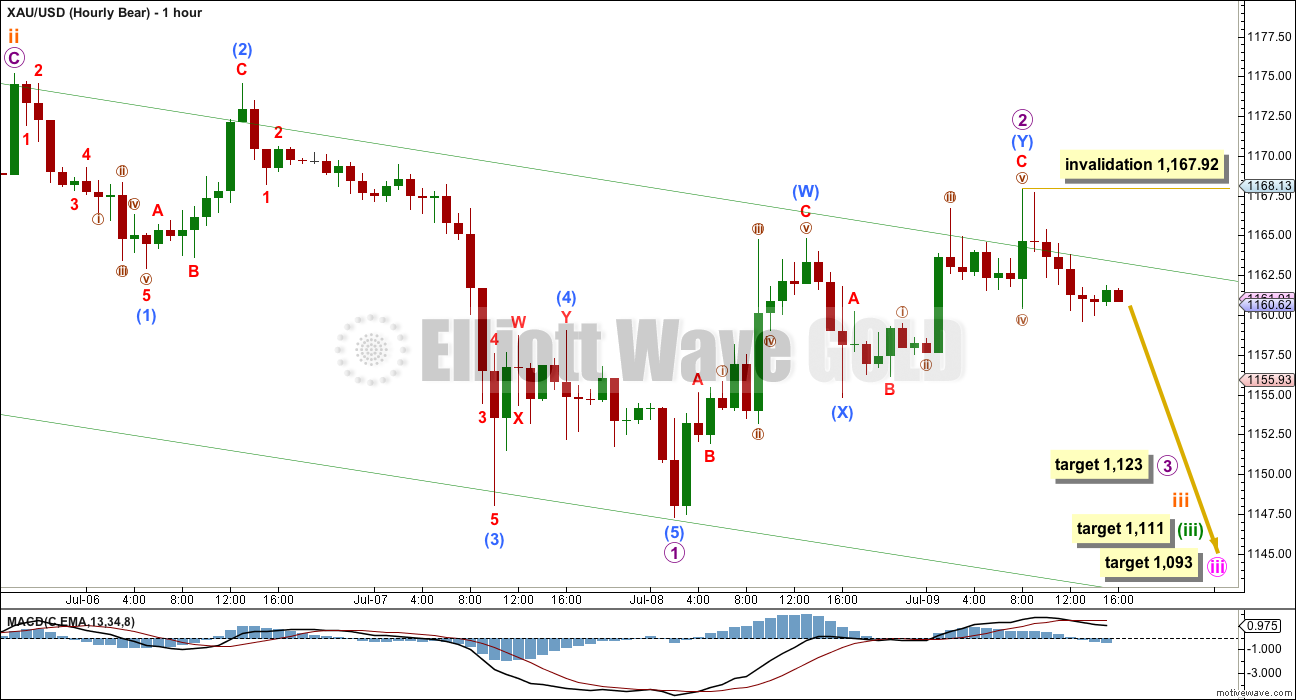
This hourly chart, and the alternate hourly below, work in exactly the same way for the bull wave count. The only difference for the bull wave count is the degree of labelling would be one degree lower.
Micro wave 2 may have continued higher as a double zigzag. The second zigzag in the double has deepened the correction, and the structure has a clear slope as it should. Micro wave 2 is now a very deep 0.74 correction of micro wave 1. This is possible, but slightly unusual. At this stage, I have looked for an alternate wave count and have not yet found one which meets all Elliott wave rules. I have considered a leading diagonal down from the end of minute wave ii at 1,205 (thank you to Matt for the idea), but that possibility does not meet all Elliott wave rules because a rule for a contracting diagonal would be violated. My conclusion has to be that this wave count presented here is very likely, despite the deep correction of micro wave 2.
What is still clear on this hourly chart is micro wave 1 is a five wave structure and micro wave 2 is corrective.
The upper edge of the channel is again overshot at the hourly chart level, but not properly breached. Downwards movement must continue from here for this main wave count.
At 1,123 micro wave 3 would now reach 1.618 the length of micro wave 1. Within this third wave, it is very likely that its fifth wave down will be the strongest and swiftest part of downwards movement.
Within micro wave 3, no second wave correction may move beyond the start of its first wave above 1,167.92.
At 1,111 minuette wave (iii) would reach 2.618 the length of minuette wave (i). If minuette wave (iii) lasts a total Fibonacci thirteen days, then this target would be five days away.
BULL ELLIOTT WAVE COUNT
Click chart to enlarge.
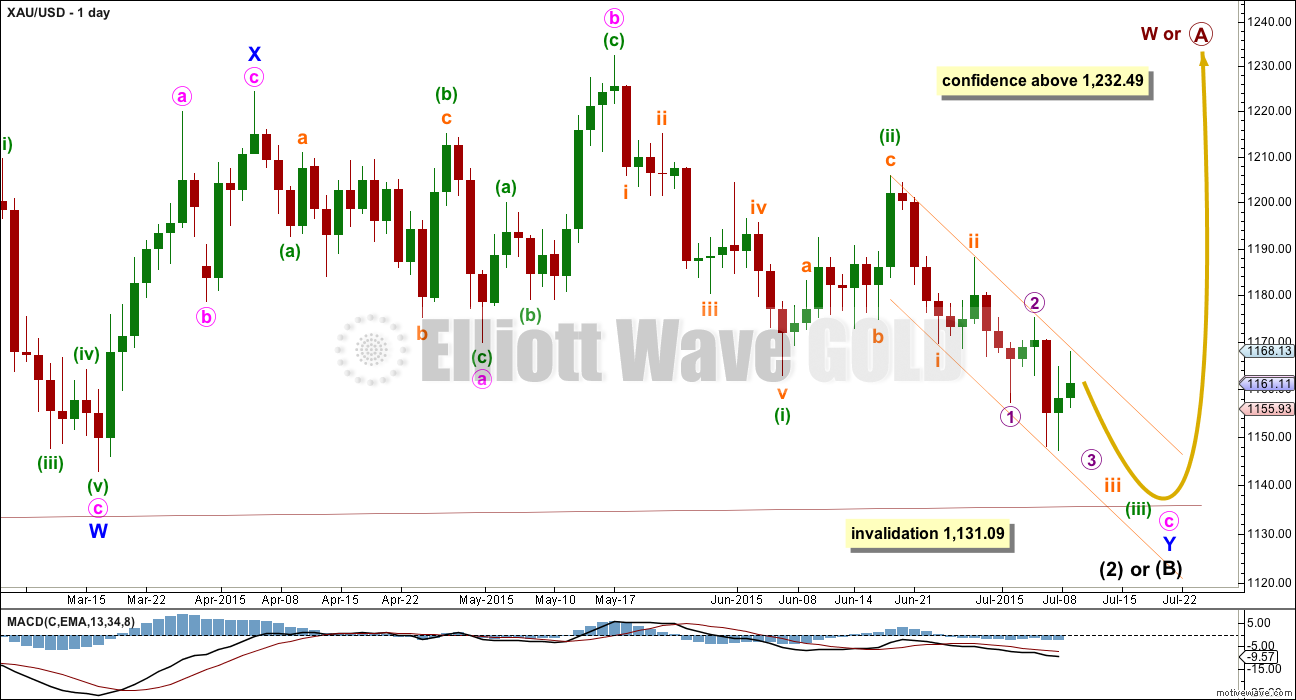
This bull wave count looks at the possibility that cycle wave a is a complete impulse and that cycle wave b began back at 1,131.09. Within cycle wave b, primary wave A is incomplete and subdividing either as a zigzag or an impulse.
Pros:
1. The size of the upwards move labelled here intermediate wave (A) (to the left of this chart) looks right for a new bull trend at the weekly chart level.
2. The downwards wave labelled minor wave W looks best as a three.
3. The small breach of the channel about cycle wave a on the weekly chart would be the first indication that cycle wave a is over and cycle wave b has begun.
Cons:
1. Within intermediate wave (3) of primary wave 5 (to the left of this chart), to see this as a five wave impulse requires either gross disproportion and lack of alternation between minor waves 2 and 4 or a very rare running flat which does not subdivide well. I have tried to see a solution for this movement, and no matter what variation I try it always has a problem which substantially reduces its probability.
2. Intermediate wave (5) of primary wave 5 (to the left of this chart) has a count of seven which means either minor wave 3 or 5 looks like a three on the daily chart.
3. Expanding leading diagonals (of which intermediate wave (A) or (1) is) are are not very common (the contracting variety is more common). There is also now a second expanding leading diagonal for minute wave i.
4. Volume does not support this bull wave count.
5. Intermediate wave (B) or (2) may only be continuing as a double combination. Minor wave X is shallow, and X waves within double combinations are normally very deep. This one looks wrong.
Volume for 8th July shows a strong increase for an up day at 218.9K. It is stronger than all the prior down days since Gold entered the sideways consolidation back on 27th March except for one, that of 9th April at 230.3K.
Intermediate wave (A) (to the left of this chart) subdivides only as a five. I cannot see a solution where this movement subdivides as a three and meets all Elliott wave rules (with the sole exception of a very rare triple zigzag which does not look right). This means that intermediate wave (B) may not move beyond the start of intermediate wave (A) below 1,131.09. That is why 1,131.09 is final confirmation for the bear wave count at the daily and weekly chart level.
The only option now for the bull wave count is to see intermediate wave (B) or (2) continuing sideways as a double combination. The first structure in the double is a zigzag labelled minor wave W. The double is joined by a brief three in the opposite direction labelled minor wave X, a zigzag. The second structure in the combination is an expanded flat labelled minor wave Y which is incomplete.
Within minor wave Y, minute wave b is a 1.15 times the length of minute wave a indicating an expanded flat. Both minute waves a and b are three wave structures.
Minute wave c downwards must subdivide as a five, and because the first wave within it is an impulse and not a zigzag minute wave c may only be unfolding as an impulse.
Within minute wave c downwards, the third wave is incomplete for minuette wave (iii). At the hourly chart level, this bull wave count sees the subdivisions in exactly the same way as the bear (the bull sees everything one degree lower) so the hourly charts are the same. For this reason I will publish only hourly charts for the bear because they work in exactly the same way for the bull.
There does not look to be enough room for minute wave c to complete as a five wave impulse and remain above the invalidation point at 1,131.09. This is now the biggest problem with the bull wave count.
TECHNICAL ANALYSIS
Click chart to enlarge.
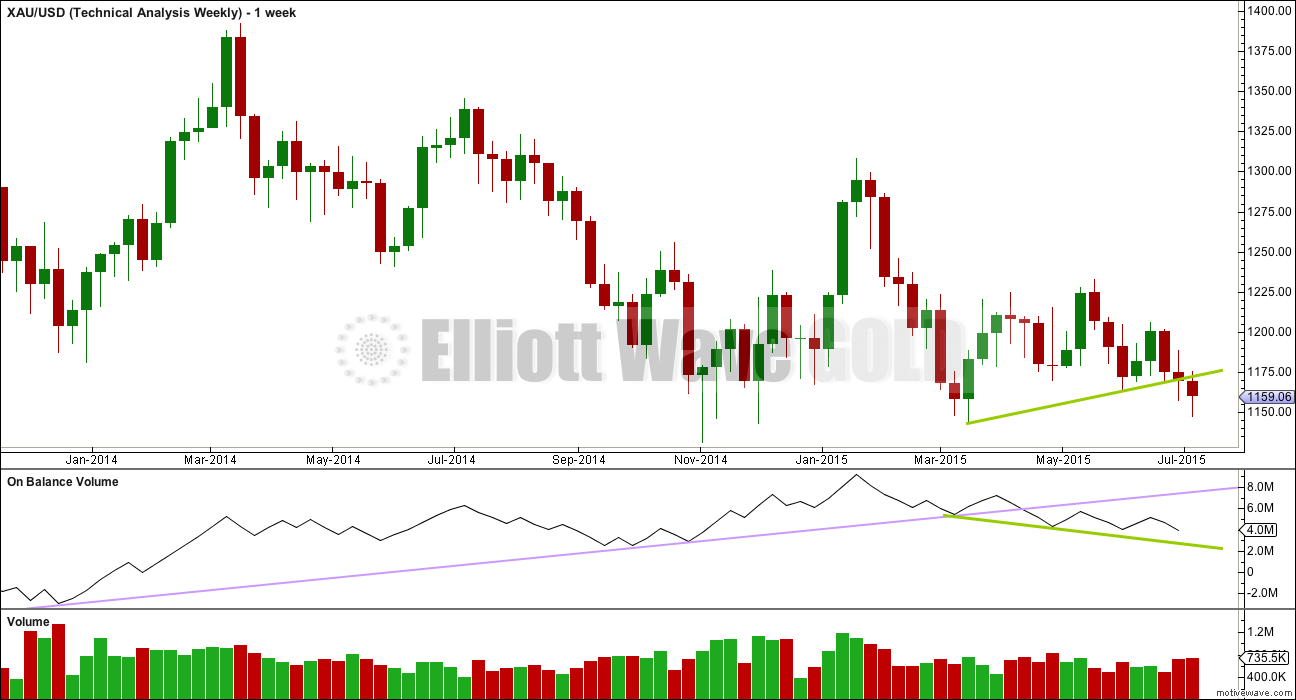
Weekly Chart: Overall volume still favours a downwards breakout which may now be underway. During this sideways movement, it is still one down day and a down week which have higher volume. On Balance Volume breaches a trend line (lilac line) which began in December 2013, and the breach is significant.
While price has made higher lows, On Balance Volume has made lower lows (green trend lines). This small rise in price is not supported by volume, and it is suspicious. Price is now breaking below support at the green trend line, which is another bearish indicator.
At the weekly chart level, volume is strongest in a down week. Overall volume up until two weeks ago volume was declining, typical of a maturing consolidation. Each series of down weeks includes a week with stronger volume than the following series of up weeks. With last week and now this week showing increased volume for a down week, it looks like the consolidation is complete and a downward breakout may be underway.
Click chart to enlarge.
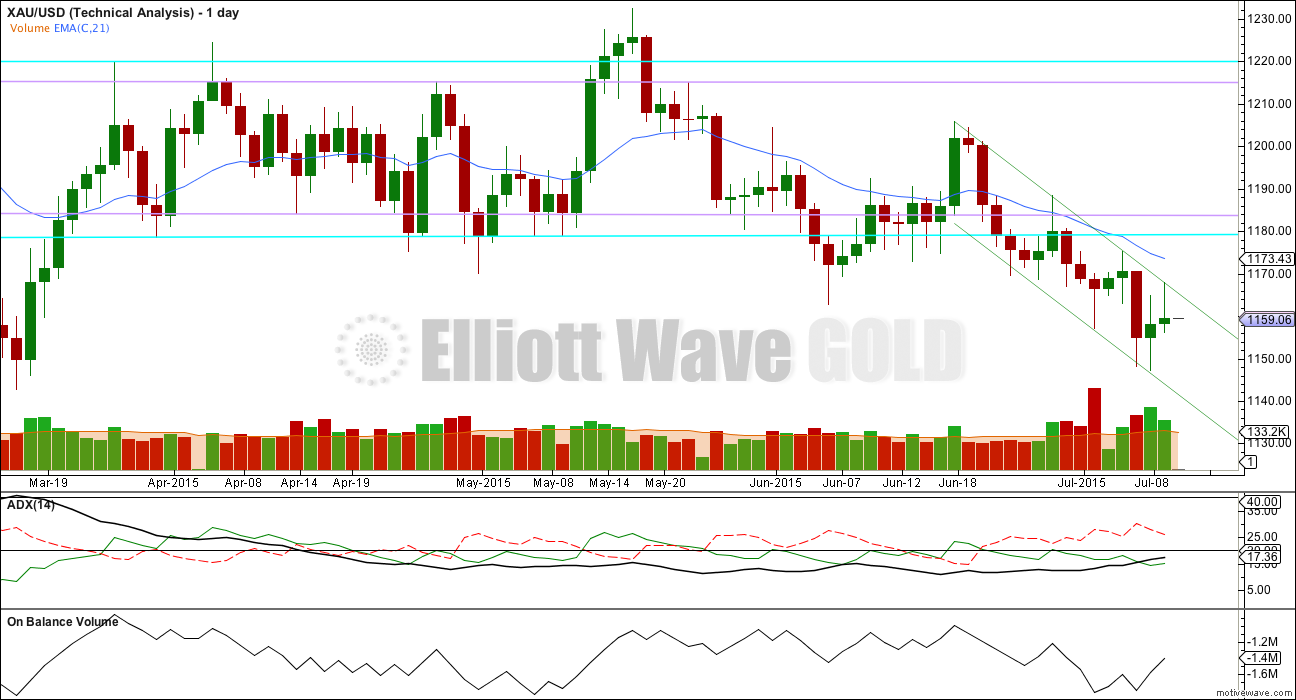
Daily Chart: ADX continues to trend up and is now comfortably above 15 at 17.36. ADX is indicating it is likely that a new trend is in its early stages. The -DX line (red dashed) is above the +DX line (green solid) indicating the trend is down.
The upper wick of Thursday’s candlestick is much longer than the lower wick. This is a small bearish indicator; there was a close match (not quite a balance, the bulls were overall more active) between bulls and bears, but the bulls couldn’t keep price at the highs for the day and the bears managed to push it significantly lower.
Volume was lighter than the prior upwards day. Overall bulls were more active, but this has occurred on lighter volume. This is again bearish.
It is significant that the upper green trend line is again providing resistance. The more often a trend line is tested and holds, the more technically significant it is.
It is still the most recent day of 2nd July which has strongest volume, a down day with 285.8K. Overall volume still is more bearish.
This analysis is published about 05:41 p.m. EST.
fyi Re: Silver, bull count invalidataed 7-7-15. Price Low 14.65 provides 1st confirmation of bear count(breaching 15.296), awaiting 14.077 for final confirmation of bear in Silver.
I bought back DUST 9 seconds before it closed at 21.20.
DUST dropped 25 cents in the last 2 minutes.
$21.235 Time: 3:59:51 PM EDT 10-Jul-2015
Lara sounded pretty Bearish in her Friday comments.
If Greece completes their deal on Sunday gold should drop.
Greece has to complete the deal Sunday or get kicked out of EURO.
This is the timetable for deciding Greece’s fate in the euro
Published: July 10, 2015 8:31 a.m. ET
http://www.marketwatch.com/story/this-is-the-timetable-for-deciding-greeces-fate-in-the-euro-2015-07-10?mod=MW_story_top_stories
Yellen also strongly suggested that the FOMC will raise rates in 2015. That was the trigger for the move down today.
A lot of things could have moved gold up this week, but it never seriously reacted. If gold doesn’t move in times of crisis, what happens when the world is at ease (Chinese stock market is stable, the dollar moves up and Greece makes a deal)?
Well said Matt thanks.
Lara, having the time post on comments is definitely easy to view, but is there a way to set the clock to my time zone? As seeing the time post from a different time zone is very difficult. If the time must post as it is currently I actually prefer the older method of seeing xx minutes ago, or x hr xx minutes, etc. Has anyone else voted this way? Is it possible to change this?
Hope you can appreciate this message on a “lighter” topic – haha.
Looking forward to today’s analysis, as always.
It looks to me as though the time is market time (New York, USA). Maybe that will help since you probably already have to know where you are relative to market time.
thanks. It’s just that it is so difficult switching from one site to another. The site I use for XAU posts in my time zone. The charting software site I chart on is another time zone. I guess it looks like EWG is the same as the charting software time (which is hard on me). We work calculations running thru our head all day – my chart fee is 15-min delayed data. With fast movements it can make it difficult to run thru what came first. But thanks for clarifying that EWG is NY time.
It’s not possible for each member to set the time to a different time zone. It’s set only in one place on the backend of the site.
We’ve set it to NY time so that it fits with the analysis.
I know different time zones can be confusing, I share that problem with you. I live in NZ +13GMT and I work on NY time. With both NY and NZ having daylight savings I’m permanently confused LOL.
That’s funny Lara. You can decode the most complex stock trading language in the known universe and yet you find daylight savings time and multi time zones confusing. I’m the reverse. Now I don’t feel so bad, thanks. LOL
P.S. It helps that I live in EST like the NYSE, otherwise I’d be confused too. LOL
What it is Richard, is, the smart women depend on little things like “clocks” to help us out in our complex lives, not confuse us. And they just aren’t cooperating!
Ooops, I’ve given myself away. : )
LOL LOL! Permanently! 🙂
Swap’s are net long gold.
In the last 8 weeks, Swaps have closed 30k shorts, and added 21K longs. While MM’s have closed 21K longs and added 54K shorts.
WOW. The billion banks are currently net long (gross long-gross short).
I look at data since Jan 2010, and in all of that time, the bullion banks have only been net long 3 other weeks, and that was July 2012.
MM is only 2100 contracts net long. The lowest in 5.5 years.
Davey,
I will be updating my COT analysis in about 15 minutes, and keeping an eye on the close. I may hedge my junior miners over the weekend.
Ben, thanks I appreciate your unique perspective.
I’m only very slightly concerned about today’s small green candlestick because it’s come on even lighter volume. This rise in price is not supported by volume, it’s suspicious, it looks typically corrective.
That upper trend line on the daily chart (which is on a semi-log scale) has again been tested. And it’s holding. So another wave down from here is expected.
I’ll only be concerned for the wave count if that trend line is breached on an increase in volume.
On the hourly chart I’m having difficulty seeing the wave down from the last high at the end of micro wave 2 as a five. I need to spend time on the five and one minute chart for this.
The upwards movement for today is again clearly corrective, so that’s some small support for a downwards trend.
ADX is still clearly and strongly telling us there’s a downwards trend. The regular TA today supports the main wave count.
I’m off to finish that analysis now. Good luck everyone, and have a fab weekend!
Thanks Lara, that’s very helpful.
Lara, is there anything about today’s movement that would raise concern for the bear wave count, or is rather confidence significantly increased?
If you want to be really picky then the wave down from the end of micro wave 2 on the hourly chart doesn’t look like a clear five at the hourly chart level. On the five minute chart it’s really choppy and overlapping.
That’s my only concern though, and there are more TA indicators that there is a downwards trend in place.
So at this stage no, I wouldn’t be concerned.
The upper trend line is holding, and volume today is light. This upwards move looks like a typical correction against a downwards trend, both from an EW point of view and a regular TA POV.
Lara (other EW gurus chime in)
If Bear prevails and carries gold down to approximately 950, under EW rules, how high can Bear take gold over next 2-3 years (after 950 low) ?
Anywhere up to, but not above 1,921.15.
That’s because A is a five.
Thanks Lara.
I believe that the EW answer would be something along the lines of that gold cannot move above the start of its first wave (1900).
That said, I personally take a different view on this because I feel that it is extremely difficult to judge where gold is in its wavecount on a multi-year/ multi-decade level. When the time comes, I will make a longer term investment instead of trading the up move. The popular targets are $5000-8000, based on where gold should be in today’s dollars.
Looks like Lara already beat me to the answer on the first part.
Matt, you picked up on my underlying question.
I am believing, because of worldwide economic conditions, gold must move lower (maybe 1000 – 800) before turning considerably higher over next 2-3 years.
EW Bear gets gold down but does not allow gold above approximately 1900.
EW Bull struggles to get gold down to 1000 but does allow gold considerable move up.
So the answer to EW Bear or EW Bull remains elusive and consequently makes investment dangerous.
Your 2nd paragraph maps out about the best strategy I can find given the situation, but I continue to look for more clarity.
The EW bull wave count also sees A down as a five so B up still can’t move above it’s start at 1,921.15.
Lara, aaaah I should have seen that, thanks for pointing it out, maybe kept me from a big mistake.
If the wave count is correct, gold just had its peak and should tumble from here. Confirmation would come with movement below the start of this C wave (1158.86).
Here we go….
Looks like gold is finally in a 3rd of a 3rd, of a 3rd, of a 3rd, of a 3rd, of a 3rd……
Hi. Hope you are right. A break below 1158-57 is still required. Appears Gold price is still wobbling / basing off 1159….
We’ll either have that momentarily, or gold holds here over the weekend to keep traders guessing. Further lows are imminent.
The fact that gold is closing below 1162 is a very bearish sign.
How many days are we into this correction?
I’ll bet a cup of coffee it doesn’t break down today.
Re: lol! nice!
Use your coffee money to add to your short position. 🙂
Sure, with upside 1165-67 limiting expect continuation to further lows. So happens Gold price is as yet having an inside day to Thursday…. A break below 1157/55 today would be worthwhile to take away some of the suspense and not keep traders guessing lol….
Don’t count on closing below 1162 until it happens.
The first hurdle that was cleared today was movement below the B wave of the 2nd wave correction. That marks the end of a simple zigzag. The next hurdle, or confirmation, is only 60 cents away from today’s low. Once that gets broken, the chances of further corrective movement (double zigzag or combination) go way down. From my experience, gold is too close to this target for it to completely turn around.
The suspense encourages more longs to enter the market, which, in turn, will make gold drop even faster when the stops get hit on the way down. So, it’s a good thing! 🙂
We are at the edge of a cliff, fasten your seatbelts!!!
I already sold my DUST today for a profit.
DUST looked like it peaked for the day at 10:51 am.
Optimism in Europe over Greece moved up the EURO , down US dollar, up gold.
The euro is having its best day in nearly 2 weeks
Greece Sunday decision could move gold either way.
Will wait for Lara’s comments for clarity.
This could be a good spot to add/start oil short at ~52.75-52.85
Ben, do you see oil as short term trade or possibly intend to hold oil short all the way down to target of 20s ?
If we get through 52 impulsively, I will probably hold it for much of the ride down. I am still waiting for the drop through 52. It may pop up to 54 again, so I am watching that.
I am going to take my profits on oil today, I dont like how it hasn’t dropped back down. I will wait for another entry early next week.
Interesting action. I think miners finished their iii wave.
Shorted oil this morning at 53.10, will add on an impulsive break of 52.
With a narrow trade range of H 1166.90 / L 1155.10 on Thursday, a break below 1155 would be required to seek downside continuation for target a break below 1150-49….
If the count is correct, then we are now in wave 3 of (1) of circle 3
We need to see evidence of this wave by some sort of impulsive move to the
downside very soon
If Greece deal is done over the weekend then stocks up and gold down. The market is worried about that now.
Volume as shown on pmbulls non-flash is low today.
Yesterday’s downmove looks like a 5 and the overnight looks corrective. The question in my mind is whether today will continue the overnight corrective attitude or be impulsive down. Miners are down at the moment.
looks like 2 of 1 of 3 just ended
would need to see this 3rd wave of 1 of 3 to reach 1153 today
to have confidence that the count is correct
Janet’s speech i n 30 min likely to launch gold higher
no conviction that this is a 3rd wave decline
Gold looks like it is in a final C wave correction up. If correct, should be done today….and may have just happened.
Lara: The red -DX line of ADX is pointing down and green +DX is pointing up. That tells me gold will go higher til red reverses and start going up. If red crosses below green gold will be up. Black turning up above 15 is a trend change but it may be for up based on the red/green crosses???????
I am learning to interpret ADX teck indicator.
Hi @Papudi: If this is about selling refrigerators to Eskimo’s: Daily ADX moving above 20 (trend is strong); DMI- is above DMI+, a down trend is in place….Also consider when ADX rises above 20 for the first time as it has done recently and then goes flat for some time, a new trend is likely being formed with price reacting to this new trend formation by making first initial correction. During this correction it is a good time to initiate new orders…. ////…. AVERAGE DIRECTIONAL MOVEMENT INDEX (ADX): The ADX does not indicate trend direction, only trend strength. It is a lagging indicator. The ADX defines the degree of directional movement, not the direction. A trend must have established itself before the ADX will generate a signal that a trend is underway. ADX will range between 0 and 100. Generally, ADX readings below 20 indicate trend weakness, and readings above 40 indicate trend strength. An extremely strong trend is indicated by readings above 50…. ////…. Reference ASHWANI GUJRAL: In general, the following rules may be followed with regard to the ADX: [1]. ADX less than 20 is interpreted as a weak trend or consolidation; use oscillators [2]. ADX rising from 15 to 25 from lower levels means the trend is strengthening; use trend-following systems [3]. ADX above 30 is interpreted as a strong trend; use trend-following systems [4]. ADX at an extremely high level of 45 or above is interpreted as a market in a strong trend with a consolidation expected anytime. Start booking profits if the ADX makes a top or flattens out [5]. ADX declining below 30 is interpreted as a consolidation after a trending move. Use oscillators or credit spreads to trade these consolidations. If bearish patterns develop and break down, look for ADX to move higher, this time indicating a trending move on the downside.
Thanks for your reply.
The only thing I would add to Syed’s reply is that the up / down of the +DX and -DX lines isn’t an indicator of the trend, it’s which line is above the other. Don’t worry about them pointing up and then down, just look at which line is strongest. Trends don’t move in one straight line, they all have smaller corrections along the way.
The black ADX line tells us there is still a trend (and it’s getting stronger), the -DX line is still above the +DX line so that trend is still down.
Looks like we re above the channel now
Not the daily channel, which is the one that matters like yesterday.
I may be mistaken.
On the daily chart price absolutely perfectly again touches the upper trend line. No breach at all.
Lara,
Are the subminuette and micro waves that are identified as ‘minutes’ for length unusually long when they last 1.5 to 2 days? I’m guessing this is a guideline, but I’m curious if this is abnormal to have micro waves lasting 2 days.
Thanks!
Those durations are a really rough guideline. I know it seems weird, but think about what happens when waves extend.
If a first wave is quick and short and followed by a third wave which is 2.618 or longer of the first, then it’s extended necessarily in duration as well as price. This means it’s subdivisions all last much longer too.
The most important degrees are the higher ones. That has to be right on the monthly chart and you move down from there.
So yes. Micro waves within extended waves can last days.
Thanks for clarifying. I appreciate the time you take to answer all of the questions.
I like the after hours drop in gold. The daily upper trend line has been solid resistance since June 21st. I bought some DUST tonight.
Great. That’s a fantastic opportunity for your entry point that upper trend line Richard. Simple and classic.
Simple is best.
US Dollar may have broken out to the upside and then back tested the breakout. A move up in the dollar here would likely be a wave 5 and would support a drop in Gold.
Weekly US Dollar