
Primary wave 5 is still in its early stages.
The Elliott wave count is adjusted and the target is recalculated.
Summary: Fifth waves on commodities are often very swift and strong. The target for this one to end is at 21.96 and may be met in another six months time. A shorter term target for an interruption to the downwards trend is recalculated at 42.87.
Changes and additions to last analysis are bold.
MONTHLY ELLIOTT WAVE COUNT
Click chart to enlarge.
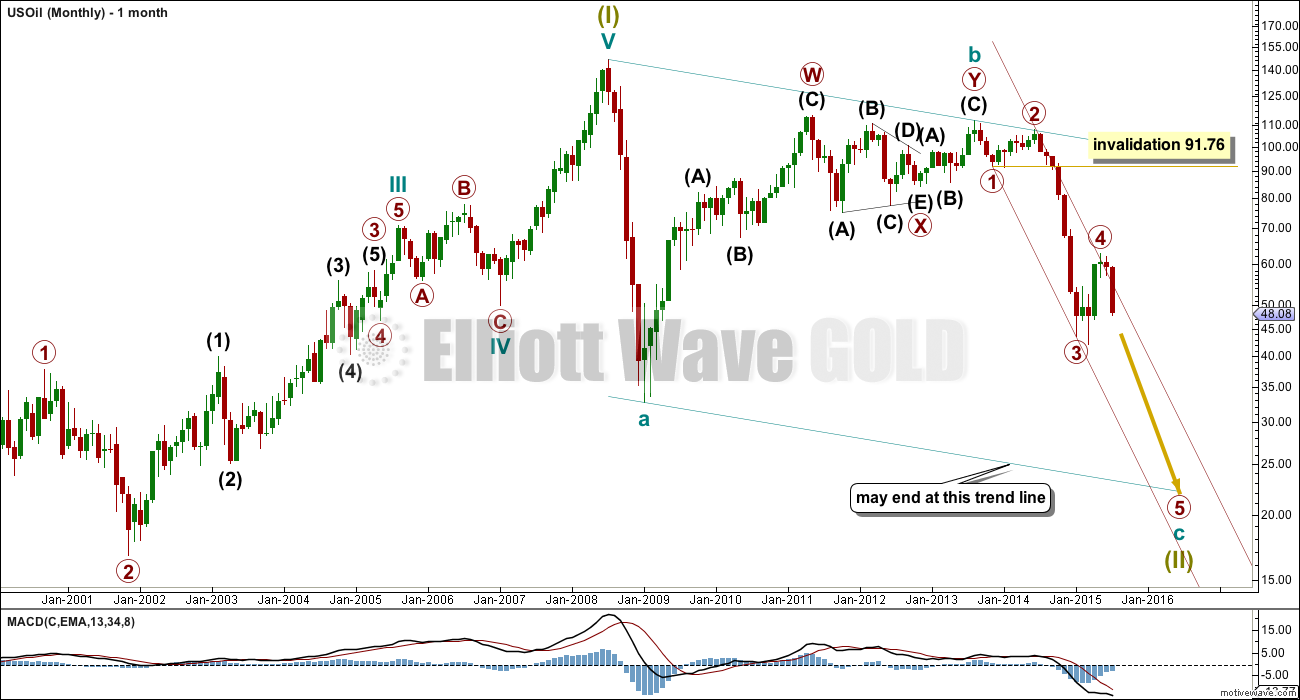
This wave count sees US Oil as within a big super cycle wave (II) zigzag. Cycle wave c is highly likely to move at least slightly below the end of cycle wave a at 32.70 to avoid a truncation. Cycle wave c may end when price touches the lower edge of the big teal channel about this zigzag.
Within cycle wave c, primary wave 5 is expected to be extended which is common for commodities.
Primary wave 4 may not move into primary wave 1 price territory above 91.76.
Draw a channel about this unfolding impulse downwards. Draw the first trend line from the lows labelled primary waves 1 and 3 then place a parallel copy on the end of primary wave 2. Copy this maroon trend line carefully over to the daily chart.
DAILY ELLIOTT WAVE COUNT
Click chart to enlarge.
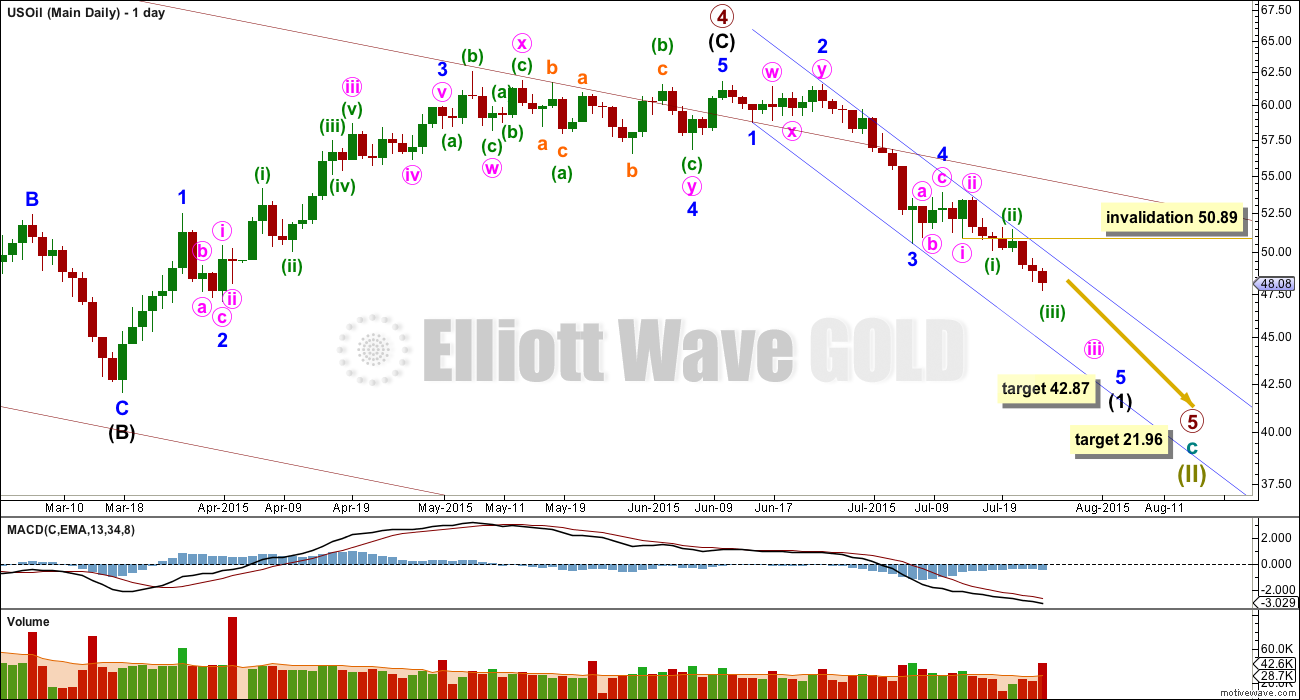
A first wave down is still incomplete. I am moving the degree of labelling within it up one and moving the third and fourth wave lower. There is no Fibonacci ratio between minor waves 1 and 3. This means there is very likely to be a Fibonacci ratio between minor wave 5 and either of 1 or 3. At 42.87 minor wave 5 would reach equality in length with minor wave 1. Minor wave 5 may end in another eleven days if it lasts a total Fibonacci twenty one days / sessions.
Draw a channel about intermediate wave (1) using Elliott’s first technique: draw the first trend line from the ends of minor waves 1 to 3 then place a parallel copy on the end of minor wave 2. This channel is a perfect fit. Only when price clearly breaches the upper edge of the channel with a full daily candlestick will I expect that intermediate wave (1) is over. While price remains within the channel expect the downwards trend to continue and upwards corrections to find resistance at the upper edge of the channel.
Minor wave 5 may be a typically swift strong fifth wave (it does not have to be, but this is a tendency of commodities so look out for it). If that happens, then the lower edge of the channel may not provide support. If price breaks below the lower edge of the channel, then downwards momentum may increase substantially.
Within minor wave 5, minute wave iv to come may not move into minute wave i price territory above 50.89.
TECHNICAL ANALYSIS
Click chart to enlarge.
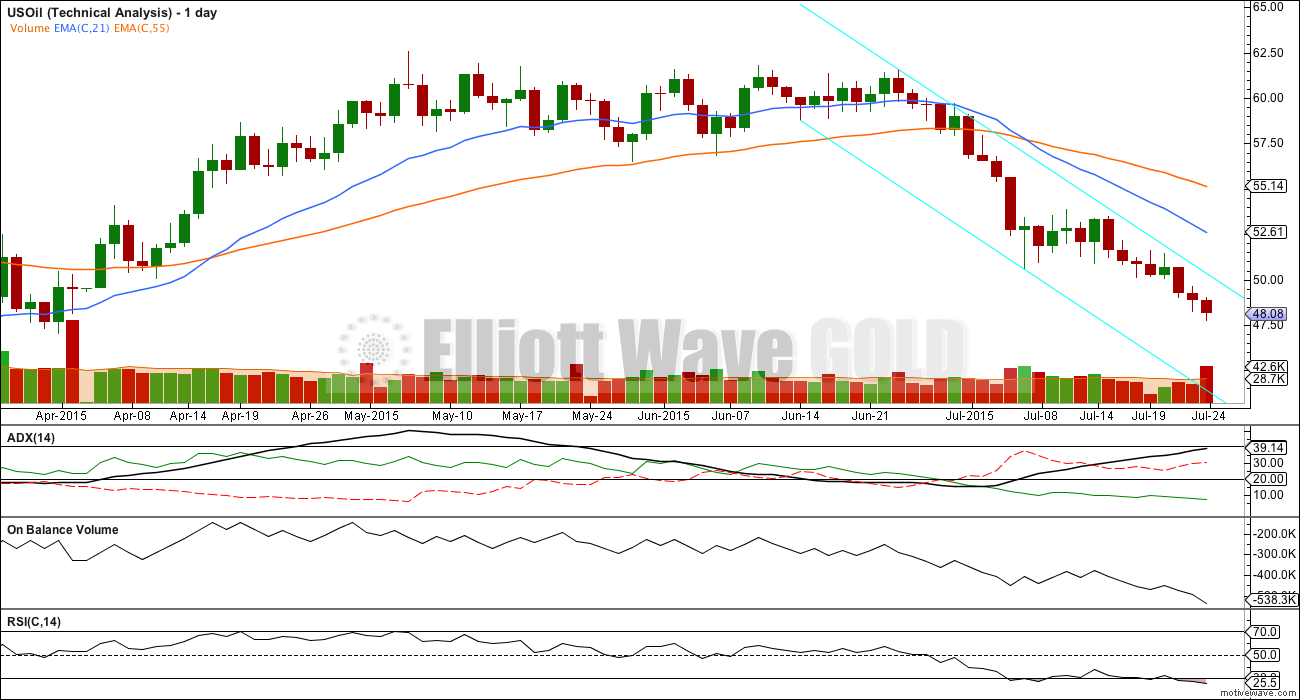
ADX is still clear. The ADX line is above 20 and rising indicating a trend which is strengthening. The -DX line (red dashed) is above the +DX line (green solid) indicating the trend is down.
When a market is trending, then a trend following system should be used for trading. The simplest trend following system uses lines of support and resistance. For a downwards trend, upwards movement may be expected to be corrections against the trend and should end when price finds resistance. As each short term high is made it should not be exceeded again for some time. A trend should be assumed to continue while ADX continues to rise and price remains below resistance.
For the last three days, volume is overall increasing while price has fallen. The fall in price is now supported by volume.
On Balance Volume now agrees with price; as price falls OBV trends lower.
The shorter EMA is below the longer EMA, indicating the trend is down.
This regular technical analysis agrees with the Elliott wave count.
RSI is showing slightly oversold, but there is no divergence with price and RSI is not oversold yet at the weekly chart level. Only when there is clear divergence with price and RSI, then at the daily and weekly chart level would I expect a larger interruption to the downwards trend. For US Oil RSI can remain below 30 for reasonable periods of time before a low is found.
TREND LINES
Click chart to enlarge.
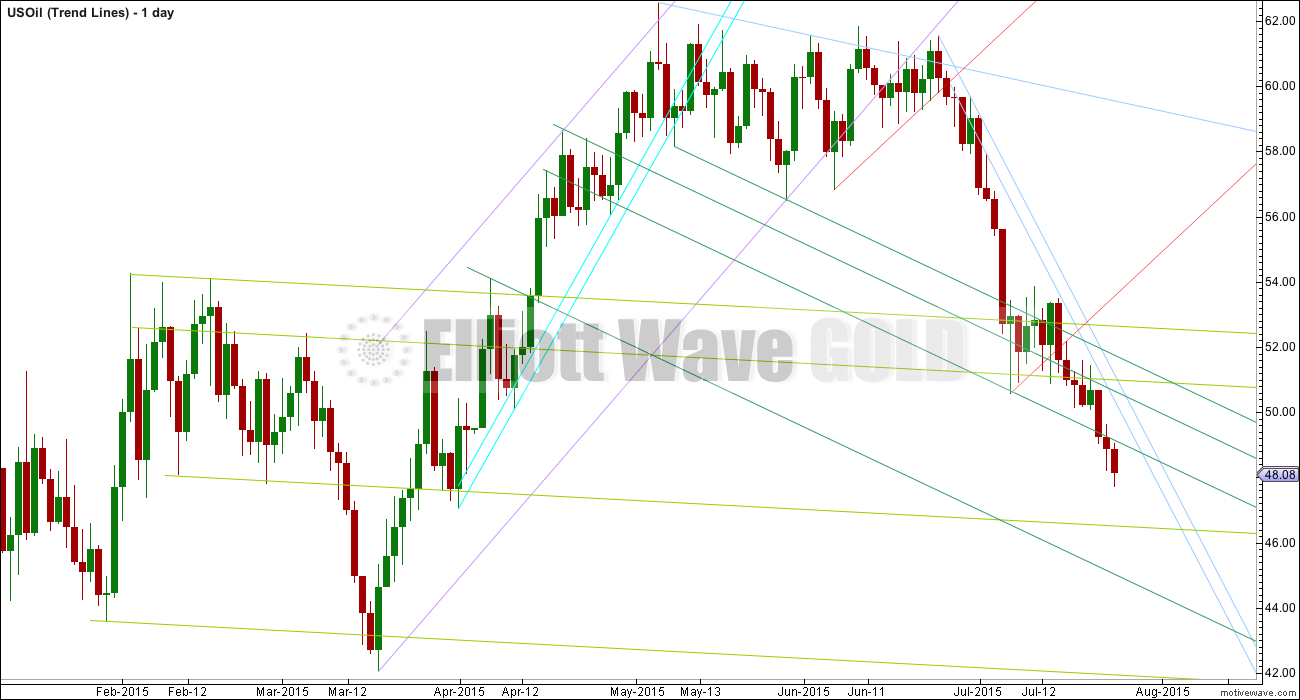
I use parallel trend lines to indicate potential areas of support and resistance.
This analysis is published about 05:30 a.m. EST.
Lara: You wrote:”Within minor wave 5, minute wave iv to come may not move into minute wave i price territory above 50.89.”
think oil may go as high as 52.40 to a right shoulder in daily. This will violate the above rule.
If oil does go higher what to expect: change in wave count?????
http://www.dentresearch.com/in-the-media/
watch the video form the 9th July
Oil will keep falling. It will force the frackers out of business. And when they default on the $600 billion in junk bonds and leveraged loans they’ve used to fund their drilling, it’ll be like the next subprime crisis in the U.S.!
Oil’s down. Stocks are down. Gold too.
from: http://www.dentresearch.com/
The Chinese markets are falling after a typical exponential rise, a bubble looks like it’s burst there.
I have the S&P500 as fairly likely to have turned already, with the other possibility of turning very soon for a new bear market.
Here in New Zealand we have a property market that looks like a typical bubble.
Overall I’d say it’s not looking good.
Which is more likely, $33 or $75 oil?
July 27, 2015 9:01 a.m. ET
http://www.marketwatch.com/story/which-is-more-likely-33-or-75-oil-2015-07-27?link=MW_popular