
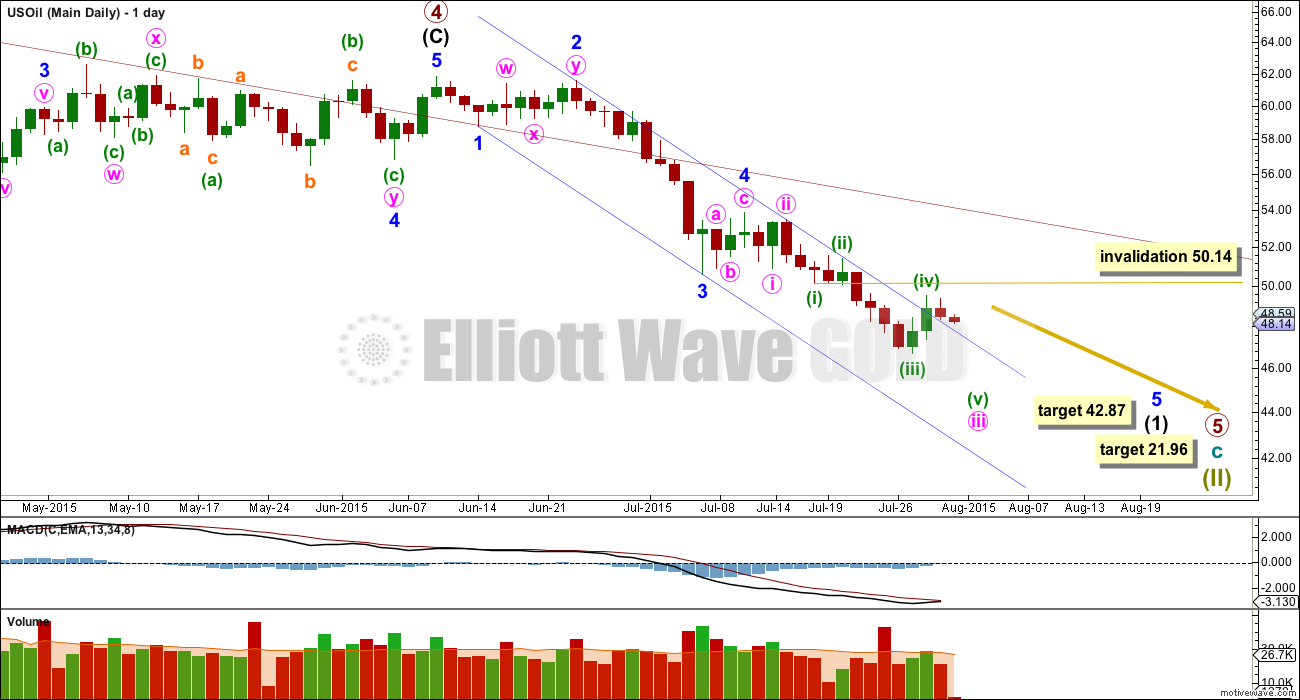
Price continues to move lower as expected.
Summary: Fifth waves on commodities are often very swift and strong. The target for this one to end is at 21.96 and may be met in another six months time. A shorter term target for an interruption to the downwards trend is recalculated at 42.87.
Changes and additions to last analysis are bold.
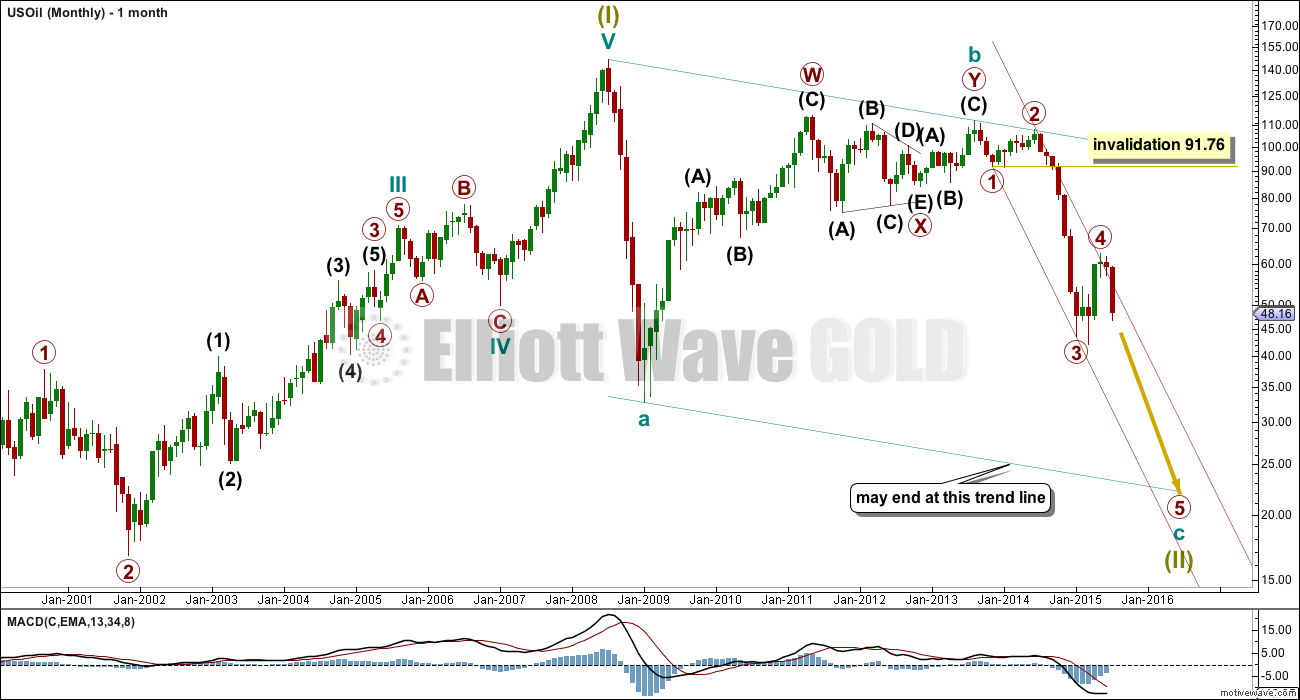
MONTHLY ELLIOTT WAVE COUNT
Click chart to enlarge.
This wave count sees US Oil as within a big super cycle wave (II) zigzag. Cycle wave c is highly likely to move at least slightly below the end of cycle wave a at 32.70 to avoid a truncation. Cycle wave c may end when price touches the lower edge of the big teal channel about this zigzag.
Within cycle wave c, primary wave 5 is expected to be extended which is common for commodities.
Primary wave 4 may not move into primary wave 1 price territory above 91.76.
Draw a channel about this unfolding impulse downwards. Draw the first trend line from the lows labelled primary waves 1 and 3 then place a parallel copy on the end of primary wave 2. Copy this maroon trend line carefully over to the daily chart.
DAILY ELLIOTT WAVE COUNT
Click chart to enlarge.
A first wave down is still incomplete. There is no Fibonacci ratio between minor waves 1 and 3. This means there is very likely to be a Fibonacci ratio between minor wave 5 and either of 1 or 3. At 42.87 minor wave 5 would reach equality in length with minor wave 1. Minor wave 5 may end in another eleven days if it lasts a total Fibonacci twenty one days / sessions.
Draw a channel about intermediate wave (1) using Elliott’s first technique: draw the first trend line from the ends of minor waves 1 to 3 then place a parallel copy on the end of minor wave 2. This channel is no longer a perfect fit. It is now breached by two daily candlesticks, but it was not breached with upwards movement and so the breach may not be an indicator that intermediate wave (1) is over.
Minor wave 5 may be a typically swift strong fifth wave (it does not have to be, but this is a tendency of commodities so look out for it). If that happens, then the lower edge of the channel may not provide support. If price breaks below the lower edge of the channel, then downwards momentum may increase substantially.
Within minor wave 5, minuette wave iv may not move into minuette wave i price territory above 50.14.
I have looked to see if the structure for intermediate wave (1) could be complete, and the final fifth wave looks like it still needs to move lower. I do not think downwards movement will be interrupted yet by a larger correction.
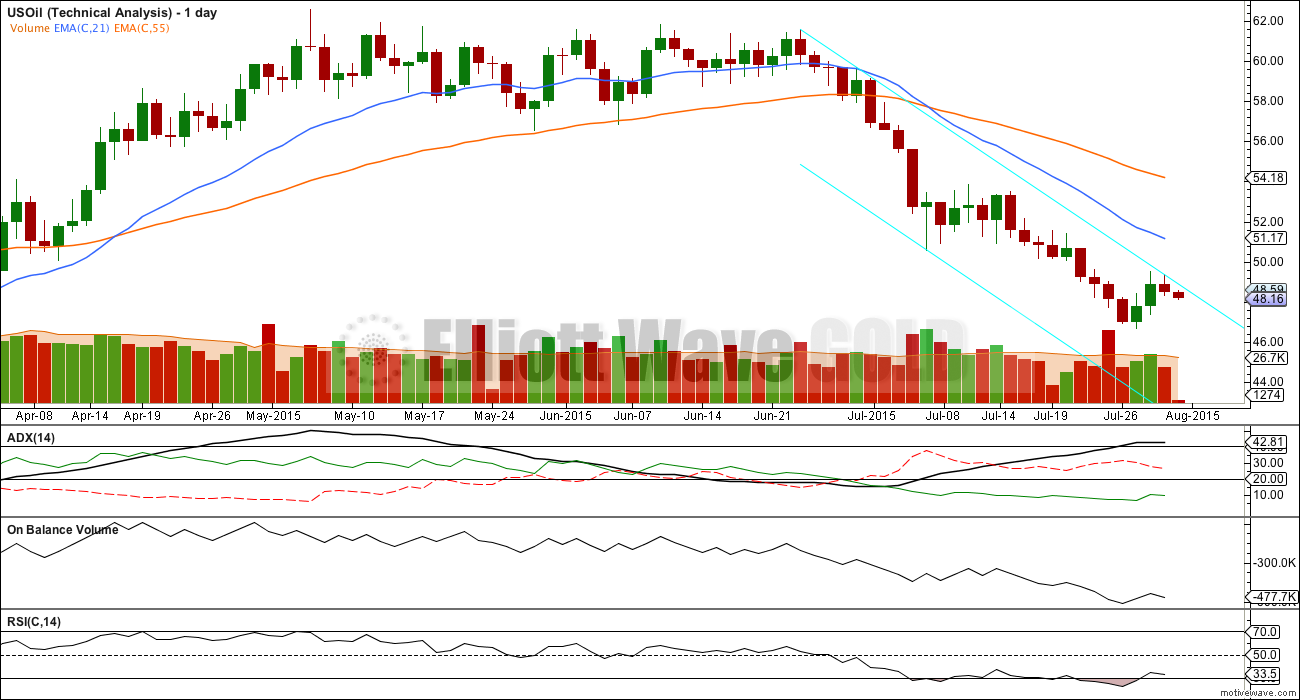
TECHNICAL ANALYSIS
Click chart to enlarge.
ADX is no longer as clear; it is flattening off. If it turns back up in the next one or two days, then I would have more confidence in the Elliott wave count.
The bright aqua blue trend channel may be a better fit for this downwards movement now than the Elliott channel. The upper trend line especially so.
There is a slight cause for concern that the two upwards days of the most recent correction came with rising volume; if this was a correction it may be expected to more likely come with falling volume. That rise in price was supported by volume and may be an indicator that a larger upwards movement could unfold from here. This is in opposition to the Elliott wave count.
With RSI and Stochastics both now returning from oversold, there is again room for price to fall.
To have more confidence in a downwards trend, I would want to see a downwards day with stronger volume than the prior two upwards days and ADX to turn up again.
This analysis is published about 04:50 a.m. EST.
Great analysis Lara. After you posted this analysis, oil dropped ~ 3% in one day, strengthening the fact that fifth waves are swift and strong in commodities. Seems we are indeed in the middle of minor 5 of intermediate 1 then. Thanks!
You’re welcome!
May you profit well from this move. I’ll be updating US Oil only when it needs it; if targets change or if a trend channel is breached. Otherwise, expect it to keep going down.
I’ve not managed to find my entry point for US Oil, I tied my equity up with NZDUSD trades. I don’t like to hold more than two positions, and prefer one, because my broker fees are killing it.
So while I’m not trading US Oil I’ll keep the analysis public. But if I start to trade it again it will be private.
Oh thats not a good idea, I mean, if we all look to you for excellent analysis and then you decide not to publish it.
I believe that if you decide to trade US Oil you only need to post a disclosure, that you hold a position Long/Short/ December options with an oil company, whatever it is. I don’t think you need to provide the details of the trade. I hope you will look into this Lara because it would be a great loss (figuratively) to us traders if you decided to suddenly not publish Oil. And its not fair to you who does all the analysis work to not be able to benefit from it. I believe your ethics are solid. I’m sure there just needs to be a post – perhaps right at the top – that you hold a position.