
The Elliott wave count continues to unfold mostly as expected.
A breakout has not yet been indicated.
Summary: The structure for minute wave iv is still incomplete. Minute wave iv still needs one final fifth wave up to end it; to the upside the invalidation point is at 1,162.80, and to the downside the invalidation point remains at 1,105.18. Minute wave iv is expected to end on Tuesday at either 1,131 or 1,142. The bigger trend remains down; this current movement is still a correction against the trend. Only a break below 1,105.18 plus a red daily candlestick on higher volume would tell us a downwards breakout is underway.
To see weekly charts and analysis click here.
Changes to last analysis are bold.
ELLIOTT WAVE COUNT
Click chart to enlarge.
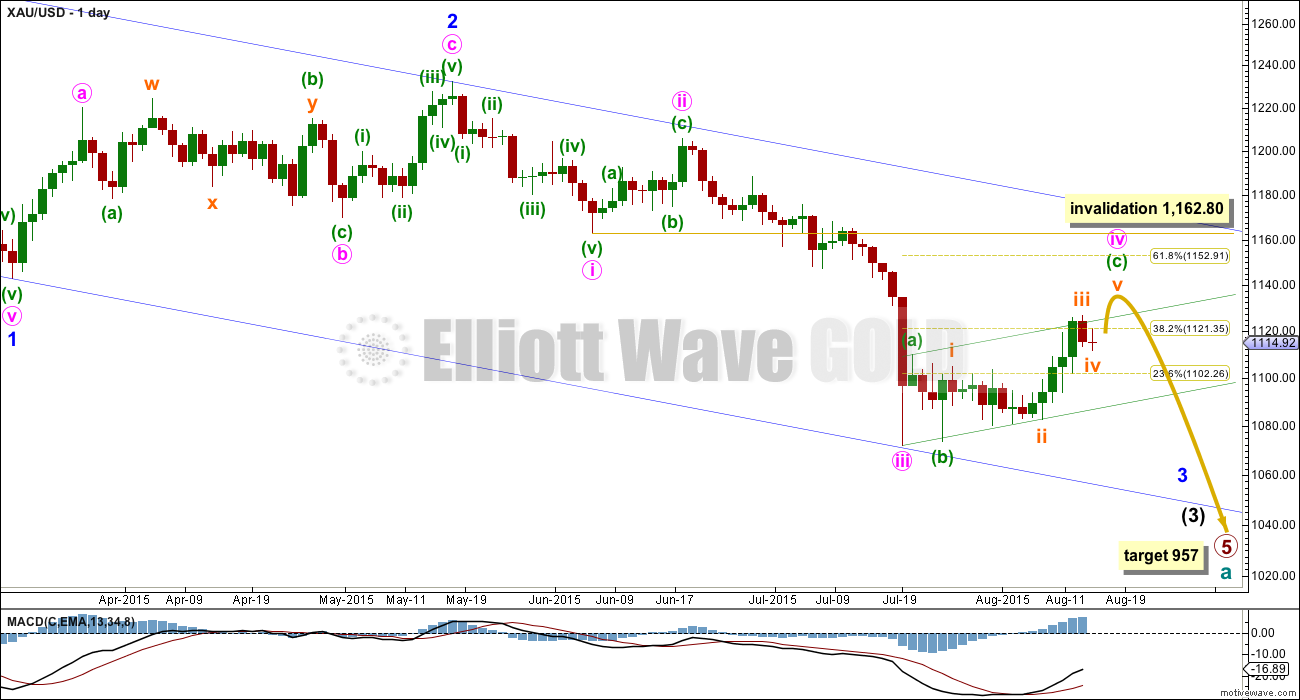
Cycle wave a is an incomplete impulse.
Within primary wave 5, the daily chart focuses on the middle of intermediate wave (3). Within intermediate wave (3), minor wave 3 now shows a slight increase in momentum beyond that seen for the end of minor wave 1 at the left of the chart. Third waves for Gold usually have clearly stronger momentum than its first waves, so I still expect to see a further increase in downwards momentum. The strongest downwards movement is still ahead of us, and now it may be expected to show up within the next fifth wave down of minute wave v to end minor wave 3. Gold often exhibits very strong fifth waves, and when it does this they usually turn up to end its third wave impulses.
It is possible (just, with an unusual looking expanded flat within it for a second wave) to see minute wave iii as over. The duration of this current correction indicates that despite the problem within its subdivisions minute wave iii must have been over and this current correction is minute wave iv.
Minute wave ii was a deep 0.618 single zigzag lasting nine days. Minute wave iv is a more shallow flat correction, which is still incomplete.
Minute wave iv may not move into minute wave i price territory above 1,162.80.
The blue channel is a base channel drawn about minor waves 1 and 2: draw the first trend line from the start of minor wave 1 (off to the left of the chart at the high of 1,308) to the end of minor wave 2, then place a parallel copy on the end of minor wave 1. The lower trend line perfectly shows where minute wave iii found support. Minor wave 3 should have the power to break through support at the lower trend line; when its fifth wave arrives, then it should be strong enough to do that.
There is no Fibonacci ratio between minute waves i and iii, which makes it very likely that minute wave v will exhibit a Fibonacci ratio to either of minute waves i or iii. When minute wave iv is confirmed as complete, then a target for minute wave v down may be calculated. It is likely to be extended and very strong.
Along the way down to the final target for primary wave 5 at 954, there will be two more big fourth wave corrections: one for minor wave 4 and another for intermediate wave (4). They may be expected to be less time consuming than their counterpart second wave corrections; they may also be expected to be shallow, but they will both still likely be multi week corrections (at least two weeks in the case of minor wave 4 and longer for intermediate wave (4) ).
At 957 primary wave 5 would reach equality in length with primary wave 1.
Click chart to enlarge.
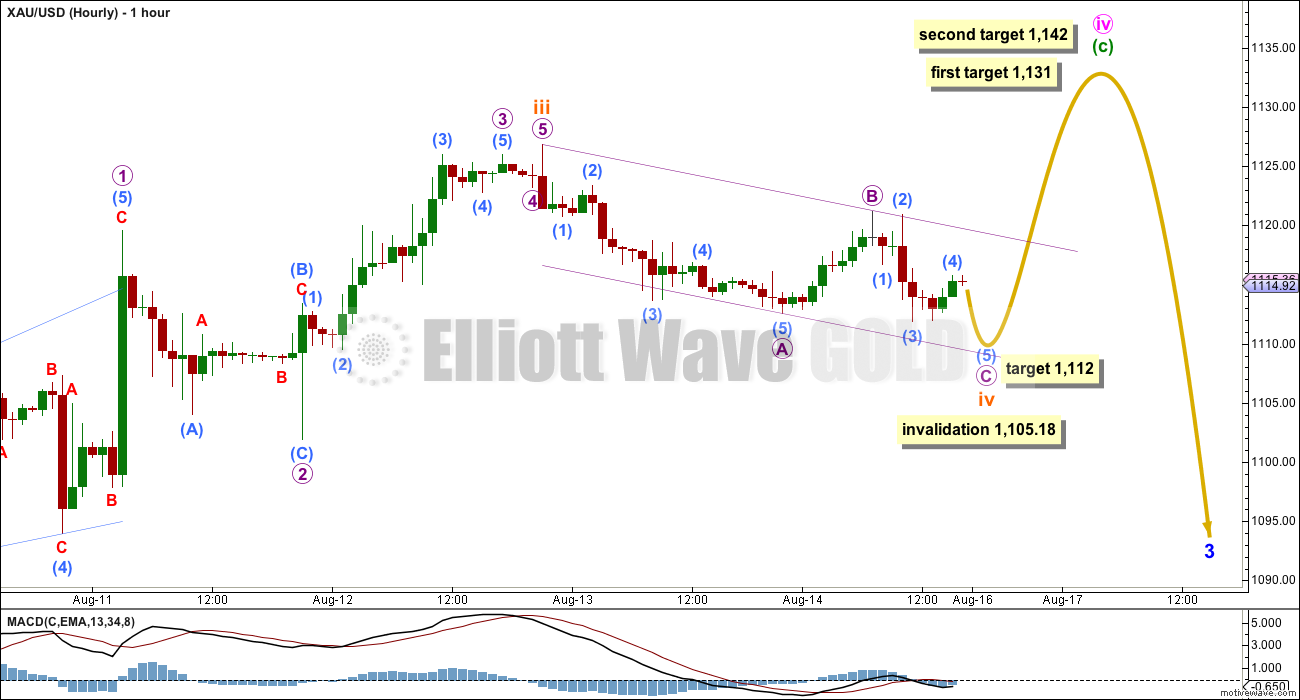
Within the flat correction of minute wave iv, minuette waves (a) and (b) both subdivide as three wave structures, and minuette wave (b) is a 97% correction of minuette wave (a) meeting the minimum requirement of 90% for a B wave within a flat. Minuette wave (c) may only be a five wave structure, and at this stage, it looks like an incomplete impulse.
Within the impulse, subminuette wave iv may not move into subminuette wave i price territory below 1,105.18.
Subminuette wave ii was a time consuming double combination. Subminuette wave iv may exhibit alternation as a quicker zigzag or zigzag multiple, or less likely a flat or triangle. At this stage, subminuette wave iv may be an incomplete single zigzag. At 1,112 micro wave C would reach 0.618 the length of micro wave A. Micro wave C is likely to move at least slightly below the end of micro wave A at 1,112.52 to avoid a truncation.
A new high above the start of micro wave C at 1,118.32 may not be a second wave correction within micro wave C; at that stage, micro wave C must be over. A new high would also bring price above the small channel containing subminuette wave iv; at that stage, subminuette wave v would be most likely underway.
At about 1,131, subminuette wave v would be about 0.618 the length of subminuette wave i and price would reach the first line of resistance on the technical analysis chart. If it does not end there, then the next target would be about 1,142 where subminuette wave v would be about equal in length with subminuette wave i.
When subminuette wave iv is complete and confirmed as over with a breach of the channel containing it, then I will calculate targets for subminuette wave v. Because I do not know where subminuette wave v begins, the targets provided today are a general guide and may change.
If the correction for minute wave iv continues for two more days and ends on Tuesday, then it would total a Fibonacci twenty one sessions. Give or take one day either side of this expectation would provide an acceptable Fibonacci relationship for minute wave iv, so it may end Monday, Tuesday or Wednesday with Tuesday the target at this stage.
TECHNICAL ANALYSIS
Click chart to enlarge.
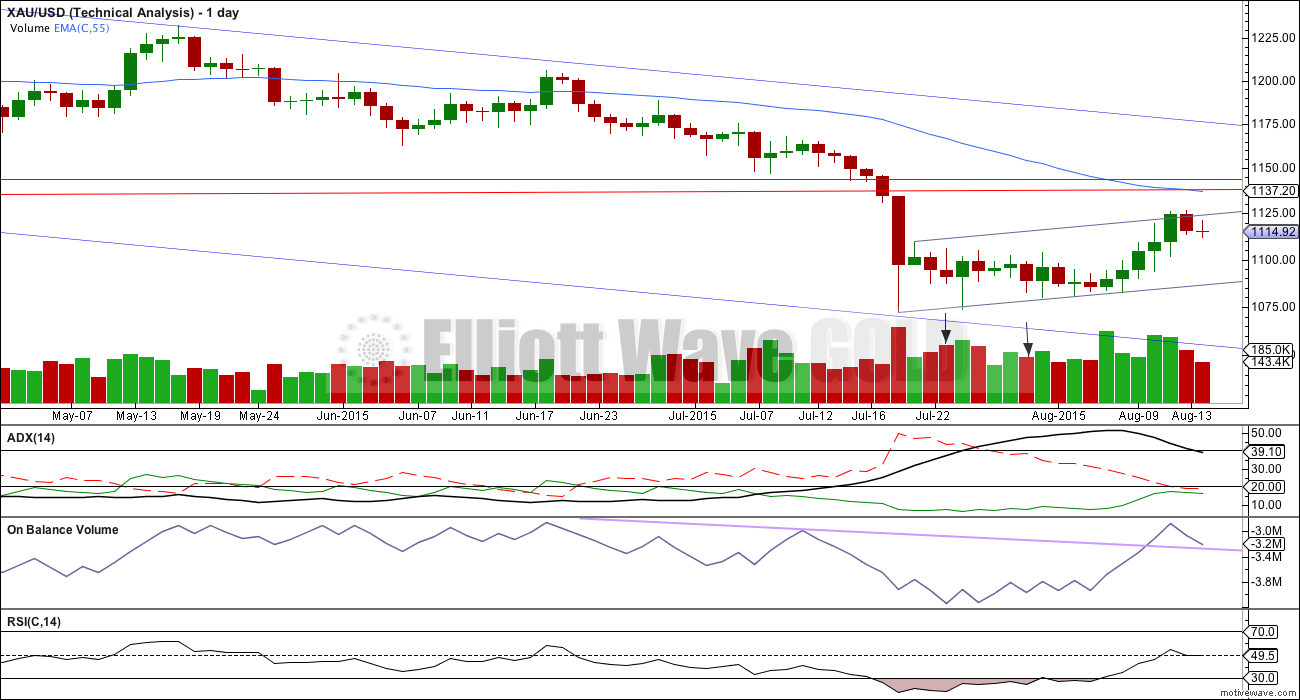
ADX is below 45 and clearly declining. A correction is likely. This is what has been unfolding now for over two weeks; ADX does tend to be a lagging indicator. However, at this stage, what ADX clearly shows today is that this upwards movement is not a new trend.
On Balance Volume has breached its long held lilac trend line, a very bullish indicator which is at odds with ADX. This now gives a mixed message about where price may be expected to go next.
I have added two horizontal trend lines of resistance, which were previously support. The first is at 1,131 from that low on 7th November 2014. The second is at 1,142 from the lows at 1st December 2014 and 17th March 2015. If price breaks above 1,131, then the next line at 1,142 may show where upwards movement ends. 1,142 was tested four times, so it is highly technically significant.
RSI has returned well into normal range. There is plenty of room for the market to rise or fall.
The EMA is changed to a Fibonacci 55 days. This may also provide some resistance.
Volume for the two days (indicated with black arrows) has been changed retrospectively. Previously these two downwards days showed higher volume than upwards days, which indicated a downwards breakout as more likely than upwards. This is no longer the case; this changed volume profile can be seen on separate data feeds, so should now be correct.
Overall, within this correction, it is upwards days now which have stronger volume, which would indicate an upwards breakout is more likely than downwards. However, this disagrees with ADX, which indicates the market is consolidating and not in a new upwards trend. While these two indicators give opposite messages, the picture is unclear; caution is advised. Declining volume for four days in a row now suggests this movement is nearing an end.
On Balance Volume has come to find support at the lilac trend line which previously provided resistance. A bounce up from here is suggested today by OBV.
The strongest piece of technical analysis on this chart is the horizontal lines of resistance, particularly 1,142. At this stage, it should be expected that price will respect that trend line.
Note: I am still searching for a reliable new data feed for Gold spot prices. I will use volume data from StockCharts to supplement this data from FXCM. Today both data feeds show volume for the last four days to be declining.
This analysis is published about 07:44 p.m. EST.
Are Bullish Seasonals Kicking In For Gold Now?
By Kira Brecht – Monday August 17, 2015 10:07
http://www.kitco.com/news/2015-08-17/Are-Bullish-Seasonals-Kicking-In-For-Gold-Now.html
This part of that report:
“Historically, a strong price period for gold develops from late August through the end of September or beginning of October”
That’s not what happened last year. 28th August, late August, was a high. Price moved consistently lower through August to find a low on 15th October. Then sideways. Then another wave down.
So that statement is factually incorrect.
Wonder what Lara thinks but it looks like it’s possible this is a small wave 2 following a leading expanding diagonal for wave 1 which started subminuette wave v up.
P.S. my data feed does not show a truncation, and shows micro c of subminuette wave 4 as a completed 5 wave structure.
The way I see it on an hourly pmbull.com chart is that your wave 1 is an impulsive non-diagonal, followed by a wave 2 that is an expanded flat (and we are in the 3rd subwave of that expanded flat).
I see what you did there, but in that wave 1 impulse up, doesn’t wave 4 go back into wave1 territory? If so that’s the problem, and then I thought it was easier to see all the subwaves as 3’s.
You have clearly looked at it in finer detail than I did.
Actually just looked it over again and i think I’m wrong about that, because the expanding diagonal actually does not overlap first and 4th waves, so I don’t think that can be it. Perhaps it could be a first wave up regular impulse counted differently than i was counting it and then an abc or wxy zigzag for wave 2 almost done now.
I can see a complete impulse for micro wave 1. Micro wave 2 may now be underway.
I’ll go with that because it’s more common than a leading diagonal for a first wave. It has nice Fibonacci ratios too.
Lara is gold still likely to hit its near term high of either 1131 or 1142 during Tuesday’s market hours then begin it’s approximate 8 to 13 day descent?
That is my expectation at this stage, yes.
NUGT 10min, nice bullish wedge from previous two days…Should fill gaps 5.21, 6.01 and as high as 6.73. Current trend is up and it’s your friend. Good luck with your trades.
Possible 4th wave triangle forming for (c) of iv up. If so, likely not much price variance for balance of day. Tomorrow a pop up to complete 5th wave of (c) of iv to Lara’s target, then we go down.
Tham, if you are out there, would appreciate hearing your latest thoughts on DUST ?
Davey, glad to oblige. I have reworked DUST over the weekend. It reached a high of 27.34 (exceeding my higher target of 26.67, hence the rework). This point 27.34 I now call minuette 4. There will be one last wave down to complete minuette 5 / minute c / Minor 2. My first target for the drop is 21.92. This would most likely coincide with gold’s 1131. The worst case scenario is if gold rises to 1163 at which my target is 14.66, an extended 5th.
Minor 3 will be a spectacular rise. At best, it could reach 60+, giving hope for a three-fold increase in DUST price. This would be in tandem with gold’s plunge towards 986. The target will be recalibrated when the end of Minor 2 is known.
Tham, thanks for your DUST analysis. Very insightful. I have been out of DUST almost 2 weeks and I trust you were as well.
Lara has been doing well for weeks and has probability of Gold about to top then begin slow or likely fast drop starting this week. The possible DUST low of your first target of $21.92 at gold 1131 sure sounds like a great buying opportunity in DUST.
I don’t know if your minor wave 3 DUST rise to $60+ at corresponding gold $986 may be a different time frame than Lara’s gold minor wave 3 ending in either 8 or 13 days in total give or take a day, with a possible triple in DUST in a week or 2 seems outstanding?
Thanks Tham.
Lara, How did you get this to fit? Looks like a three…?
This.
Once gold hits 1131 or 1142 then Gold may drop in Minute wave v either 8 or 13 days + or – 1 day to end minor wave 3 (blue) then may bounce up in Minor wave 4 at least 2 weeks.
Lara thought gold may drop after the open to 1112 then move up.
However that didn’t happen and gold is already on the way up.
The 8:30 US news pushed up gold above 1,118.32 to end micro wave C.
There was more news at 10:00 am.
MONDAY, AUG. 17
8:30 am Empire state index Aug. -14.9 4.5 3.9
10 am Home builders’ index Aug. 61 59 60
Lara did provide additional guidance of what to look for.
“A new high above the start of micro wave C at 1,118.32 may not be a second wave correction within micro wave C; at that stage, micro wave C must be over. A new high would also bring price above the small channel containing subminuette wave iv; at that stage, subminuette wave v would be most likely underway.
At about 1,131, subminuette wave v would be about 0.618 the length of subminuette wave i and price would reach the first line of resistance on the technical analysis chart. If it does not end there, then the next target would be about 1,142.”
Gold won’t drop to hit 1112. It is already on the way up to 1131 or 1142.
“A new high above 1,118.32 indicates micro wave C must be over.”
Then minute wave iv is expected to end on Tuesday up at either 1,131 or if it does not end there, then the next target would be about 1,142. It may end Monday, Tuesday or Wednesday with Tuesday the target at this stage.
Thanks Richard for reminding us, I was tempted to close my position.
There is an up trending support at $1094 (moving up by about $3 a day) which I would look for Gold price to break below…. So far Gold price is having an inside day to Friday trade range, probably winding up for a breakaway; I wonder which way it will go with $1122-24 still seen as curtailing…. Patience I guess.
Lara : can min wave iv be truncated around 1120 to 1126?
Unlikely.
Micro channel now breached on the hourly chart. Has Micro B continued as a flat? If so, it looks like micro C down may just have started.
I have found that Oil and Gold tend to go in the same direction.
Lara’s US Oil August 16th update just came out and shows oil about to drop and also mentions a bottom target of $22 in about 6 months, which is about half of current price.
Lara’s gold August 14th update has gold about to start a big drop in about 2 days and also has the gold bottom of $957 in about 34 weeks, about 8 months.
I’m looking to buy DUST at the 1,131 or 1,142 high by mid week.
Be aware that the FOMC minutes release is Wednesday 2 pm EST.
http://www.marketwatch.com/Economy-Politics/Calendars/Economic
Lara, we don’t know exactly when minute wave v will begin but can you project how long (trading days) after it begins minute wave v will last?
Minute wave i lasted 14 days, one longer than a Fibonacci 13.
Minute wave iii lasted 22 days, one longer than a Fibonacci 21.
Minute wave v may be likely to last either 8 or 13 days in total. But it may be quicker – give or take one either side of each number.
Thanks.
Awesome Lara, thanks a lot.
Your knowledge is very impressive and helpful.
Seeing as (4) has moved into (1) territory (1117 plus) could (C) be an ending diagonal? or is the hourly idea not practical anymore?
I do not understand your comment. Price remains above the invalidation point of 1,105.18.
Thanks for responding to my question..
but it cant be 5 waves down for circle C as you have on the hourly chart if price has gone up to 1117.5 which is in the price territory of (1) down. That is why I’m asking if it can still be a diagonal down to complete circle C?
If i’m beyond help then do you think the hourly chart as labelled is still feasible?
Thanks, I see what you mean now.
I think micro wave C is over, and may have ended with a very slightly truncated fifth wave.
This upwards movement looks like subminuette wave v.
Subminuette wave iv is over. The channel about it is breached.
The hourly chart as labelled is correct with the exception of where sub micro wave (4) was. It was over earlier.
This long term chart of gold shows that we bounced up from long term support around 1,080ish. A break of this level will likely ignite a swift move down, which supports Lara’s count. Note also that the monthly RSI has more room to move down, suggesting that gold has further to fall before bottoming.
Chart courtesy of Thirdeyeopentrades.
That chart is hardly inspiring for the bear case . It suggests it will take some months before we can break 1080 . I didn’t realize that line was there , will have to check that out .
Can anybody else corroborate the accuracy of that trendline ? Perhaps we are already below it ? Pretty please ? Not sure I can find a chart service that will go back that far .
I can replicate it on a semi log scale.
It’s only been tested once for resistance, once for support, before this current test.
That trendline seems to be drawn using the highs . Drawing one with the closing prices might help . If possible would like to see it enlarged .
Lara, playing around with gold’s chart over the last 2 weeks, I found out a scenario whereas we might have hit already wave 5 up of C of MIN 4, and we could have started already MIN 5. The lower volume of the last few days would reflect the beginning of MIN 5. I found out that alternate scenario with the 4-hour gold’s chart. MIN 3 might have ended on Jul 24th at ~ $1,077 (not on July 19th at ~ $1,083). If that would be the case, the 38.2% fib retrace of MIN 3 is $1,126-7, which we had already hit on Aug 12th. Therefore, if gold goes lower than $1,112 next week, it might confirm under this scenario that we are already in MIN 5.
It will be interesting to read what Lara has to say about your alternate proposal.
What is the invalidation for you wave count? 1126.7.
If wave v is over than Lara’s invalidation is at 1105.18 which should be taken out soon.
I explained in this video why minute iii would not end at that low. Go to 5:22 in the video to see the explanation.
Got it. Let’s see what happens this week.
IMHO Notwithstanding upside risk 113x-114x, Gold price bias is bullish as long as price is above 20dma ($1098-97) but as a rough cut, from a H $1205 / L $1076 Gold price has not been able to surpass with conviction 38.2% retracement around $1125-26 and now needs to get below 23.6% retracement around $1106…. It gives me a sense that Gold price may have made an interim top with the Thursday high of $1126.30…. Gold price is currently encountering resistance between $1116-20 and possibly looking to top with the upper Bollinger band at $1118-19. With a downturn in MacdMA, a pullback (short term decline) is in the making; it will remain to be seen if a break below $1105.18 mentioned in Lara analysis can occur. I would then look for Gold price to break below 10dma ($1101-$1100). Whilst DMI+ remains below DMI- indicative of down trend, CCI is long, momentum and ROC are bullish indicating an upside move to occur. It will remain to be seen if Gold price can get past $1124-26. With Friday H $1120.40 / L $111.10 relative narrow trade range, Gold price broke below Thursday low. A break below Friday low will likely indicate continuation to the downside $1110-08-06. If Gold price does begin to hover above the upper band, I’d look to short it in any case lol….
Lara.
Us Oil made a new low. Could you update when convenient. Thanks
Lara Time permitting may request you to post video of Grand Super cycle wave analysis will be nice to have.
Every weekend I re read this report to get myself recharge where gold’s trading limits are.
Thanks.
Interesting read on the financials of the GDX component miners, including their cost to mine an ounce of gold.
http://www.gold-eagle.com/article/gold-miners’-1200-cost-fallacy
Nice article. The cash cost for these companies may change as deflation takes hold. Miners cost of commodities will drop : energy, chemicals etc.
It is called real price of gold: Gold price / commodity index. GOLD/CRB.
real price of gold has been rising since 2007 when it bottomed. As this ratio goes up miners will be more profitable with the gold price.
I would be wary to listen to Adam Hamilton at Zeal LLC. I used to be a subscriber for a brief time, and quickly learned that in Adam’s world gold and miners can only go up, never down. Here is an alternate view on costs and accounting for gold miners. Food for thought. https://www.explorationinsights.com/pebble.asp?relid=3443
The one thing that I think is clear is that miners are cutting expenses, closing mines, and will be much more profitable when gold eventually bottoms and moves back up.
Thanks for posting dreamer.
Great analysis Lara. Thank you.
One question, I’ve observed that when a strong drop occurs, there may have been days and days of 1-2’s setting up wave 3’s and 5’s that washout and are hard to truly capture the counts. Do you expect we will have several 1-2’s to start this drop? In other words, maybe the end of iv is Tuesday, but it may take a week or two of 1-2’s to build that downward flush? Curious what you think.
And just a comment, one thing I have been thinking about lately is that I am part of this social mood that generates waves. If I am trading well, I am participating in one side of the energy, and when I am not trading well I am participating in the other side of the energy. Everyone who is trading is participating and creating the wave in exactly the shape it ends up taking….we are all responsible for the wave structure that ends up occurring.
Have a great weekend!
Yes, it’s fairly likely that it will start a bit more slowly with a series of nested 1-2, 1-2’s.
I’d look out for any surprises to be to the downside though, for this next wave down complacency and a relaxed approach may not work. I think we’ll have to be really on our game for this one, it could move fast.
It doesn’t have to be fast, it doesn’t have to be an extended strong fifth wave, but that is a tendency for Gold so we should be alert for the possibility.
I expect the third wave within it may be very swift.
And yeah, we’re all part of social mood. Even government, the Fed, big investment firms… all the decisions they make is all part of social mood.
I would be inclined to think that once this upward correction is done, the next move down will only last about 2 weeks or so before a much longer sideways/upwards correction. As Lara says, you’ll want to be very alert.
Commercials are starting to add to their short positions once again. Bearish for gold. This aligns with Lara’s analysis.
Great. Thank you for sharing that.
Maybe one or two days of slowing upwards movement will exhaust the bulls for a next huge drop down!