
Upwards movement was expected for Monday.
Summary: Upwards movement may end tomorrow about 1,132. If it does not end there tomorrow, then the next expectation would be Wednesday to see a high at 1,142 – 1,144. Upwards movement may end at any stage as soon as a new high is seen above 1,126.86.
To see weekly charts and analysis click here.
Changes to last analysis are bold.
ELLIOTT WAVE COUNT
Click chart to enlarge.
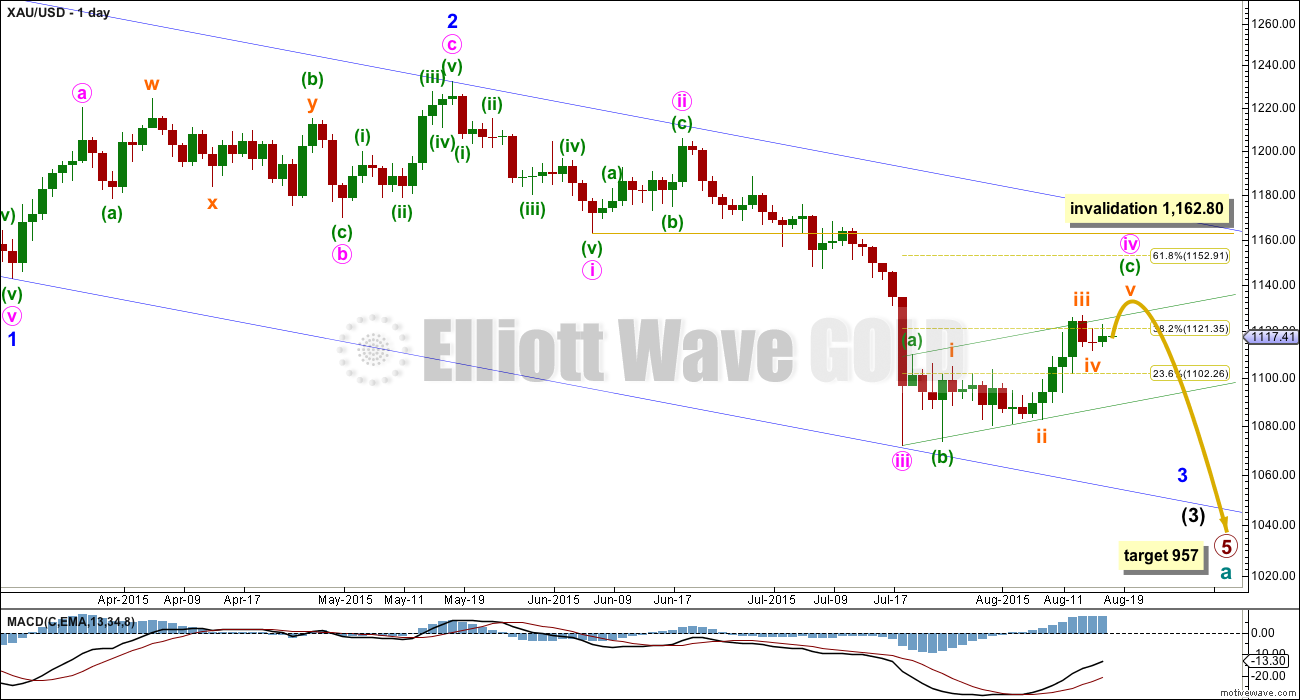
Cycle wave a is an incomplete impulse.
Within primary wave 5, the daily chart focuses on the middle of intermediate wave (3). Within intermediate wave (3), minor wave 3 now shows a slight increase in momentum beyond that seen for the end of minor wave 1 at the left of the chart. Third waves for Gold usually have clearly stronger momentum than its first waves, so I still expect to see a further increase in downwards momentum. The strongest downwards movement is still ahead of us, and now it may be expected to show up within the next fifth wave down of minute wave v to end minor wave 3. Gold often exhibits very strong fifth waves, and when it does this they usually turn up to end its third wave impulses.
It is possible (just, with an unusual looking expanded flat within it for a second wave) to see minute wave iii as over. The duration of this current correction indicates that despite the problem within its subdivisions minute wave iii must have been over and this current correction is minute wave iv.
Minute wave ii was a deep 0.618 single zigzag lasting nine days. Minute wave iv is a more shallow flat correction, which is still incomplete.
Minute wave iv may not move into minute wave i price territory above 1,162.80.
The blue channel is a base channel drawn about minor waves 1 and 2: draw the first trend line from the start of minor wave 1 (off to the left of the chart at the high of 1,308) to the end of minor wave 2, then place a parallel copy on the end of minor wave 1. The lower trend line perfectly shows where minute wave iii found support. Minor wave 3 should have the power to break through support at the lower trend line; when its fifth wave arrives, then it should be strong enough to do that.
There is no Fibonacci ratio between minute waves i and iii, which makes it very likely that minute wave v will exhibit a Fibonacci ratio to either of minute waves i or iii. When minute wave iv is confirmed as complete, then a target for minute wave v down may be calculated. It is likely to be extended and very strong.
Along the way down to the final target for primary wave 5 at 954, there will be two more big fourth wave corrections: one for minor wave 4 and another for intermediate wave (4). They may be expected to be less time consuming than their counterpart second wave corrections; they may also be expected to be shallow, but they will both still likely be multi week corrections (at least two weeks in the case of minor wave 4 and longer for intermediate wave (4) ).
At 957 primary wave 5 would reach equality in length with primary wave 1.
Click chart to enlarge.
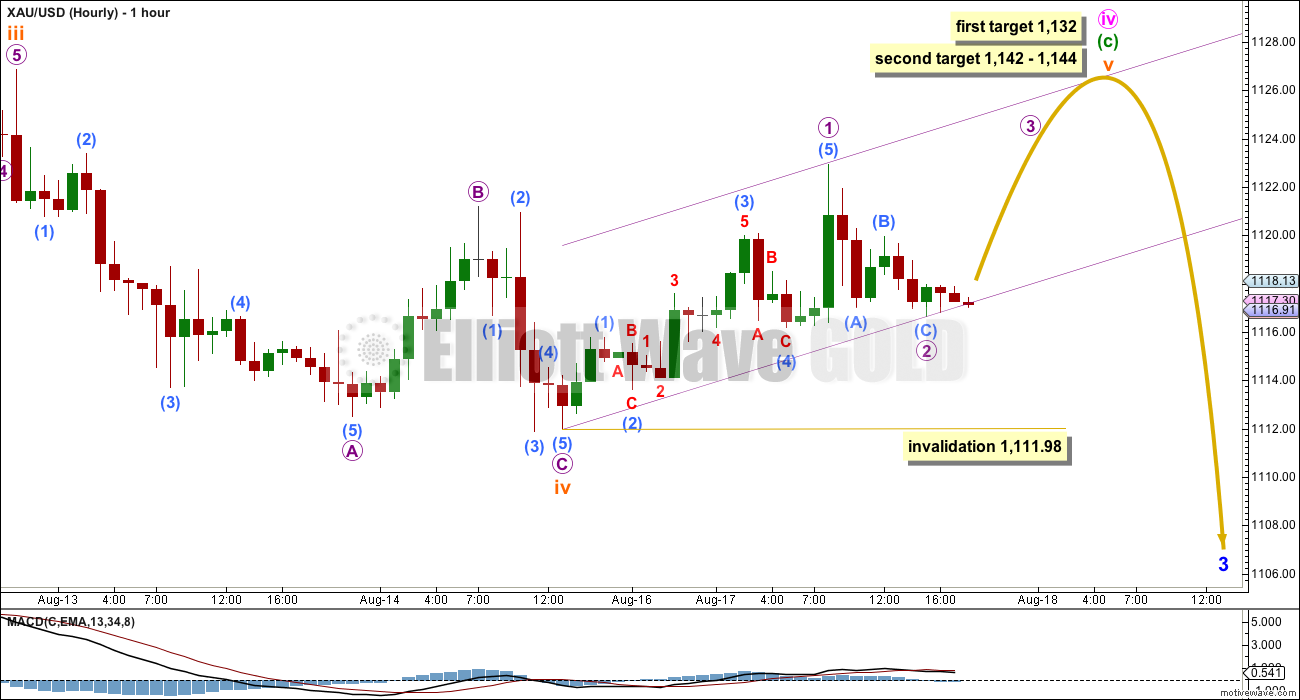
Within the flat correction of minute wave iv, minuette waves (a) and (b) both subdivide as three wave structures, and minuette wave (b) is a 97% correction of minuette wave (a) meeting the minimum requirement of 90% for a B wave within a flat. Minuette wave (c) may only be a five wave structure, and at this stage, it looks like an incomplete impulse.
Subminuette wave ii was a time consuming deep 0.71 double combination. Subminuette wave iv may now be over as a quicker zigzag and more shallow at 0.33 of subminuette wave iii. There is perfect alternation between subminuette waves ii and iv.
Upwards movement for Monday subdivides nicely as a completed impulse. This may be micro wave 1. Ratios within micro wave 1 are: submicro wave (3) is 0.24 longer than 1.618 the length of submicro wave (1), and submicro wave (5) is 0.39 longer than equality in length with submicro wave (3).
Micro wave 2 may also be over as a deep 0.57 zigzag; it looks like a completed three wave structure. The risk today is that micro wave 2 may not be over: either submicro wave (C) is continuing further or micro wave 2 may continue sideways as a flat or combination, or lower as a double zigzag. Micro wave 2 may not move below 1,111.98.
At 1,132, subminuette wave v would be 0.618 the length of subminuette wave i and price would reach the first line of resistance on the technical analysis chart. If it does not end there, then the next target would be about 1,142 – 1,144 where subminuette wave v would be equal in length with subminuette wave i and price would reach the second line of resistance on the technical analysis chart.
If the correction for minute wave iv ends tomorrow or Wednesday, then it would total a Fibonacci twenty one sessions or twenty two which would be an acceptable variation.
Draw a base channel about micro waves 1 and 2. If micro wave 2 continues lower, then redraw the channel. Micro wave 3 may be strong enough to break above the upper edge of the channel, but it does not have to. Along the way up, corrections should find support at the lower edge of the channel.
TECHNICAL ANALYSIS
Click chart to enlarge.
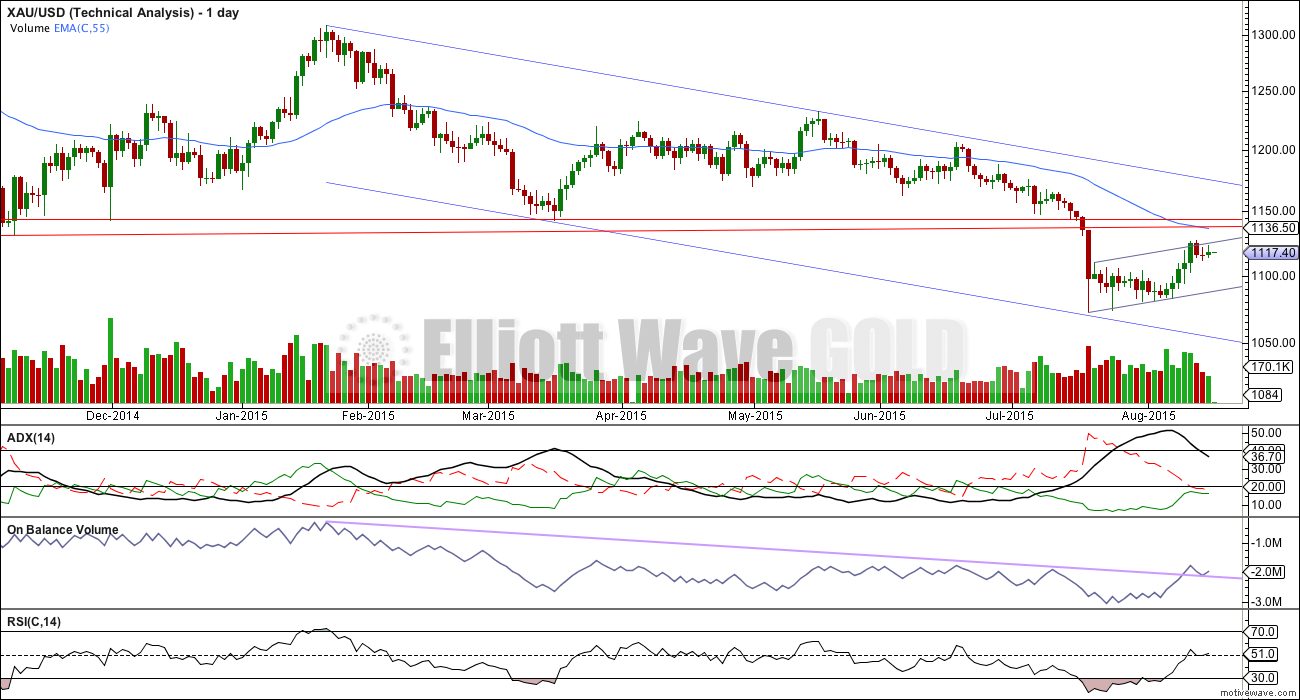
ADX is below 45 and clearly declining. A correction is likely. This is what has been unfolding now for over two weeks; ADX does tend to be a lagging indicator. However, at this stage, what ADX clearly shows today is that this upwards movement is not a new trend.
On Balance Volume has breached its long held lilac trend line, which is now providing support. This expects some upwards movement. If the Elliott wave count is correct, then OBV will have to break below this lilac trend line again. On the way down, the lilac trend line may provide some support initiating a small bounce.
I have added two horizontal trend lines of resistance, which were previously support. The first is at 1,131 from that low on 7th November 2014. The second is at 1,142 from the lows at 1st December 2014 and 17th March 2015. If price breaks above 1,131, then the next line at 1,142 may show where upwards movement ends. 1,142 was tested four times, so it is highly technically significant.
RSI has returned well into normal range. There is plenty of room for the market to rise or fall.
The EMA is changed to a Fibonacci 55 days. This may also provide some resistance.
Overall, within this correction, it is upwards days which have stronger volume, which would indicate an upwards breakout is more likely than downwards. However, this disagrees with ADX, which indicates the market is consolidating and not in a new upwards trend. While these two indicators give opposite messages, the picture is unclear; caution is advised. Declining volume for five days in a row now suggests this movement is nearing an end.
The strongest piece of technical analysis on this chart is the horizontal lines of resistance, particularly 1,142. At this stage, it should be expected that price will respect that trend line.
Note: I am still searching for a reliable new data feed for Gold spot prices. I will use volume data from StockCharts to supplement this data from FXCM. Stockcharts volume data does not show high volume for 5th August (an upwards day), but it does show highest volume during this correction for the two upwards days of 11th and 12th August.
This analysis is published about 07:27 p.m. EST.
GOLD Elliott Wave Technical Analysis – 18th August, 2015
is out now
WEDNESDAY, AUG. 19
8:30 am Consumer price index July 0.2% 0.3%
8:30 am Core CPI July 0.2% 0.2%
2 pm FOMC minutes July 28-29 *******
There are two scenarios. Either minute wave iv is over with a truncated fifth wave. This is less likely because the truncation would be substantial.
Or subminuette iv has moved further sideways and lower as a double zigzag. This would still require a final fifth wave up.
Only a new low below 1,105.18 will confirm minute wave iv as over. That’s the high of subminuette i: movement back into subminuette i price territory can’t be a fourth wave correction, and so the whole structure for minuette (c) must be over at that point.
I will have two hourly charts for you today.
The bigger picture is exactly the same.
Lara, nice update, clear and concise.
Hi Lara…thanks for the update…W 4’s had been notoriously expensive for me and I now try to resist the urge to predict their end. Your work has been especially money saving for my portfolio.
Under your scenario 2 above W4 may have ended.
If W3 started at 1080.20 on Aug 4 and ended at 1126.30 on Aug 13, then 38.2% retrace would come in at 1108.69. My data feed shows today’s dip turned at 1108.80…. which is either a solid touch or a real nasty tease….
(touch = end of W4 and tease = more W4 drama).
So the question is…….from your personal relationship with gold …does gold’s personality include lots of nasty teases or is it a fairly straight shooter with honest respect for Signor Bonacci’s son?
We’re in a small correction within a correction. The market is consolidating, not currently trending.
I see members trying to trade these small intraday movements and I keep providing advice about consolidating markets. They are for experienced professionals only.
I keep also pointing out to members that corrections are harder to analyse, not just trade. The number of structures which may unfold is huge, my accuracy rate for these small corrections will not be as good as an impulse, a trending market.
And I still see members trading small corrections! It’s somewhat frustrating.
So if you’re avoiding them then well done. Sometimes it’s the trades you DON’T take which make the difference between profit and loss.
And now, this comment is not directed at the very experienced professionals we have here who day trade. There are a few people here who really know what they’re doing. And they manage to profit from those small movements.
I can’t do it. I wait for a trend. Which means I sit on the sidelines quite a lot.
US Oil is currently trending. Has been for weeks now.
There’s always another opportunity!
And now to your question:
Yes. Gold has complicated corrections. The trick is figuring out when they’re done and the trend has resumed. It does exhibit very nice alternation and usually decent proportion between corrections of the same degree, so that does make it a bit more predictable.
But there are 23 possible structures for a fourth wave. This is a small fourth wave, within a fourth wave. So that makes analysis pretty difficult. Even for a more predictable market like Gold.
What Gold does do which is why I like to analyse it so much is it has fantastic Fibonacci ratios in price and time for it’s impulses, and it has swift strong fifth waves to end it’s third waves quite reliably. That offers amazing opportunity for trades with the trend. My job is to give advance notice of when it’s going to do that.
I do agree that subminuette iv is not likely over. As far as I recall, gold tends to trade sideways/down previous to Fed news, as the one we have tomorrow; and rise ex post those news. This has happened many times before, so probably tomorrow is the same . Let’s see.
Other indices (HUÍ, GDX) are above their latest support levels, and their next resistance levels are just above, which is slightly bullish (bearish scenarios in gold are sometimes confirmed ahead by miners behavior ). Now, given volume lately, i wouldn’t expect gold to trade upward to $1,142; i think it doesn’t have shown the steam needed to rise that high. Let’s see.
Market timer Tom McClellan sees stocks set up for ‘ugly decline’ as early as Thursday.
McClellan is bullish today, but he expects definitive peak in stocks between Aug. 20 and Aug. 26
http://www.marketwatch.com/story/market-timer-tom-mcclellan-sees-stocks-set-up-for-ugly-decline-as-early-as-thursday-2015-08-17?page=1
Aug 18, 2015 12:08 p.m. ET
He relies heavily on the widely used technical indicator that bears his surname, the McClellan Oscillator (MCO). Developed in 1969 by his parents, Sherman and Marian McClellan, that indicator can be used to determine overbought and oversold conditions and gauge the flow of money into and out of the market, according to the Market Technicians Association’s Knowledge Base.
Thanks for the link Richard!
I’ve been expecting a big decline for the S&P500 for a while now. It’s taking it’s time in a big sideways move.
I would put a lot of weight into a report from Tom McClellan. He is extremely knowledgeable and experienced. He knows what he’s doing.
Gold and COT data. Appears COT provides early warning for direction of gold.
A few weeks back, I stated how can one be bearish on gold when hedge funds were net short for the first time and the hedgers were taking off their hedges. Only time will tell.
Yes I remember reading yr post. I waited for the proof in the pudding. Here it is.
Once the shorts increase and Lara wave target is reached it is no brainer.
Gold just retraced back up $10 to 1120.16 at 10:39 am
Gold drops $10 and US Dollar stronger on 8:30 am US news showing Housing (thus economy) strong.
The most reasonable explanation I can think of for gold’s drop below 1111.89 could be that subminuette 4 has is completing as an ABC 3-wave affair 1126.88 – 1111.89 – 1122.92 – currently in 3rd wave of C.
The other possibility is that Minute 4 was over at 1126.88 and we are enroute towards 986.
More action will be needed to confirm.
Tham, might a look at DUST, after this latest move, give an indicator of golds intent ? DUST may have an idea what his big brother gold will do ?
It still looks like gold is going up in subminuette 5, having completed subminuette 4 at 1109.76. The confirmation will be a high above 1126.88.
DUST has been trying to take off from the low at 23.60, but until it breaks 27.34, I will still stand by what I thought yesterday.
Hi Tham, Under that scenario do we have several weeks of upward movement in Gold ?
Lara in Aug 17th analysis.
“Along the way down to the final target for primary wave 5 at 957, there will be two more big fourth wave corrections: one for minor wave 4 and another for intermediate wave (4). They may be expected to be less time consuming than their counterpart second wave corrections; they may also be expected to be shallow, but they will both still likely be multi week corrections (at least two weeks in the case of minor wave 4 and longer for intermediate wave (4) ).”
Hi Robert. I’m in the same camp as Lara. I don’t think the bull is strong enough to pull up gold price. I would say that this is the final upleg before the big drop arrives. Hence, gold price should reach the top probably by today or tomorrow (FOMC day).
I expect that is highly unlikely. A couple of days maybe, but probably not even one week let alone several.
Lara, could you clarify your comment, I don’t understand it?
“I expect that is highly unlikely. A couple of days maybe, but probably not even one week let alone several.”
My comment was in reply to this from Robert:
“Hi Tham, Under that scenario do we have several weeks of upward movement in Gold ?”
I thought he meant that we may have several weeks of upwards movement in Gold RIGHT NOW.
But maybe I’ve misinterpreted, and he meant for another correction (minor 4) to come.
And so for this current correction I expect it to end in days, not weeks.
Lara, I understand. Thank you.
Tham, appreciate your comments.
Thanks Tham, just trying to plan a vacation! But as usual the market doesn’t seem to care.
Robert thanks for the funny but true vacation and market comment.
TUESDAY, AUG. 18
8:30 am Housing starts July 1.21 mln 1.185 mln 1.20 mln
8:30 am Building permits July 1.12 mln — 1.34 mln
8:34a
10-year Treasury yield up 2.6 basis points on the day at 2.178%
8:34a
Treasury yields rise after housing-starts report
8:33a
Dollar little-changed after July housing-starts report
8:33a
Futures for S&P 500 off 0.2%; Dow futures down 0.3%
8:32a
U.S. stock futures trim losses after housing data
8:30a
Housing starts in July at highest level since before recession
http://www.marketwatch.com/story/housing-starts-in-july-at-highest-level-since-before-recession-2015-08-18
Gold looks like may have just invalidated hourly chart at 9:25 am EST dold just dropped below 1,111.98 invalidation point to 1,111.57 as per http://www.pmbull.com. I believe we now need a new hourly chart and the daily chart is still valid.
Does this mean submin wave v is over at 1126 and gold is in ow in min wave v down to target 1080?
I think there is a good chance we are still in subminuette iv. The market wants to keep us guessing until at least the Fed release tomorrow.
So far, GDX (and DUST) are not confirming. Of course that could change.
Gold hour wave count invalidated. Need a new hour wave count. ?????
From Stocktwits
$GLD monthly chart with andrews pitchfork indicating a bearish squeeze Bearish
Lara, after gold makes a new high above 1126.86, what will confirm that the upwards correction is over? Will breaking below 1111.98 after reaching above 1126.86 confirm that?
Yes, it would.
But first, a clear break with downwards movement may be earliest confirmation.
That confirmation may only come though after a very clear five up.
Price confirmation would be stronger.
Lara, the main scenario in 1126 with a campaign above is canceled?
No. The fourth wave for subminuette iv (orange) has continued, most likely.
The bigger picture remains the same. I still expect one last push up before this thing is done and it’s ready to breakout downwards.