
Upwards movement was expected for Tuesday.
Although price moved sideways to complete a small green doji, downwards movement during the session moved below the invalidation point on the hourly chart.
Summary: To call an end to subminuette wave iv yesterday was probably premature. Subminuette wave iv is now more likely to be over today. A final fifth wave up is still expected to unfold over the next 24 hours, and may take one to three days to complete. The first target is at 1,129; the second target is at 1,141. The market is consolidating; there is no clear trend. When this consolidation is complete, then I expect a downwards trend to resume in force. Price confirmation of a downwards breakout will be a new low below 1,105.18.
To see weekly charts and analysis click here.
Changes to last analysis are bold.
ELLIOTT WAVE COUNT
Click chart to enlarge.
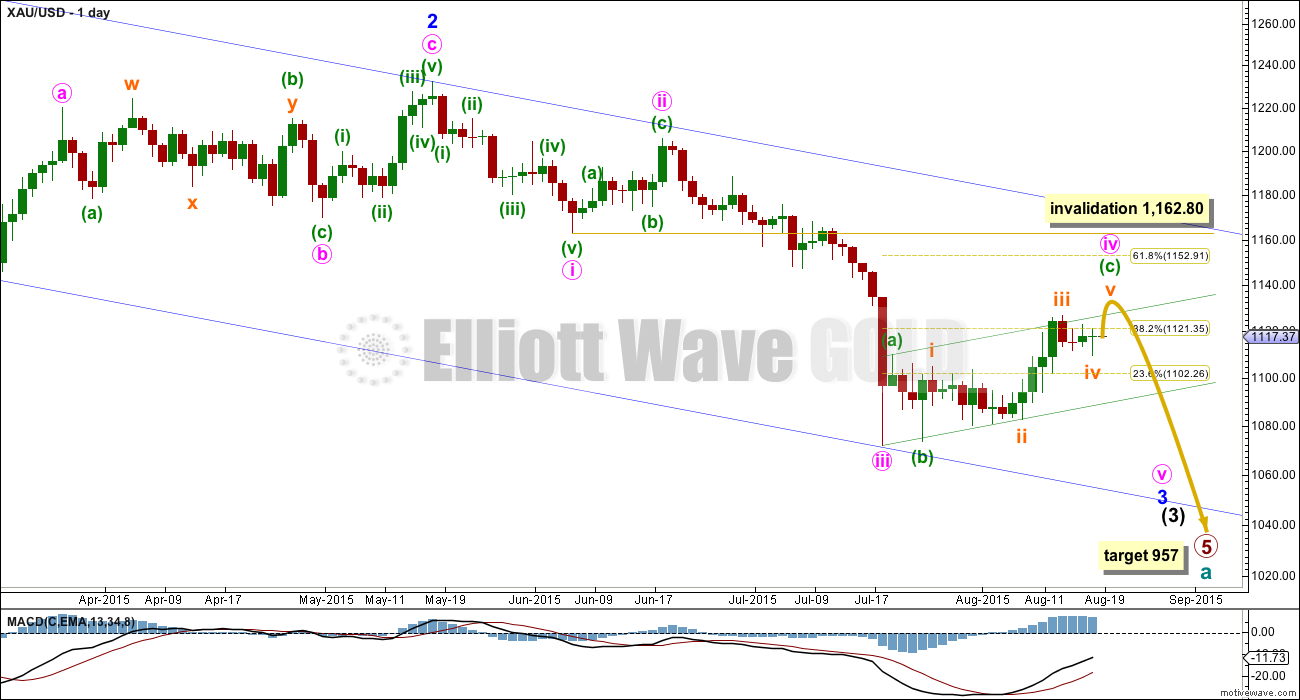
Cycle wave a is an incomplete impulse.
Within primary wave 5, the daily chart focuses on the middle of intermediate wave (3). Within intermediate wave (3), minor wave 3 now shows a slight increase in momentum beyond that seen for the end of minor wave 1 at the left of the chart. Third waves for Gold usually have clearly stronger momentum than its first waves, so I still expect to see a further increase in downwards momentum. The strongest downwards movement is still ahead of us, and now it may be expected to show up within the next fifth wave down of minute wave v to end minor wave 3. Gold often exhibits very strong fifth waves, and when it does this they usually turn up to end its third wave impulses.
It is possible (just, with an unusual looking expanded flat within it for a second wave) to see minute wave iii as over. The duration of this current correction indicates that despite the problem within its subdivisions minute wave iii must have been over and this current correction is minute wave iv.
Minute wave ii was a deep 0.618 single zigzag lasting nine days. Minute wave iv is a more shallow flat correction, which is still incomplete.
Minute wave iv may not move into minute wave i price territory above 1,162.80.
The blue channel is a base channel drawn about minor waves 1 and 2: draw the first trend line from the start of minor wave 1 (off to the left of the chart at the high of 1,308) to the end of minor wave 2, then place a parallel copy on the end of minor wave 1. The lower trend line perfectly shows where minute wave iii found support. Minor wave 3 should have the power to break through support at the lower trend line; when its fifth wave arrives, then it should be strong enough to do that.
There is no Fibonacci ratio between minute waves i and iii, which makes it very likely that minute wave v will exhibit a Fibonacci ratio to either of minute waves i or iii. When minute wave iv is confirmed as complete, then a target for minute wave v down may be calculated. It is likely to be extended and very strong.
Along the way down to the final target for primary wave 5 at 954, there will be two more big fourth wave corrections: one for minor wave 4 and another for intermediate wave (4). They may be expected to be less time consuming than their counterpart second wave corrections; they may also be expected to be shallow, but they will both still likely be multi week corrections (at least two weeks in the case of minor wave 4 and longer for intermediate wave (4) ).
At 957 primary wave 5 would reach equality in length with primary wave 1.
MAIN HOURLY ELLIOTT WAVE COUNT
Click chart to enlarge.
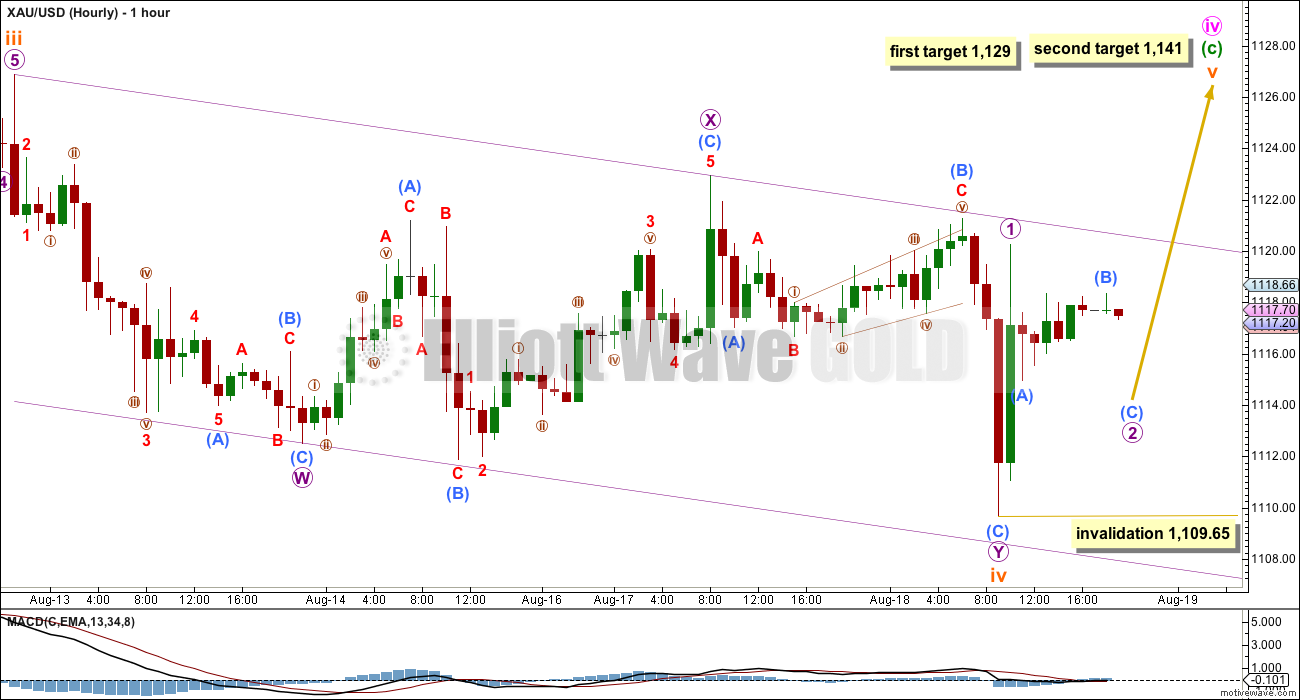
Within the flat correction of minute wave iv, minuette waves (a) and (b) both subdivide as three wave structures, and minuette wave (b) is a 97% correction of minuette wave (a) meeting the minimum requirement of 90% for a B wave within a flat. Minuette wave (c) may only be a five wave structure, and at this stage, it looks like an incomplete impulse.
Subminuette wave ii was a time consuming deep combination. Subminuette wave iv may have continued lower yesterday as a double zigzag, and is now better in proportion to subminuette wave ii on the daily chart, and the structure of minuette wave (c) as a five wave impulse has a better look. If subminuette wave iv were to continue even further, then the invalidation point for that idea remains lower at 1,105.18. It may not move into subminuette wave i price territory.
The double zigzag has a slope against the prior trend, and looks reasonable at the hourly chart level.
At 1,129 subminuette wave v would reach 0.618 the length of submineutte wave i. If upwards movement keeps rising through the first target, or when price gets there the structure is incomplete, then the next target should be used. At 1,141 subminuette wave v would reach equality in length with subminuette wave i.
Within subminuette wave v, micro wave 2 may not move beyond the start of micro wave 1 below 1,109.65.
The channel about subminuette wave iv is a best fit. When price breaks above the upper trend line, then a third wave may show an increase in upwards momentum.
ALTERNATE HOURLY ELLIOTT WAVE COUNT
Click chart to enlarge.
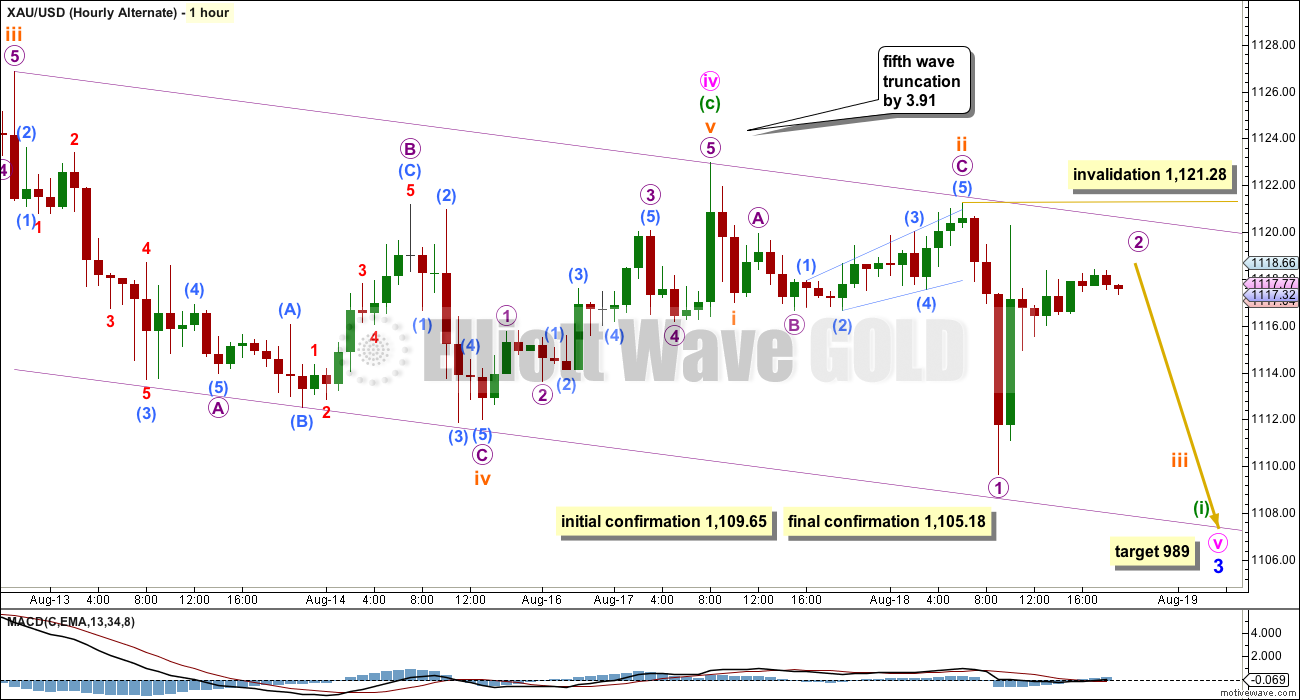
I want to consider all possibilities. What if minute wave iv is over?
If it is over, then the final fifth wave within it would have to be truncated by 3.91. This truncation is substantial, and so substantially reduces the probability of this alternate wave count, maybe to as low as 10%.
A new low below 1,109.65 would be initial indication that this wave count may be correct, but before I have reasonable confidence it would require final confirmation below 1,105.18. A new low below 1,105.18 could not be a continuation of subminuette wave iv, so at that stage minuette wave (c) would have to be over.
Within the new downwards trend, micro wave 2 may not move beyond the start of micro wave 1 above 1,121.28. Invalidation of this alternate would provide further confidence in the main wave count.
At 989 minute wave v would reach equality in length with minute wave iii. This target expects an extended fifth wave, which should show a strong increase in downwards momentum either within its third wave or possibly its fifth wave. When the strongest part turns up, then it may be explosive.
TECHNICAL ANALYSIS
Click chart to enlarge.
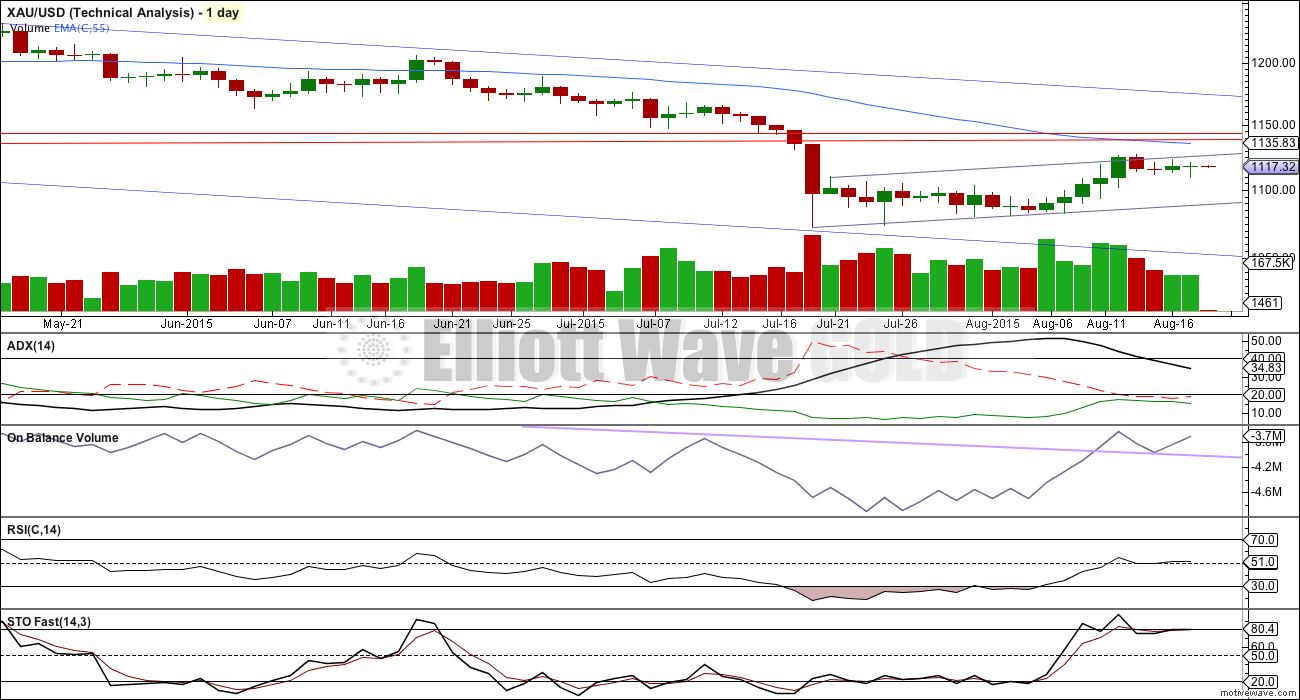
ADX is below 45 and clearly declining. A correction is likely. This is what has been unfolding now for over two weeks; ADX does tend to be a lagging indicator. However, at this stage, what ADX clearly shows today is that this upwards movement is not a new trend.
On Balance Volume has breached its long held lilac trend line, which is now providing support. This expects some upwards movement. If the Elliott wave count is correct, then OBV will have to break below this lilac trend line again. On the way down, the lilac trend line may provide some support initiating a small bounce.
I have added two horizontal trend lines of resistance, which were previously support. The first is at 1,131 from that low on 7th November 2014. The second is at 1,142 from the lows at 1st December 2014 and 17th March 2015. If price breaks above 1,131, then the next line at 1,142 may show where upwards movement ends. 1,142 was tested four times, so it is highly technically significant.
RSI has returned well into normal range. There is plenty of room for the market to rise or fall.
The EMA is changed to a Fibonacci 55 days. This may also provide some resistance.
Overall, within this correction, it is upwards days which have stronger volume, which would indicate an upwards breakout is more likely than downwards. However, this disagrees with ADX, which indicates the market is consolidating and not in a new upwards trend. While these two indicators give opposite messages, the picture is unclear; caution is advised.
The strongest piece of technical analysis on this chart is the horizontal lines of resistance, particularly 1,142. At this stage, it should be expected that price will respect that trend line.
Volume data from StockCharts.com is slightly different, and as it is more reliable than FXCM volume data this comment refers to StockCharts data. Volume for Tuesday was slightly higher, but still below the high volume of five and six days ago. Overall volume is still declining as this correction continues, which supports the idea that it is not necessarily a new trend but more likely a consolidation.
Stochastics has reached overbought, and is trying to return to normal. A downwards swing from here or very soon would be expected from Stochastics.
This analysis is published about 08:04 p.m. EST.
Spot gold on a daily chart had support at 1149-1150, before it broke lower. Looks like it wants to test 1149-1150 again, which was support now is resistance. Let’s see how it reacts when it comes into 1141. Good luck with your trades.
Today
I bought DUST at 22.86 and sold it at 23.145 seven minutes later
Bought DUST again at 22.77 sold it at 23.624 thirty eight minutes later
Bought DUST again at 22.93 and kept it.
My average price for DUST today is $21.78
I had no investments now I only have DUST. A conservative number of shares.
Looking to buy more if DUST drops.
May day trade DUST daily.
Very excited about Tham’s comment about potential $60 DUST.
Lots of trading cycles along the way.
I personally don’t trade based on how excited I am about one person’s opinion .
day-trading a leveraged 3X ETF like DUST for 1%-4% gains? hmm
Lara has gold already topped or is 1,141 target still in effect today or within 2 more days?
How do you know? Those patterns are still developing. Trade the trend until it ends.
I really don’t like the daily or hourly count . I don’t know what this is but it doesn’t look finished yet for awhile .
I’m with you that it doesn’t look finished. Meaning it does look like the start of 5 up and we have to be careful cause it could get extended
It looks incomplete. And there is zero confirmation it’s over.
The second target looks more likely.
UUP down GLD up. UUP daily is breaking down…1st support is 200ma and 2nd support is triple bottom. GLD should go higher with a sell off in the US Dollar. Trade the trend.
Hi Lara – who is not on vacation,
where are we on the wave count? 🙂
… smiley face supposed to be after “vacation”
within subminuette v, *edit: probably micro 3 still
Lara: what is the situation of wave counts???
Should wait one more day for FOMC news to go around the world market????
Dollar breaks below 124 yen after Fed minutes are released early
Aug 19, 2015 1:59 p.m. ET
http://www.marketwatch.com/story/dollar-breaks-below-124-yen-after-fed-minutes-are-released-early-2015-08-19
FOMC 2:00 pm
Fast news site
http://www.marketwatch.com/newsviewer
It was leaked 15 minutes ago!
Gold has started to move higher.. Looks like FOMC info is out to traders.
not yet
Is anyone buying DUST before the 2:00 pm FOMC or then or after?
And is Gold still expected to top at 1141?
1140s may not come until Asian or European trading hours. Alternatively, might roll into tomorrow as well. I haven’t yet seen an end to micro 3.
I can see a possible end to micro 3 (with submicro 5 of micro 3 being a smallish ending diagonal), but I have not gone down to small time resolutions to check all the fine details.
Hi Richard.
Looking at a 21.xx purchase point for small first DUST position after some kind of reversal….not dependent on time.
Gold has run up $60.00. It’s hard to believe it would come this far and not test 1142 resistance.
From a conservative standpoint, particularly with such leveraged ETFs as DUST, I prefer to confirm a top first before entering a trade. How I confirm a top? At least I want to see a 5-wave downtrend (which in this case, could happen anywhere from 1,130 to 1,142 in theory). Such 5-wave downtrend could qualify as wave 1 of the next trend. Then, when wave 2 come as a 3-wave pattern…..ONLY THEN you have a better set up: (i) first you suspect that a top is in, (ii) second you see a 5-wave donwtrend, which implies a reversal and a ‘new trend’ down, (iii) and then you wait to enter your trade when you see a 3-wave up (which assures you that is a corrective pattern). Therefore, what i do is increase the odds of a good set up in such ETFs by seeing a 5-wave downtrend followed by a 3-wave corrective uptrend.
Attempting to upfront the market by trading a leveraged ETFs without such confirmation, would many times prove you wrong. Sometimes you will win for sure, but other times you will suffer. It depends on each one trading style and risk aversion I guess.
I think there is more to it than what you say here because 5-3 could be the start of a zigzag (5-3-5) corrective pattern.
I think that’s a pretty wise approach.
It’s the Elliott wave equivalent I guess of waiting for a trend line breach, then entering on a throwback.
This is my approach: wait for a larger second or fourth wave (minor or higher) correction to be complete, then wait for a breach of the channel containing it. Look for a five in the new direction on the hourly chart for additional confirmation. Then wait for a throwback to the trend line. Enter there. The stop is usually not too far away at that point so the risk isn’t too bad usually. And then I move my stop within 24 – 48 hours to slightly beyond my entry point reduce risk to zero and wait to see if the trade “sticks”. If it doesn’t then I get a tiny profit.
I had a nice NZDUSD trade I closed yesterday, over 800 pips profit. It took six tries: one loss and four tiny profits, before the last trade “stuck”.
Congrats!
Gold Firmer on More Modest Safe-Haven Demand
By Jim Wyckoff – Wednesday August 19, 2015 10:47
http://www.kitco.com/news/2015-08-19/Gold-Firmer-on-More-Modest-Safe-Haven-Demand.html
Lara said it was 50% chance for either 1129 or 1142 and had a slight preference for 1141.
I sure hope gold reaches 1141 today as I haven’t bought DUST yet today and It has already moved up $2 then now at 23.89 at 10:43 and low was 22.40 at 9:48 am
Dollar edges lower after July CPI report (released at 8:30 am Wed.)
Aug 19, 2015 10:10 a.m. ET
http://www.marketwatch.com/story/dollar-slips-ahead-of-fed-minutes-inflation-data-2015-08-19
US stocks have also dropped today.
1129 reached.. and its retraced back to 1125 levels now. Shorted at 1129. wondering if this can break 1129 to go till 1142?
Is the wave count complete at 1129.46 at 9:48 or incomplete and heading for 1142?
Gold now at 1126.90 at 10:00
Gold just hit first target of 1129 as at 1129.46 at 9:48 am
That was micro 3 of subminuette 5. Micro 4 and 5 to come. Unless Micro 5 is extended, my target is in the region of 1131 – 1135 depending on where micro 4 ends up.
DUST has still not bottomed yet. My current target is still 21.92 (compromise of 22.02 if gold’s Micro 5 fizzles out fast). It still points to gold being one down and one up. Ditto NUGT.
Micro 3 may or may not be complete.
Whether micro 3 goes higher or not, the invalidation point for micro 4 can now be set at 1119.89 (top of micro 1). In other words, gold’s next correction (micro 4), which may already be in progress, must stay in the 1120s.
Exactly. And so that can now be the price confirmation point of a breakout, or at least, an early confirmation point.
I think your target in the low 1130s is appropriate for the end of micro 3. That would make it 1.618 the length of micro 1.
Hi Alan Tham,
did micro 4 end at 1126,8 and are we in the final move up now to end micro 5 of c of iv?
Matt may be correct there. But both my count and his would yield the last high around 1140 so it doesn’t really matter what transpires in between.
The important thing is that I am watching 21.92 for DUST as that will be my entry point. It is on the the way. DUST is currently in the 4th subwave of a larger C wave. Once it turns down in the 5th wave, it should hit 21.92 or less. And that would correspond to gold’s final rise.
thank you!
Thanks a lot Tham.
Could someone please confirm, or point out the error I may be making —
It looks to me like subminuette v may have ended already, since it looks like a complete 5 up. Micro wave 1 ended at 1119.89, 2 at 1115.03, 3 at 1124.23, 4 at 1120.88 and 5 at 1124.35.
Micro wave 3 was shorter than micro wave 1, which was the first clue that 5 had to be shorter than 3. That told me that Lara’s higher target already needed to be ruled out.
Alternatively, this could be the first structure within a larger 5 up.
Hope I am wrong, since I was looking for a higher entry price.
Thanks
The numbers above may be slightly different than yours, so any reply should focus on wave structures and general lengths.
A new high would kill this idea. Could even happen momentarily!
Never mind! Price moved higher. Current movement is likely still part of micro wave 3.
Guess I am just over anxious. 🙂
Per my post below, we may need another wave 4 and 5 to complete the up move.
Yes, that’s right. Micro 4 is already underway.
Lara:”The channel about subminuette wave iv is a best fit. When price breaks above the upper trend line, then a third wave may show an increase in upwards momentum.”
Gold has broken above the channel. Today gold may see upward momentum.
Just an idea. We may have a 1-2, 1-2, at micro and submicro level for subminuette v in the works. So the current correction around the 1,122 level may be submicro 4, with another move up to come, then a micro 4 correction, then the final move up to complete subminuette 5, Minuette c, and minute IV.
After we make a new high, a drop below the top of micro 1 would suggest that the move up is complete.
We think alike. We are now nearing completion of submicro 5 of micro 3.
What is micro one price point?
1,120.27
The alternative wave count has been invalidated at 3:16 am with gold moving above 1121.28 up to 1,124.29. (Tham already mentioned this.)
Gbones looking for 1,134, then down.
Dreamer it looks like he called it right so far as gold high was 1134.78 at 4:04 pm EST.
Amazing!
I am indeed happy to see that the alternate has been invalidated with a surge past 1121.28, cutting through it without any effort at all much like a hot knife cuts through butter.
Micro 2 of Subminuette 5 was a very quick drop to 1194.95, and now we are comfortably in Micro 3. It does look like gold has good intuition to move quickly towards completion of Minute 4 by 2 pm Wednesday, in time for FOMC minutes to trigger the free fall off the cliff.
I just realized that Micro iv (w-x-y) is 38.2% fib retrace of Micro iii, which complies with alternation of Micro ii that was a huge retrace from Micro i. Micro v is coming for sure.
Yes, perfect alternation and now good proportion. Minuette wave (c) looks typical now.
Lara everything about your written, charts and video analysis is World class quality.
Thanks Richard! Here’s hoping I’ve got the direction of this next breakout right.
If I’m right then when the trend returns we should all be making nice profits.
I can tell you exactly when the trend returns! The day I leave on vacation. Would you like me to leave tomorrow? My wife already left and is waiting for me. sorry, I digress.
Ah, Murphy’s Law at work, aka born loser.
Happens to me often too!
Robert and Tham you guys have funny vacation comments, thanks.
Yes Robert leave Wednesday just after 2 pm as Gold pops up to 1,141.
Then we will wave you farewell as we buy into DUST and JDST as gold drops and you leave on your vacation as cash registers go wild ringing up our mega profits.
Richard. You don’t have to wait that long. Already, gold price has risen and invalidated the alternate.
What is this word “vacation” you speak of?
I am unfamiliar with the concept…
🙂
“Vacation” is an American term synonymous with the British term “holiday”. It connotes a protracted period, usually at least a couple of days, in which we get away from our normal routine and head for somewhere to relax and recharge our energies, before heading back to the drudgery of work.
Lara, the Einsteins of the world have few capable of replacing them.
Lara,
It’s very generous of you to share the minimal vacation time that you took during your last summer with all of us. After we all become “rich” during the final decline of cycle wave a and maybe with the help of primary wave a up, maybe a big “b” wave like primary wave b would be a great time for you to enjoy a couple of weeks (or more) for yourself with an analysis blackout. You deserve it!
That exactly happen to me. On June 16 I closed my short on US Oil and went for vacation. By the time I came back I missed the big drop in oil and ever since trying for an entry again. Huge lost opportunity ????