
Upwards movement was expected. The first target was reached.
Today’s Elliott wave analysis will focus on: identifying if this structure is complete, and looking at what price point would provide first confirmation.
Summary: Upwards movement is most likely incomplete. The second target at 1,141 should now be met within 24 hours. A new low below 1,120.27 now would provide earliest confirmation that minute wave iv is finally over. A downwards breakout would be finally confirmed with a red daily candlestick on higher volume.
To see weekly charts and analysis click here.
Changes to last analysis are bold.
ELLIOTT WAVE COUNT
Click chart to enlarge.
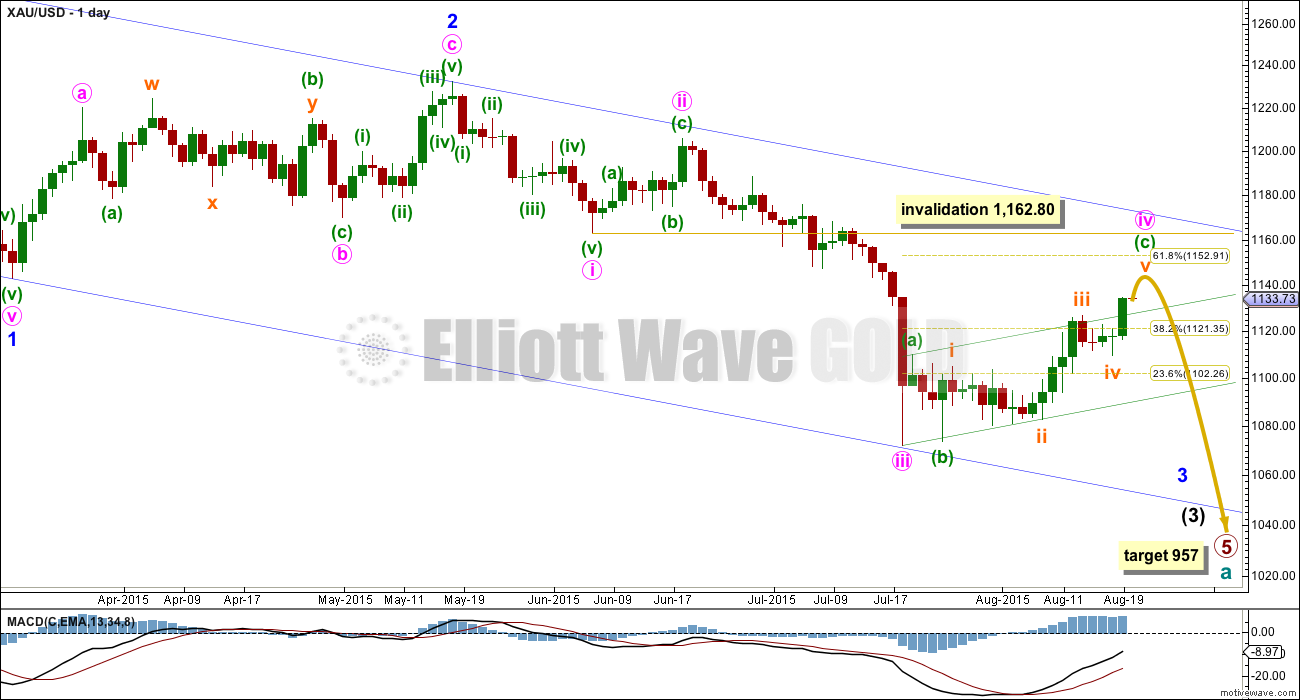
Cycle wave a is an incomplete impulse.
Within primary wave 5, the daily chart focuses on the middle of intermediate wave (3). Within intermediate wave (3), minor wave 3 now shows a slight increase in momentum beyond that seen for the end of minor wave 1 at the left of the chart. Third waves for Gold usually have clearly stronger momentum than its first waves, so I still expect to see a further increase in downwards momentum. The strongest downwards movement is still ahead of us, and now it may be expected to show up within the next fifth wave down of minute wave v to end minor wave 3. Gold often exhibits very strong fifth waves, and when it does this they usually turn up to end its third wave impulses.
It is possible (just, with an unusual looking expanded flat within it for a second wave) to see minute wave iii as over. The duration of this current correction indicates that despite the problem within its subdivisions minute wave iii must have been over and this current correction is minute wave iv.
Minute wave ii was a deep 0.618 single zigzag lasting nine days. Minute wave iv is a more shallow flat correction, which is still incomplete.
Minute wave iv may not move into minute wave i price territory above 1,162.80.
The blue channel is a base channel drawn about minor waves 1 and 2: draw the first trend line from the start of minor wave 1 (off to the left of the chart at the high of 1,308) to the end of minor wave 2, then place a parallel copy on the end of minor wave 1. The lower trend line perfectly shows where minute wave iii found support. Minor wave 3 should have the power to break through support at the lower trend line; when its fifth wave arrives, then it should be strong enough to do that.
There is no Fibonacci ratio between minute waves i and iii, which makes it very likely that minute wave v will exhibit a Fibonacci ratio to either of minute waves i or iii. When minute wave iv is confirmed as complete, then a target for minute wave v down may be calculated. It is likely to be extended and very strong.
Along the way down to the final target for primary wave 5 at 954, there will be two more big fourth wave corrections: one for minor wave 4 and another for intermediate wave (4). They may be expected to be less time consuming than their counterpart second wave corrections; they may also be expected to be shallow, but they will both still likely be multi week corrections (at least two weeks in the case of minor wave 4 and longer for intermediate wave (4) ).
At 957 primary wave 5 would reach equality in length with primary wave 1.
Click chart to enlarge.
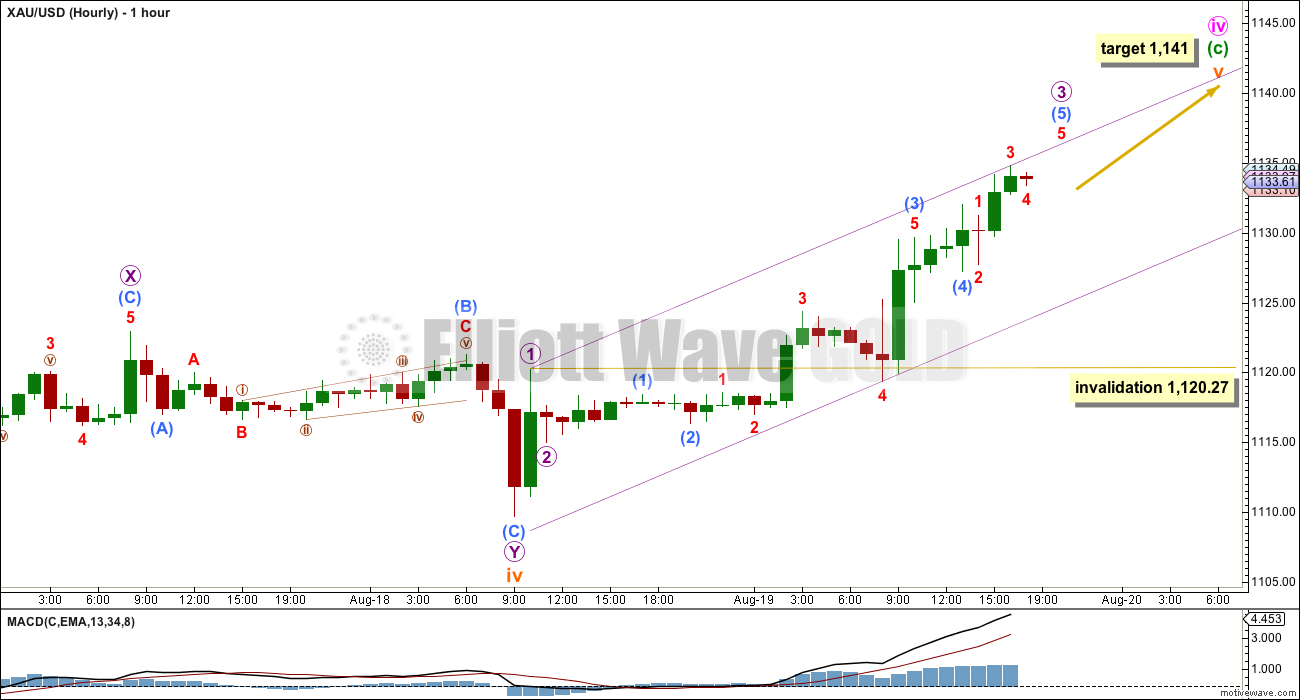
Upwards movement invalidated the unlikely alternate hourly wave count; this main wave count was confirmed. The first target has been met, but the structure is incomplete so now the second target will be used.
At 1,141 subminuette wave v would reach equality in length with subminuette wave i.
Subminuette wave v must subdivide as either an impulse or an ending diagonal. At this stage, we can tell subminuette wave v is subdividing as a simple impulse, and within it the third wave may not be complete.
When micro wave 4 arrives, then it may not move into micro wave 1 price territory. This is the lowest point for micro wave 1 to possibly be over. Micro wave 4 may not move below 1,120.27.
Draw a channel about subminuette wave v: draw the first trend line from the end of micro wave 1 to the last high, and as micro wave 3 ends redraw the first trend line to its end, then place a parallel copy on the low of minuscule wave 4 in order for the channel to contain all this movement. While subminuette wave v is still unfolding the lower edge of the channel should provide support. When that lower trend line is fully breached by downwards (not sideways) movement, then that may be earliest indication that subminuette wave v may be over.
A new low below 1,120.27 could not be a fourth wave correction within subminuette wave v, so at that stage subminuette wave v would have to be over. A new low below 1,120.27 would therefore provide earliest price confirmation that minute wave iv in its entirety should finally be over.
Depending upon your risk appetite, you may want to wait for traditional technical confirmation with a red daily candlestick on increased volume before you have confidence in a downwards breakout.
The next wave down for minute wave v is expected to be very strong, extended, and maybe quick. This is typical of Gold and commodities for fifth waves, particularly a fifth wave within a third wave impulse.
TECHNICAL ANALYSIS
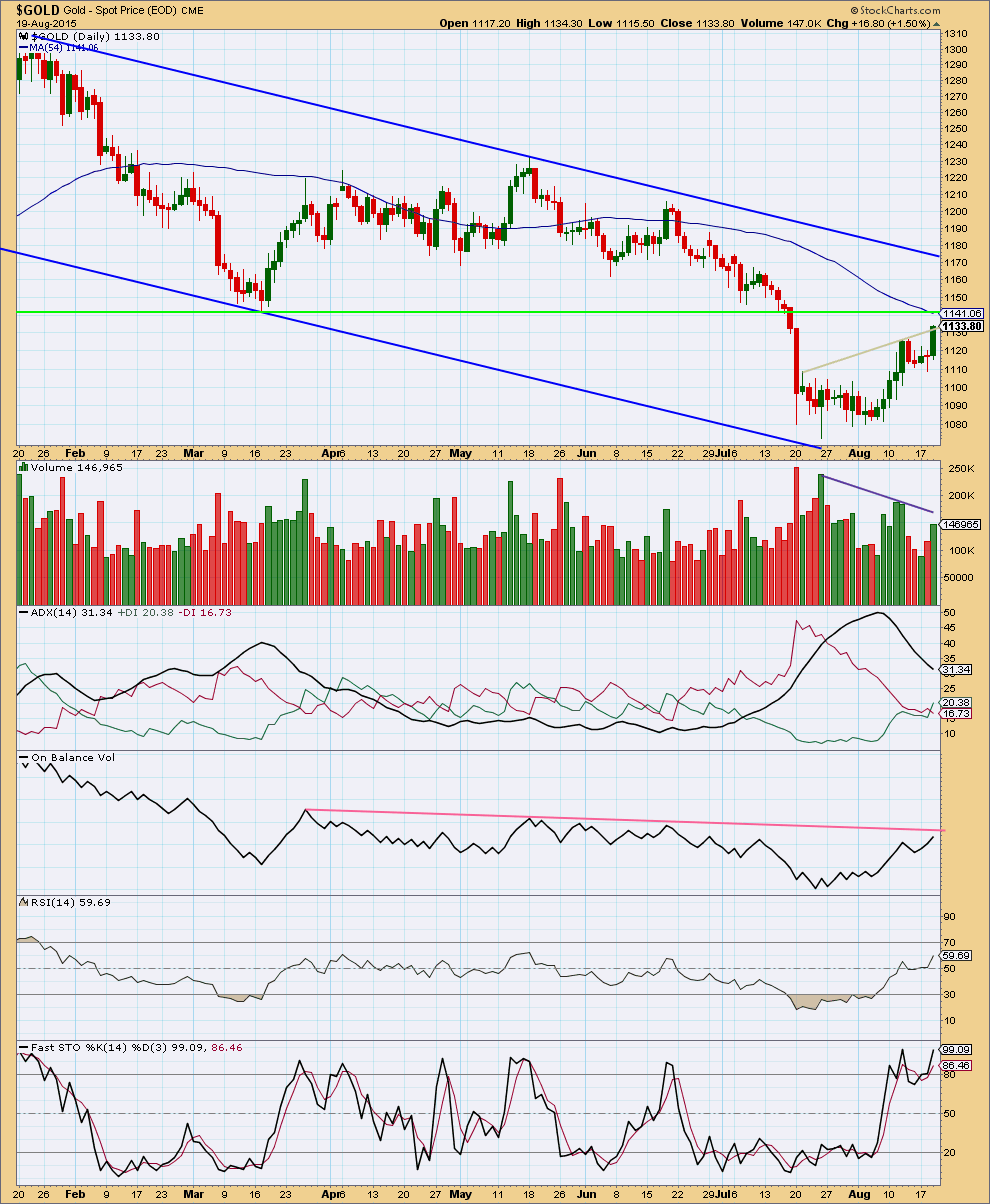
Click chart to enlarge. Chart courtesy of StockCharts.com.
Overall, during this upwards price movement, volume is declining. Although volume showed some increase today, it is still lower than prior days during this correction. Overall the rise in price is not supported by volume. This supports the Elliott wave count, which sees this movement as a correction.
However, during this correction, it is still clearly upwards days which have strongest volume. This would indicate that an upwards breakout is more likely than downwards, which does not support the Elliott wave count.
ADX remains very clear: the market is consolidating not trending. ADX supports the Elliott wave count in expecting this upwards movement is a correction and not a new trend.
Upwards movement may end when price touches the bright green horizontal trend line at 1,142, which should provide resistance. That horizontal line has been tested three times for support, and should now provide strong resistance.
On Balance Volume may assist to show when and where this upwards movement ends. When OBV comes up to touch the trend line drawn there, then upwards movement may end.
RSI is back into normal range. There is plenty of room for the market to either fall or rise.
Fast Stochastics is again comfortably overbought. This indicates an end to upwards movement either now or very soon, which also supports the Elliott wave count.
This analysis is published about 07:57 p.m. EST.
Only a pullback expected from “the financial tap”:
“If you followed recent posts, you would know I’ve been bullish on gold as it has turned higher within a new Investor Cycle. Being long here has been great and that three day pause last week, to form a bull flag, has resulted in a quick $47 move. So many people were expecting gold to break-down from that flag, which is partly why the rush to cover and/or buy-in was so aggressive.
Some caution is needed now, I noticed a lot of the typical retail crowd on social media getting in at these levels and I noticed options premiums explode. Gold has become fairly overbought in the short-term and we’re also due a Daily Cycle Low soon enough. Looking at the chart below, this three day move measures the same distance than the corresponding move of the bull flag pole, suggesting that we may have hit an upper limit…for the time being.
For the Investor Cycle holders (longer-term), don’t let the threat of a looming Daily Cycle Low scare you, hold your positions tight, this looks like an Investor Cycle that has potential to surprise many in the coming weeks. The Dollar was down today too (as I expected), and gold acted as a hedge or risk-off asset this time, for a change. That divergence was positive news and it is great to see gold and the miners performing so well on such a negative day for stocks.”
The severe move beyond the upper Bollinger band is something that I noted earlier. When this happens, there is usually more than an imminent snapback in price. More often than not, something like this marks the end of movement in a particular direction.
The healthy move above the 50 day moving average is another sign that gold may be topping out.
Matt, great call last week noting that you thought Gold would take this C wave into 8/20. I started adding dust throughout the 19’s today….what a move the miners have made these past 2 weeks.
Thanks. Timewise it seemed about right.
However, if gold does not turn around right here and now, I am completely lost. I saw mid-1150s as the most extreme possibility, but that’s it.
I keep going over the charts to look for the piece of the puzzle that I may be missing, but just can’t find an alternate wave count.
Gold might not move beyond 1166 before making a pullback.
and the pullback levels 1131 1118 and 1112
I’ve just finished the video, it’s long today.
I’ve spent a lot of time today going over alternate ideas too (that’s what took me so long today).
I hope that my explanation on the weekly chart today will provide some clarity as to what alternates are possible at this stage.
My conclusion has to be that Gold remains in a primary degree trend down.
Look at our exchange under Aug 13th analysis. You got me thinking about gold’s movement in Oct/Nov and my response was that gold could get into the 1150s. Now that’s a call! 🙂
I still think gold holds here and makes a healthy new low. Guess I’ll go down in a hail of bullets if I am wrong. Ha-ha
Yes! we will see what happens soon. If global markets continue to become unwound, gold may end up falling with it.
Dreamer, thanks for the great chart. Very insightful.
Looking at the lows and highs the last few months in a great visual presentation adds clarity as a picture is worth a thousand words.
Patrick, your comment has been removed because it’s very sarcastic.
It contributes nothing to the conversation and provides no technical analysis.
Please read the comments guidelines.
And let’s be fair, I did predict today would move price higher. My target was inadequate, but I did get the direction right.
Sorry Lara,
it wasn’t a reflection of your work, just made me chuckle all the talk of tops and cliffs as we made new high after new high,
comment noted
thanks
Fair enough.
And I have noticed the link to the comments guidelines is AWOL. That happened when we updated the website platform. It will be restored today.
IMHO: Depends on how this closes, downside risk for now appears to have been minimized / muted to $1118-$1108 subject to a break below 50dma ($1138-36)/$1130…. Lucky to see Gold price below $1144… At this stage Gold price appears to be headed for a take out of $1160-$1165.40-$1167.20, basically somewhere in region of 38.2% retracement of H $1308 / L $1076 with likely to follow 50% retracement at $1192 subject to break above 200dma…. Stochastic %K is above %D on 9day through to 100 day (bullish)….
Syed your comment sure sounds bullish gold.
So $1160-$1165.40-$1167.20 then a possible 1192,
subject to break above 200dma.
Lara, Seems like it would be a very bullish signal if the wave count gets invalidated at the daily level of 1,162.80, especially since it appears that gold is already higher than the start of Minor wave 1 at 1,142.82?
Can you give us an alternate bull wave count?
I’m working on it.
My view using price action: All day gold volatility has been up as well as silver volatility. Of note, GDX volatility has turned negative today. Viewing the miners on my watchlist, I notice that 2 are negative: FCX has been down quite often lately (due, I believe, to share dilution), and RBY (a junior miner worth less than a dollar). I have also noticed that SLW and ABX have pulled off their highs–imo a near-term bearish sign.
Ultimately, I’m bullish the miners and wish to enter on a pullback, but I do have the feeling that DUST is a good buy very soon…
If the S&P chooses to rally right here (I predict it’s near a short-term bottom), perhaps gold has a significant selloff…just thinking out loud.
Of course, if gold rallies above 1160s, my thoughts are out the window. Good luck to everyone.
Thoughts?
A new gold high of the day of 1,154.13 at 2:50 pm and DUST back down to 19.35.
GDX continuing it’s uptrend again since 15.77 at 2:13 pm when DUST was at 20.12
I am out of DUST and awaiting clarity.
Lesson learned I guess.
Yes I waited for DUST to pop back up from 18.97 low up to 19.58 and sold at 2:01 pm. I only had a very small quantity of DUST luckily at 21.78
I made a note of Lara’s excellent strategy to reduce risk when trading corrections. I printed it and put it on my wall beside my trading desk.
Today gold was clearly bullish so I could of did some quick intra day trades in GDX or GLD instead and sold before the close.
Lara
“This is my approach: wait for a larger second or fourth wave (minor or higher) correction to be complete, then wait for a breach of the channel containing it. Look for a five in the new direction on the hourly chart for additional confirmation. Then wait for a throwback to the trend line. Enter there. The stop is usually not too far away at that point so the risk isn’t too bad usually. And then I move my stop within 24 – 48 hours to slightly beyond my entry point reduce risk to zero and wait to see if the trade “sticks”. If it doesn’t then I get a tiny profit.”
That strategy I use is to trade an impulse, not a correction.
I wait it out while the correction unfolds, all of it. That takes weeks.
I do a lot of waiting, because I won’t trade corrections.
I closed my NZDUSD position a couple of days ago and opened one on US Oil. Personally, I’d like to trade the next wave down for Gold but I will not enter until I have good confirmation. So there, I’m waiting.
Hi Lara,
I’m afraid that we may have seen a first five wave up for the start of wave B?
Nick
I think that what is currently 3 will now be C which = A,
Now in 1 up of B (a,b,c)
a = ~1250
If you’re meaning cycle wave b then you have to see primary 5 as complete.
I’m looking into that for an alternate, but so far no matter what variation I try I have not been able to see a solution which meets all Elliott wave rules.
It will be interesting to see what is COMMERCIAL’s short position is in tomorrow’s COT report.
Any guesses?????
My guess…less long than 2 weeks ago by 50,000 contracts and then by 2 weeks from now they will be 50,000 contracts more long than today.
That means net shorts will be higher.
Next week they’ll be even more short.
Alan
GDX and NUGT has a break away gap up. Appears very bullish. There could be another break away gap tomorrow..
That is in stocks in the bull trend.
However here for PM sector gold is in bear trend and wave iv is expected to be completed some where in this price range.
So we will see what unfolds this evening with Lara’s take and tomorrow’s opening.
Papudi, that is correct. I had posted the gap values for DUST in one of the posts below.
Papudi,
I posted a while back (Nov-December 2014??)about some Vedic astro combos and after that you also posted a link to a video of a guy who echoed the very same. I gave some further insight beyond that at the time. With the change over to this new layout I cannot find my previous posts about this despite putting keywords into the search function…but if you can find please let me know. I had noted July end as an inflection point. If you recall you also asked about Rahu??
DJUSPM <– never heard of before today
Chart from Unicorn on Stocktwits
note MA is 30, not 50
The writing is on the wall guys . Price keeps surpassing all of the ew targets .
We are only 10 points away from invalidation and momentum is there . Really this so called 4th wave should never gone this far ; i was looking for more of a sideways affair . I knew way back at 1115 that something doesn’t look right but break above 1120 – 1130 region confirms for me .
and Dust weekly says its going back to the bottom
I do think that the invalidation level will eventually be breached, but that won’t necessarily happen with this upwards movement.
To be fair, I believe Lara mentioned that that once gold reached 1141, it could get close to 1160.
close enough for me.
I capitulated on Dust back at 22.05– of course the lowest point before an uptick to 27 level.
I so did not want to be in the Minute correction. A while back it was only subminuette, then Lara changed it up 2 levels. Lara’s been consistent with having to move up/down.
I understand it is difficult doing EW and wanted to suggest to her to consider moving up/down right before she did it. But 2 levels — grrr — I was stuck in Minute!
It appears that was a wise move. “I capitulated on Dust back at 22.05”
I did it lower down.
Tham DUST has dropped below your buy at 19.20 down to 19.01.
Is there another lower buy target or has gold count completed at 1154.07 at 12:37 pm?
Great day to be bullish gold NUGT up 16.89%
DUST down 16.26%
Richard, my data feed showed that the lowest DUST got to was 18.97.
As I see it, gold price is very near or at the top already.
The current wave count is a fifth of a fifth of a fifth.
Hence DUST should not drop much more. The next target is too far away, 17.04 support. Moreover, GDX has already hit 16.00, which many analysts said is the top.
The only fear I have is outlined in my earlier post today, that the momentum may surge past the long held bear trend line, turning the market bullish.
agree
note pink trend line and nothing else
We are there now
Nice. I’ll add that to my chart.
Today, DUST gapped down from the open: 22.30 – 21.06. So, once reversal happens, theoretically it ought to fill that gap.
Gold price just reached 1154.07 again at 1:30 am. That was probably the fifth of a fifth of a fifth mentioned in my earlier reply. It could move a bit higher but that ought to be it. Can’t wait for the fall off the cliff.
Gold is in the final 5 of 5.
Matt, yes, question is where does final 5 end?
Since we haven’t seen any ratios yet – at least none that I can identify – my best estimate is 1155.
thanks
thank u Matt
Agree…
I see the same last 5 up as you. However, I chose to use a ratio within that to identify a possible end.
1 and 3 have no ratios, so I thought that 5 could be 1.618 of 1. Alternatively, 5 could also be 0.618 of 3.
2o min
with submic. ratios
Same page as you. Let´s see. Probably will confirm tomorrow though.
GDX count
gdx 15min from orange B and on…
John, always appreciate your charts. How can GDX go that high without gold invalidating the count?
need to find a home for 3,4 3,4 3,4,5 counts… I’m just plugging in as the price comes in. Will need to adjust ..agree
I base off gold in priority
Ha its just been announced this afternoon the Greek Prime Minister will resign tonight making way for a snap elections…..that could push gold up a touch more…not much,..a small kick up….
Lara,
Given Gold´s price at nearly $1,150, probably Micro 3 was at $1,142 which is ~ 2.382 times Micro 1 (so Micro 3 was extended), and hence we could assume that Micro 5 will not be extended and therefore will show the same length as Micro 1, which means Micro 5 could end by $1,149-$1,151.
Looking at other indices: (i) HUI has strong resistance at 140 (currently at 130x), (ii) GDX has strong resistance at ~ 16 (currently at 15.90x), and in both cases increases in prices in recent days have ocurred on DECREASING volume.
Local top in gold is in or is very near.
I disagree . RSI is making a new high ( highest since March ) and will be trying for over 70 for sure soon . Means price is going higher and will make over 1162 invalidation soon .
So you bet only because RSI is making a new high? Oh well. Good luck.
I am not just looking at RSI but it is the most compelling now . For me 1131 was the major resistance and it went through that like butter . Good luck picking a top . Top pickers need luck .
I love when people get bullish it gets me excited. it seems you’re finding a reason for your emotions. Good luck to you!
I don’t have emotions . It’s called experience .
Seems to me all you have is the EW count . That’s it .
It does seem like this could be short term top at the very least and i’ve initiated a small short. Question in my mind is what’s next. On many charts, this looks like it was a clear big 5 wave up from the bottom. Could be an A wave, could be a first wave. Could also be the end of minute 4 but that remains to be seen.
It certainly does look like a big clear 5 up on the daily chart. Moreover, gold must be getting exhausted by now – the last $30 move has been relentless.
Still hard to say whether the final high is in or not until we get some downward movement again. Need to see if the move down is a 3 or a 5 to know what comes next.
Bollinger bands are telling me that gold is getting close to the end, if it’s not there already. I have no doubt that 1162.80 will hold. The correction will end in the 1150s.
Many miners have gapped up on significant volume. If those are exhaustion gaps, they would be consistent with Lara’s EW scenario for gold.
Heavy volume on breakout above 1141 is not a good sign for a wave 4. Either way, I would expect a correction fairly soon.
Stock Market sell off triggered safe heaven demand. So Typical of it
I agree. I can’t get volume data from StockCharts for $GOLD until NY closes. My FXCM data shows an increase in volume for today’s up day.
Which has me very concerned indeed regarding a wave count which expects this upwards movement to end.
I need StockCharts data to see what’s happening for all the other indicators there.
And I am spending some time this morning on looking for an alternate.
My Stockcharts volume is showing the highest volume in quite some time. Over 2 years! Are you seeing that too?
Yes.
Which strongly makes me think that the wave count is wrong.
Still working on an alternate.
count…
That looks good. There is a possibility that submicro 3 ended one bar earlier than your markings and that submicro 5 is extended.
Spot gold daily chart is testing 1150 which once was support now is resistance. Read my post last night.
Rob you were right. Good call.
The global stock markets tumbled today to an 8 month low,….minerals and miners (gold included) ALL shot up in price when this kind of global event happens,….just got to wait it out till the dust settles and things get back to normality…..
Minute wave iv target of 1141 is exceeded. Current high is 1145.
Any one knows if this wave structure is complete??
Gold is still in a 4th wave correction in a larger downtrending market. If anyone is unsure of that, take a look at this upward movement in the context of a weekly chart.
The Area 1140 to 1150 Is huge resistance area…
but if the price closes above the resistance Then thee will be change of price going to 1200 area.. Otherwise it will break below for new lows
I am looking at the weekly chart . And …
Anyway that you look at it, the move down is incomplete from an EW perspective.
This move up is also tiny in the whole scheme of this multiyear bear market.
Yes, and I see volume for this week is lower than last week. Both up weeks.
When I have today’s data from StockCharts I’ll have a better picture.
Gold topped at 1142.24 at 1:55 am then just started dropping $3.50 in 20 minutes.
Gold hit the $1,142 “very strong resistance” area 6 times then dropped.
Now we have to count five down on 5min chart.
I am rooting for a 3 down for micro 4.
Looking very bullish so far
Hi Alan Tham,
do you think we still in mircro 3?
At the moment, I would say it is the 3rd wave of micro 5. Micro 4 has a nice 3-wave decline. The second wave of micro 5 was a perfect 0.618 retracement of wave 1, so I am quite confident that I am right.
In the pre-market, DUST has dropped below my main target of 21.79, so I am looking at my second target of 19.20 in which to enter the trade.
thank you very much!
are you still confident in your dust target?
it looks like gold could have topped?
Hi Raphael. It is unwise to pick a bottom. I scale in on the way down and/or up. Got one trade at 19.89. Going for others.
thanks, i know ^^
silver could make a double top ^^.
i think the top in gold is very near.
Looking at Lara’s wave count, there is the likelihood that 1142.24 was the end of micro 3. The current drop is micro 4. So, micro 5 would again test the “strong resistance” perhaps to exceed it at least slightly. I will be disappointed if a truncation occurs, but it is possible because it can fit as a too far ($27.29 rise) too fast (about 13 hours) occurrence. Moreover, DUST has not bottomed yet, although it can truncate at yesterday’s low of 22.30, but I can’t think of any reason why this can be so. The minimum DUST should touch is 22.05.
Is there anybody who thinks that 1142.24 is the end of Minute 4?
Hi Alan Tham: IMO Gold price appears to have more upside to go. Hard to see Gold price below break below $1136 for $1128 in a hurry…. An up trending support is rising about $3-4 a day currently at $1104-05…. It is a concern (given enough time) that $1162.8 invalidation could likely be taken out with upside risk subsequently coming in at 118x-119x….
Hi Syed. My sentiments exactly.
If gold price manages to surge past the “strong resistance” area, then the next possible stop is at 1152.91 (0.618 retrace). If, at that point, it can still muster the momentum to reach the 1160s (the bear trend boundary), then a bull market could ensue. Terrifying thought!
But all these are conjectures at this stage. The most important determinant is still PRICE. Let’s await developments. Market is not open yet.
Hi Alan: Agree with your contention to wait it out: Time and Price will tell us which way this is headed. With the up trending support currently at $1104-05 and rising at $3-4 a day, a break below $1105 begins to look distant. By Friday this support level will likely be up to $1108-09. Hard to see Gold price below 10dma at $1116-17 which is rising. Near term resistance if taken from H $1205 / L $1073 at 61.8% comes in around $1154-55…. On another note, DMI+ is now above DMI- on the daily, that’s negating the down trend…. No hint yet from Gold price where it intends to top lol…. Good luck to all…. 🙂
1160 seems to be reasonable target based on the trend line from January this year. That target invalidates Lara’s current count though.
Hi Syed, Its RPK. Nice to find you here.. Your point is taken and I will look out for the upside risk. I have a sell currently at 1141 with SL at cost now.
Tham, I can see the structure and wave count as complete for subminuette 5, minuette (c), and minute IV. The implication of that would likely be that the high and end of the correction for GDX was back on Aug 12 and GDX is already in a wave 2 correction for the drop down. That would mean that the low in DUST should also have been on Aug 12, but it’s still possible that DUST may get a marginal new low Thursday AM without GDX making a new high due to the 3x leverage. If DUST makes a new low without GDX making a new high, I would think that would make an EW count on DUST suspect.
I don’t believe that EW counts can be accurate on 3x leveraged stocks or etf’s, but it seems to work for you, so no argument there. We should know in the next few hours if the top is likely in, although confirmation may take until Friday or Monday.
Tham, you were correct on the top not being in. Good call.
Gold just exceeded Lara’s $1,141 target.
Gold at 1:51 am just hit a high of $1,142.15 at Lara’s very strong resistance.
Hi Lara,
Do you think, if blue wave count is possible? This came across my mind when i see blue 3 is 161.8% of blue 1. If yes then the current (V) will be invalidated and blue wave 4 could be complicated as blue 4 cannot enter the territory of blue 1 (1032.2) so more crazy correction is coming up since the price is so close to 1032 already?
Thanks.
No, because this downwards movement from the all time high is subdividing as an impulse, not as a corrective structure.
If this was a huge fourth wave correction counterpart to a prior second wave as you have it labelled the invalidation point would be at 1,032.70.
A five wave impulse cannot be the whole of a correction, so this is just wave a of a bigger correction. There is not enough room left for that to complete and remain above 1,032.70.
oh ok, thanks for the reply 😀
Thanks Lara. I will be looking to start Dust position tomorrow or Friday.
I bought some DUST very cheap today averaged 21.78 with a few profitable DUST trades and hoping to buy some more DUST Thursday even below Wednesday’s low of $22.30. Lara’s analysis is reasurring, although one still should be very cautious and conservative before a trend is established. I watch everything from market open to close.
I’ve been quite busy lately, so haven’t able to watch so much during the day. Looking for the bigger swings now. I had a nice small trade from $10.08 to $11.28 yesterday to today in JNUG. Holding cash waiting for the turn.
Good trade MTLSD.