
Some downwards movement was expected for the new wave count in the short term, which is what has happened. Movement was choppy and overlapping and moved lower for Monday.
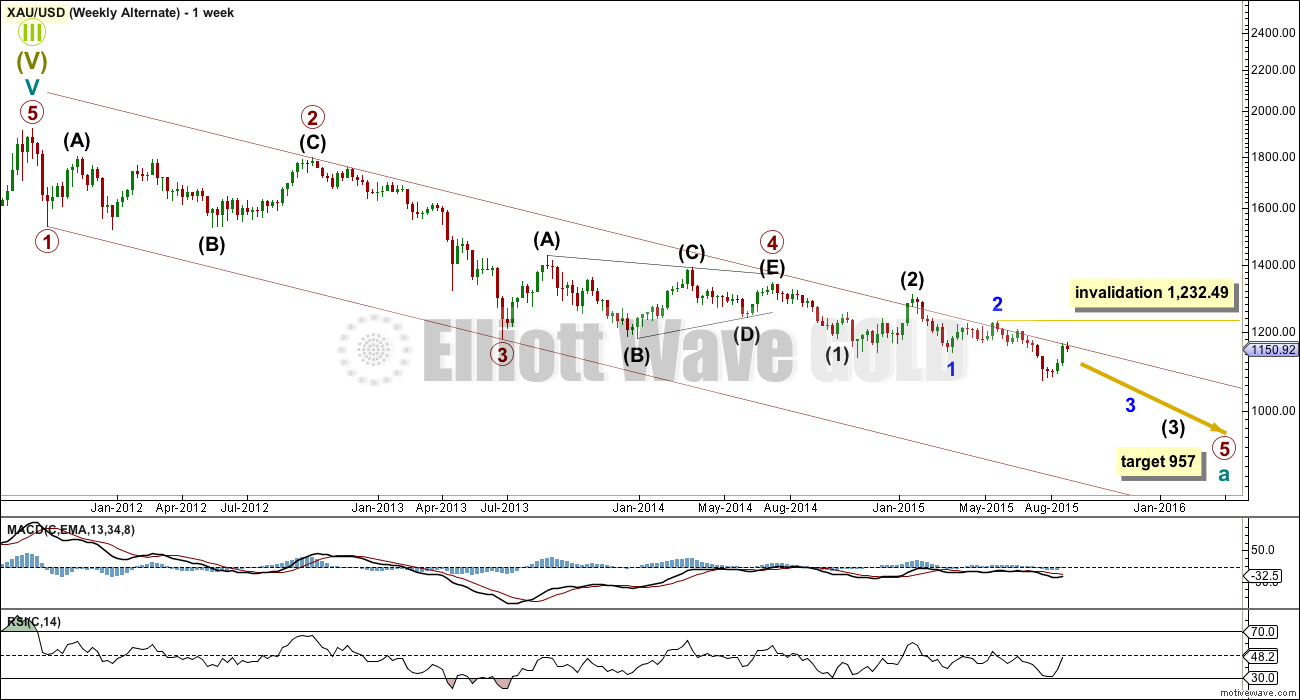
Today I will expand on three different ideas for the new wave count at the weekly chart level. Also, I will rank each idea in order of probability.
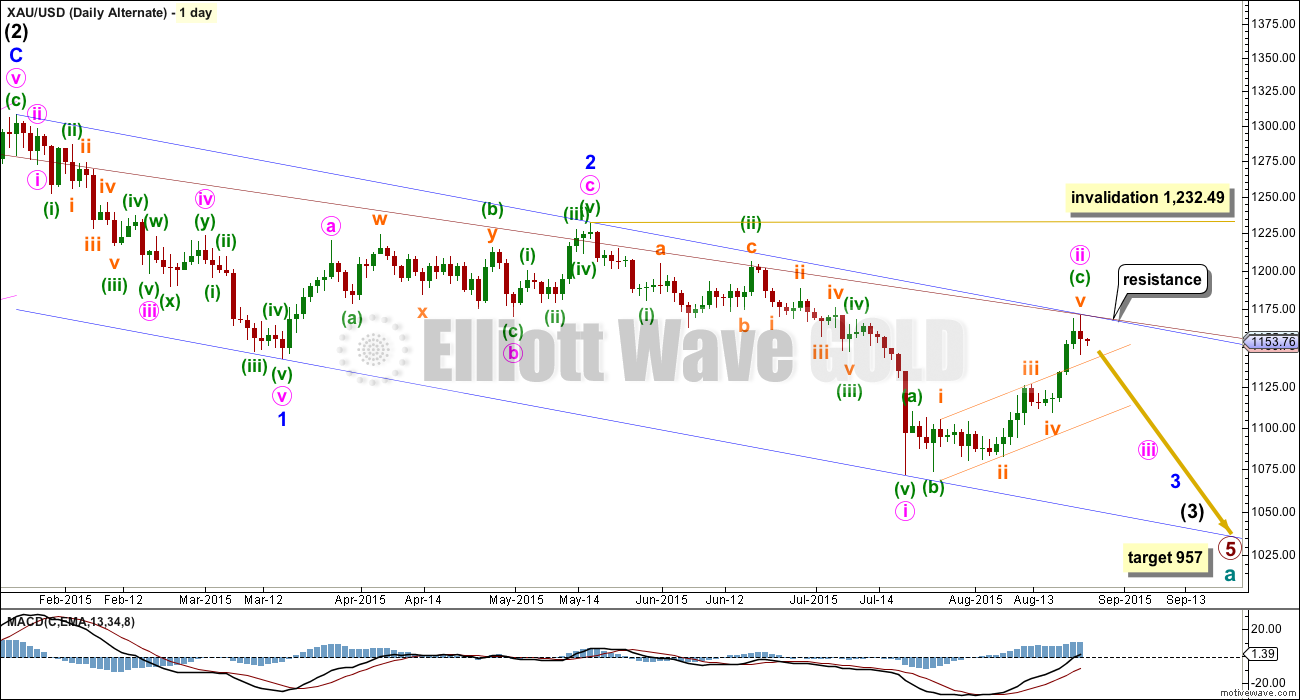
Summary: The new wave count expects a primary degree C or Y wave is unfolding upwards. Also, the new wave count expects this sideways movement is a minor degree fourth wave correction. The alternate bear wave count is still less likely, but today is slightly supported by a volume spike for a down day. Short term I expect Gold is most likely consolidating. When the blue trend line is breached on the daily chart with upwards movement, then look for a throwback and that shall be the end of the correction; the next movement thereafter should be an upwards impulse. The alternate wave count requires downwards movement below 1,119.23 for confirmation.
Changes to last analysis are bold.
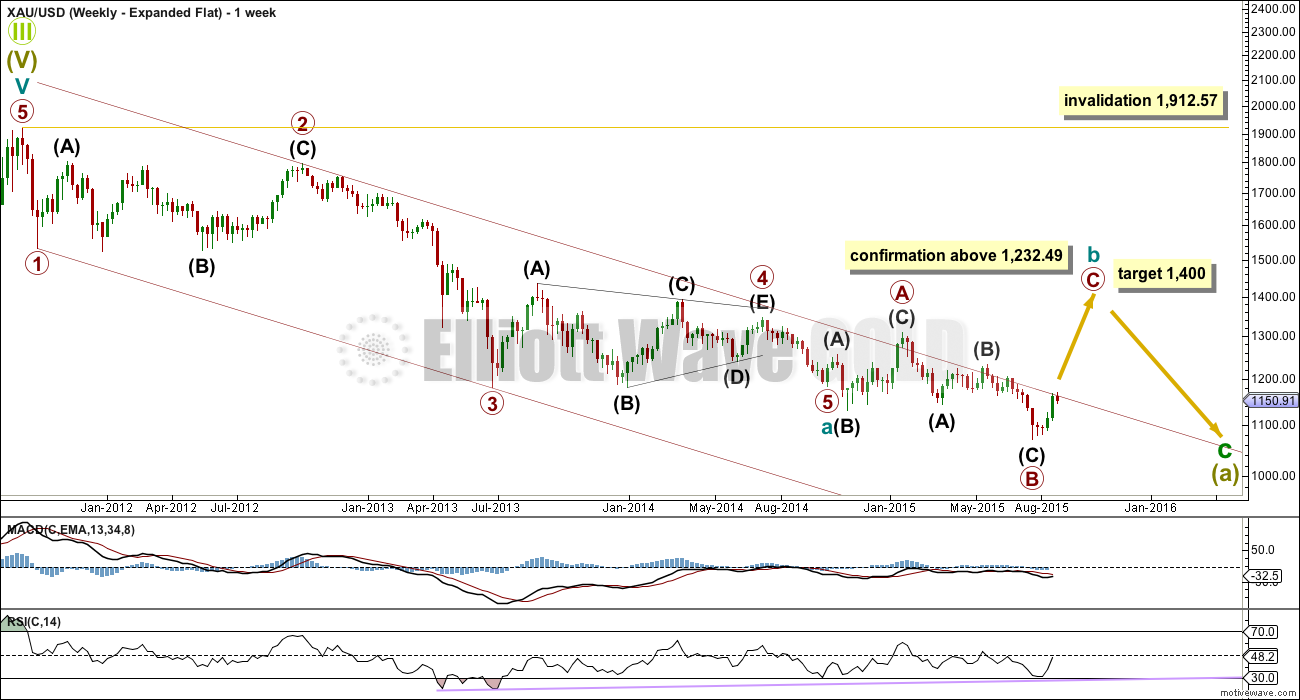
MAIN ELLIOTT WAVE COUNT – EXPANDED FLAT
Click chart to enlarge.
The bigger picture at super cycle degree is still bearish. A large zigzag is unfolding downwards. Along the way down, within the zigzag, cycle wave b must unfold as a corrective structure.
At this stage, there are three possible structures for cycle wave b: an expanded flat, a triangle or a combination. The expanded flat is shown above which may be the most likely structures of the three. I would judge it to have a 50% probability.
Expanded flats are very common. The only thing that is uncommon about this one is the depth of primary wave B, which is 1.89 times the length of primary wave A, so longer than the maximum common length of 1.38 times, but less than the maximum convention of twice the length of A.
The other biggest problem with this bullish wave count (bullish at cycle degree) is the small truncation at the end of cycle wave a. Primary wave 5 was truncated by 2.66. The truncation is small, but it does exist. A fifth wave truncation comes after a third wave that moves price “too far too fast”. The end of primary wave 3 had a very strong fifth wave extension which may fit the description of “too far too fast”. This wave count is slightly reduced in probability due to the truncation, but still looks overall more likely than the alternate bear wave count.
Within the expanded flat, primary wave C would reach 2.618 the length of primary wave A at 1,400.
Along the way up, a new high above 1,232.49 would eliminate the bear alternate and a new high above 1,308.10 would eliminate the triangle wave count. If upwards movement is a five and not a three, then the combination would also be eliminated.
Because cycle wave a was a five wave structure, cycle wave b may not move beyond its start above 1,912.57.
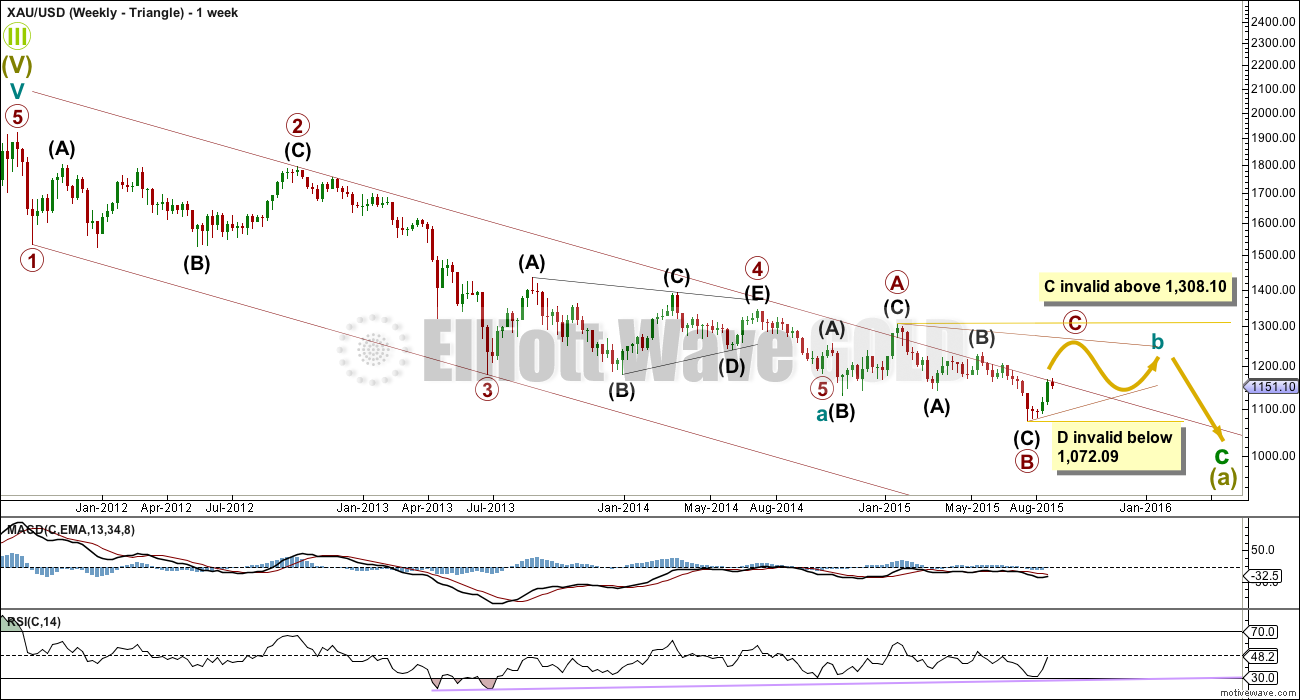
MAIN ELLIOTT WAVE COUNT – RUNNING TRIANGLE
Click chart to enlarge.
The second possible structure for cycle wave b would be a big running triangle. Running triangles are seen in about 40% of triangles, so this structure is less common than an expanded flat. I would judge this idea to be about 20% likely.
Within both a contracting and barrier triangle, C may not move beyond the end of A above 1,308.10. This invalidation point is black and white. C may end about 1,260 where it would be about 80% of B, a common length I have found over the years for triangle sub waves. C must be a zigzag or zigzag multiple.
Because the first wave of primary wave A is an expanded flat correction, all the remaining triangle waves must be zigzags and one may be a more complicated time consuming zigzag multiple.
For a contracting triangle D may not move beyond the end of B below 1,072.09. For a barrier triangle D may end about the same level as B as long as the B-D trend line is essentially flat. What this means in practice is that D may end slightly below 1,072.09. This invalidation point is not black and white; this is the only Elliott wave rule which involves any grey area.
The final sub wave of primary wave E would most likely fall short of the A-C trend line, and it must be a zigzag or zigzag multiple.
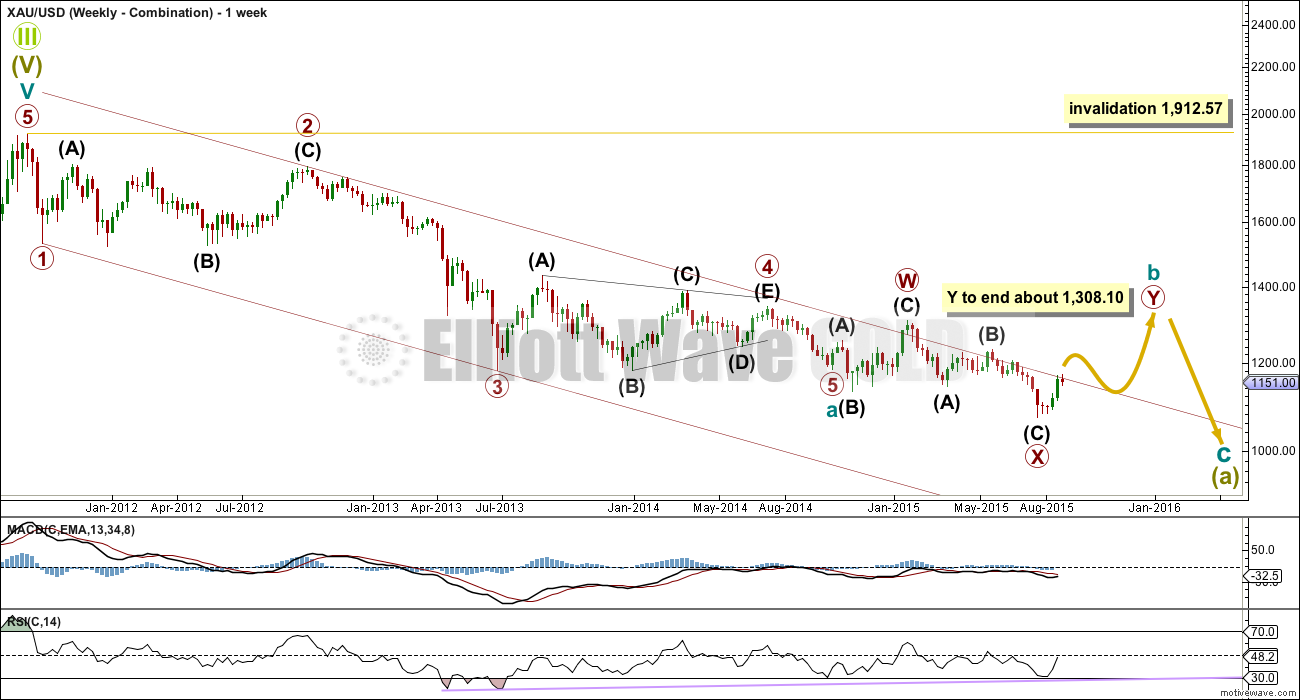
MAIN ELLIOTT WAVE COUNT – COMBINATION
Click chart to enlarge.
The third possibility for cycle wave b at this stage would be a combination. Combinations are very common structures, but normally their X waves are not this deep. For this reason I would judge this idea to have about a 20% probability.
The first structure in the combination was an expanded flat labelled primary wave W. The two structures are joined by a “three” in the opposite direction, a zigzag labelled primary wave X. The second structure in the combination may be a zigzag labelled primary wave Y, or may also be another flat correction so that this structure for cycle wave b is a double flat.
The purpose of combinations and double flats is the same (also the purpose of triangles): to take up time and move price sideways. In order to achieve this purpose the second structure in the double normally ends close to the same level as the first. Primary wave Y may be expected to end about the same level as primary wave W at 1,308.10.
If primary wave Y is a flat correction, then it may include a new low below its start at 1,072.09. This is the most important feature of this idea to note: a new low below 1,072.09 does not eliminate a bull wave count for cycle wave b. If that happens, then careful attention to structure and detail would be required to see if this idea may be unfolding.
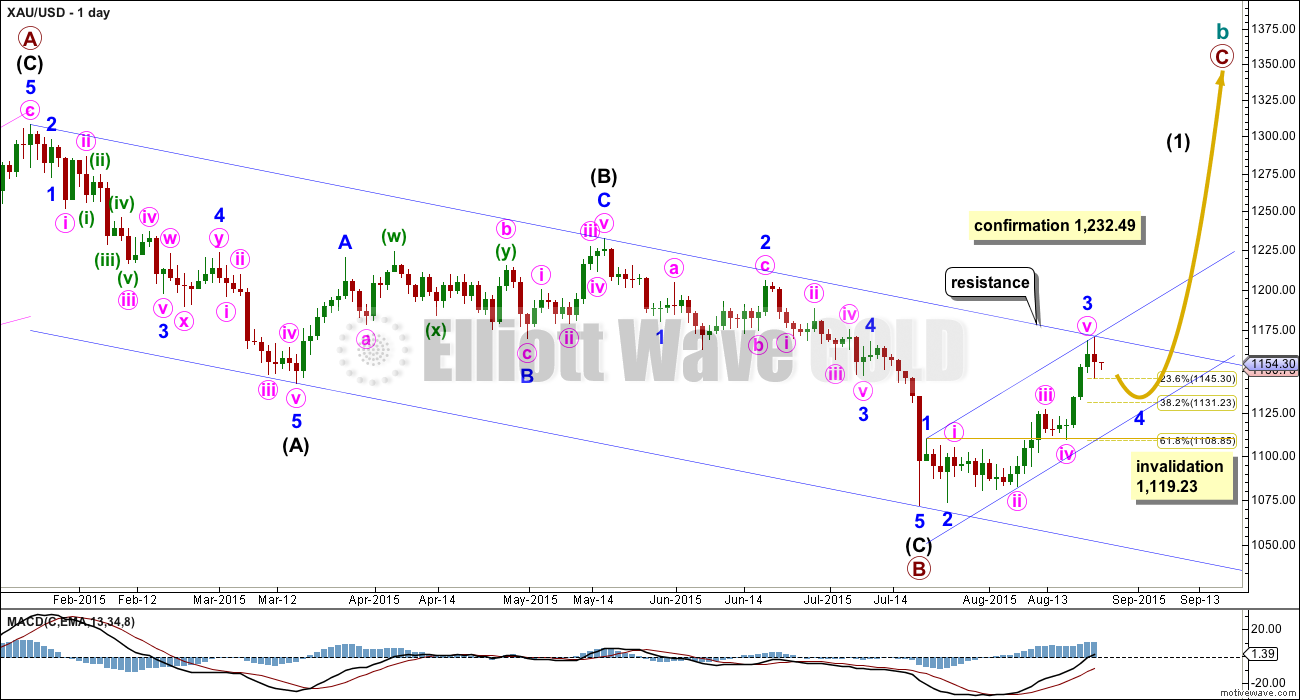
MAIN WAVE COUNT – DIALY
Click chart to enlarge.
This daily chart works for all three ideas at the weekly chart level. After today I will publish just the daily chart each day, and revisit the weekly chart level just once a week.
For all three ideas a five up should unfold at the daily chart level. This is so far incomplete.
Upwards movement is finding resistance at the upper edge of the blue channel and may continue to do so. Use that trend line for resistance, and if it is breached, then expect a throwback to find support there.
Minor wave 3 was 4.42 short of 2.618 the length of minor wave 1.
Minor wave 2 was a very deep double zigzag. Given the guideline of alternation minor wave 4 may be expected to be a shallow flat, combination or triangle. Minor wave 4 may end about the 0.382 or 0.236 Fibonacci ratios, with each ratio equally as likely. Movement should be choppy and overlapping.
Minor wave 2 lasted a Fibonacci three days. Combinations, flats and triangles are all longer lasting structures than zigzags, so minor wave 4 may likely total a Fibonacci five or eight days. So far it has lasted only two.
Minor wave 4 may not move into minor wave 1 price territory below 1,119.23 (this price point is taken from the hourly chart level).
Draw a channel about this upwards movement: draw the first trend line from the ends of minor waves 1 to 3, then place a parallel copy lower to contain all this movement. If minor wave 4 is time consuming enough, then it may find support finally at the lower edge of that channel.
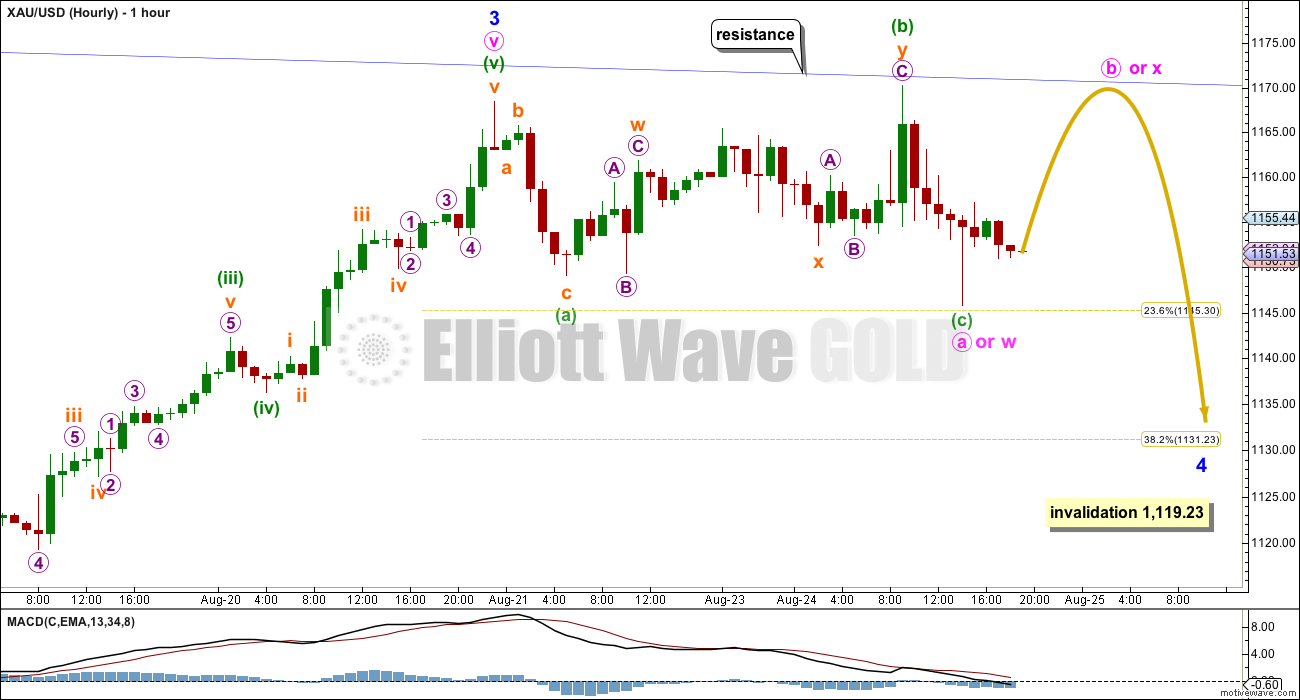
Click chart to enlarge.
Although an expanded flat correction moving sideways is now complete, because the overall structure completed too quickly then it is unlikely to be a complete structure for minor wave 4. This is most likely only minute wave a within minor wave 4.
Minor wave 4 at this stage may still continue as either a flat, combination or triangle. All three of those structures begin with a “three” for the first wave.
The next expectation for all three possibilities would be a three up, most likely a zigzag. This may be minute wave b within a bigger flat for minor wave 4, or minute wave b within a triangle for minor wave 4, or minute wave x within a double for minor wave 4. If this next wave up reaches a minimum 90% of minute wave a at 1,166.15, then a flat correction for minor wave 4 will be possible. If it does not reach that price point, then a flat may be eliminated.
Overall this structure is incomplete and multiple possibilities remain. There are 23 possible structures a fourth wave may unfold as, and here we can only eliminate three (zigzag, double zigzag and triple zigzag). As this structure unfolds the wave count within it may change. My focus over the next few days will be to see when it is over, and then provide price points and trend lines to use as confirmation of the end of this consolidation.
Gold is most likely within a correction, and it should be noted that trading small corrections is best left only for nimble and very experienced traders. For the rest of us (myself included), the wisest approach to a consolidating market is to wait for the consolidation to be over and a clear trend to re-emerge before re-entering.
ALTERNATE ELLIOTT WAVE COUNT
Click chart to enlarge.
I would judge this alternate wave count to have about a 10% probability at this stage.
This wave count is now an alternate, because it has the following problems which the new wave count resolves neatly:
1. Intermediate wave (2) is much bigger in size than an intermediate correction within Gold’s impulses normally are.
2. The maroon channel has been breached on the daily chart twice. This is an early indication that cycle wave a may be over.
3. Minor wave 2 is much longer in duration than a minor degree correction within Gold’s impulses normally are.
4. Gold often exhibits very short fifth waves to follow its fourth wave triangles.
*Note: today volume does support this wave count.
A new low below 1,119.23 in the short term would confirm this wave count. Full and final confirmation would come with a new low below 1,072.09.
If primary wave 5 reaches equality with primary wave 1, then it would end at 957.
Click chart to enlarge.
This wave count now sees a series of three overlapping first and second waves: intermediate waves (1) and (2), minor waves 1 and 2, and now minute waves i and ii.
The blue channel is drawn in the same way on both wave counts. The upper edge will be critical. Both wave counts expect some downwards movement from here to bounce down from resistance about the upper blue trend line. Here the blue channel is a base channel drawn about minor waves 1 and 2. A lower degree second wave correction for minute wave ii should not breach a base channel drawn about a first and second wave one or more degrees higher. If this blue line is breached by one full daily candlestick above it and not touching it, then this alternate wave count will substantially reduce in probability.
Minute wave ii may not move beyond the start of minute wave i above 1,232.49.
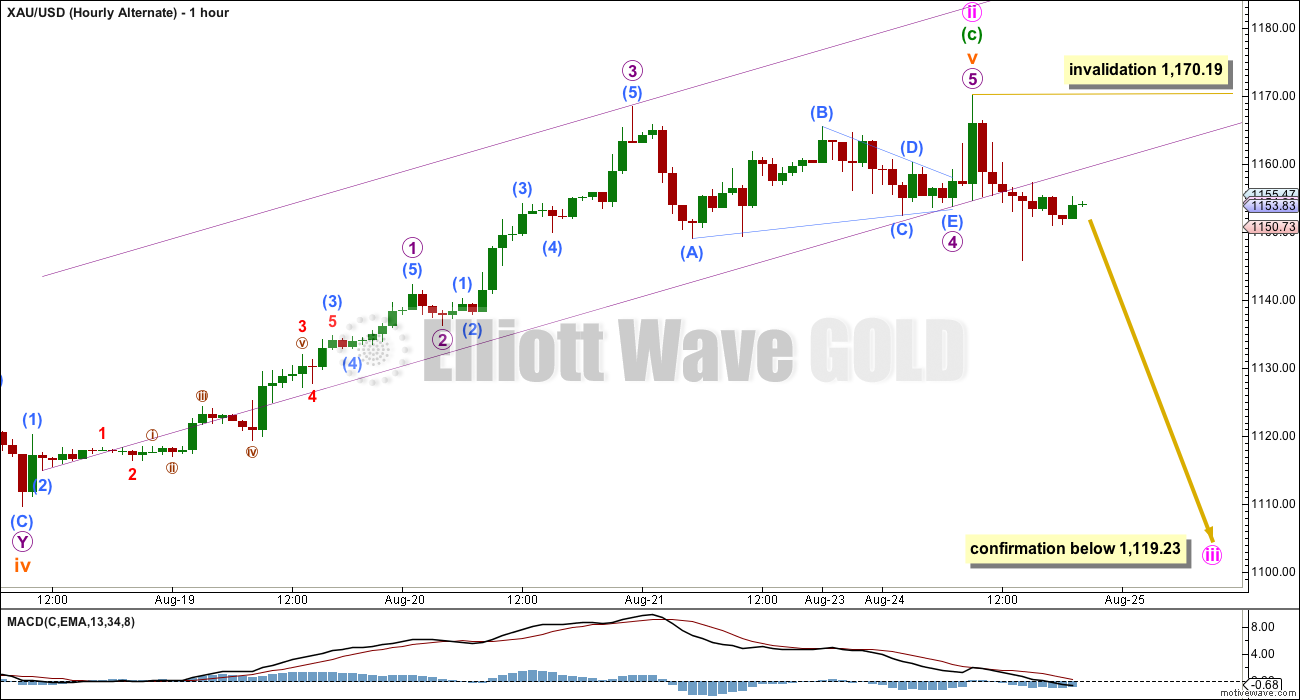
Click chart to enlarge.
A slight new high for this alternate idea may only be a continuation of minuette wave (c).
There is more than one way to label the subdivisions within subminuette wave v. No matter how it is labelled, if a fourth wave triangle is seen as labelled for micro wave 4, then there will be gross disproportion between micro waves 2 and 4. Here micro wave 3 is just 0.47 short of equality with micro wave 1 and there is no Fibonacci ratio between micro wave 5 and either of 1 or 3.
A fourth wave triangle may have ended for micro wave 4. This structure does not look typical because the triangle trend lines are not perfectly adhered to. Triangles normally sit well within their trend lines; the occasional overshoot sometimes happens, but here the B-D trend line is slightly overshot three times. Normally price touches the trend lines perfectly.
Within minute wave iii, no second wave correction may move beyond its start above 1,170.19. A new high above that point would invalidate the labelling here of minute wave ii and may only be a continuation of minute wave ii. The invalidation point on the daily chart is the final invalidation point for this wave count at 1,232.49. However, if the blue base channel on the daily chart is fully breached by a daily candlestick above it and not touching the trend line, then this alternate may be discarded.
TECHNICAL ANALYSIS
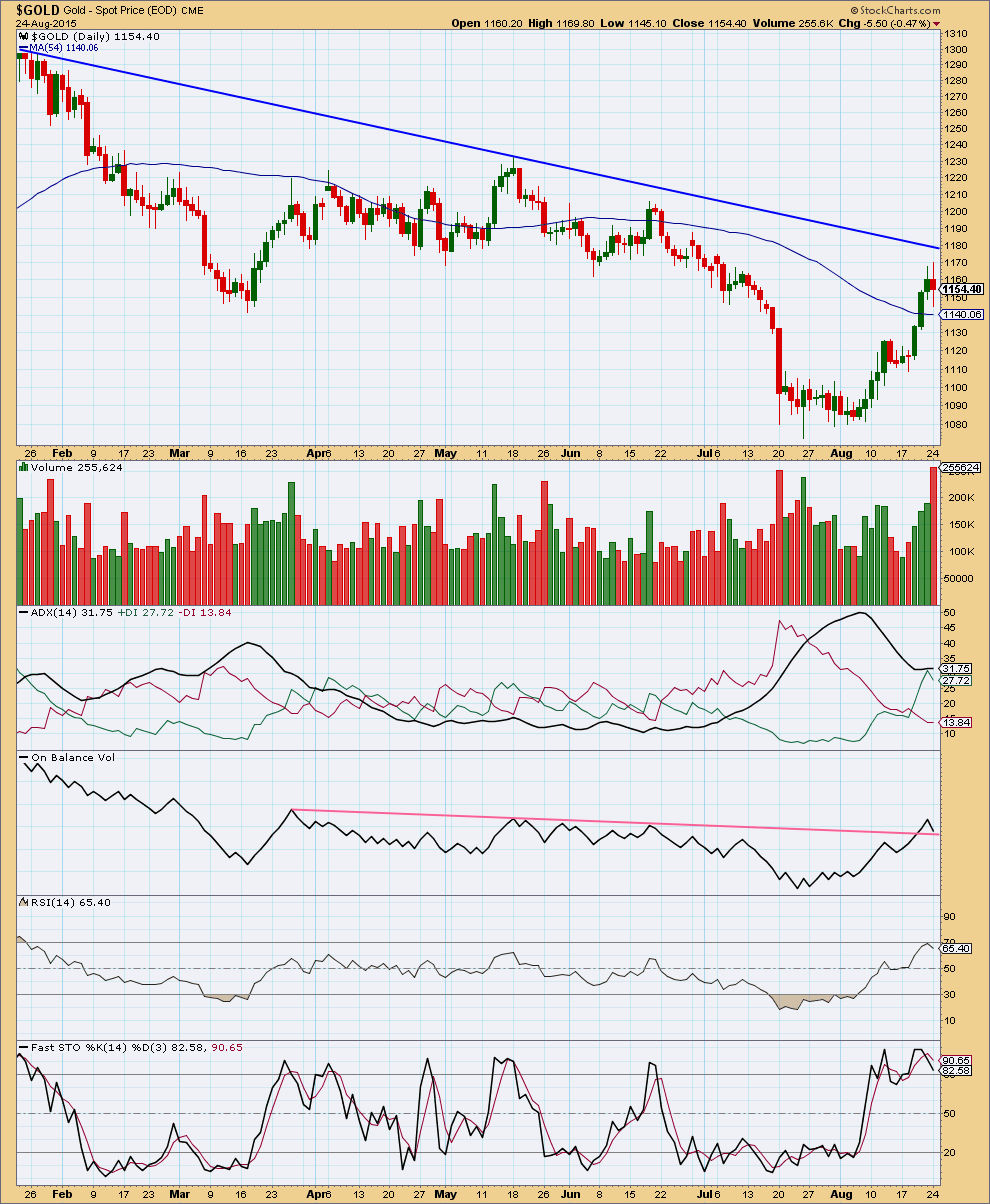
Click chart to enlarge. Chart courtesy of StockCharts.com.
It is concerning that today completes a red candlestick with much higher volume. Volume at the daily chart level today supports the old bear wave count, not the new bull wave counts. If the blue trend line on the daily Elliott wave charts hold, then the alternate wave count must seriously be considered and will remain viable.
While price has been rising last week volume has supported this rise in price. Overall that still indicates this upwards movement is not a correction but part of a new trend, and that favours the bull wave counts and not the alternate.
ADX is slightly rising and is above 30. The green +DX line is above the -DX line indicating there is a new trend and it is up, which favours the bull wave counts.
On Balance Volume has breached its pink trend line and has come down to find support there. If this trend line holds, then that shall be quite bullish.
RSI is returning from a high, and did not manage to reach overbought. There is still room for price to rise, and if a few days of sideways movement see RSI move lower, then that shall allow further room for price to rise.
Stochastics is returning from overbought. I would expect a small consolidation to see Stochastics return to normal before the new trend continues.
Overall this regular technical analysis supports the bull wave count (main) more than the bear (alternate), but the volume spike for a downwards day on Monday may be an early indicator that price may break strongly lower. The situation is a little unclear and should be resolved in a few days.
This analysis is published about 09:03 p.m. EST.
So we are below 1119.23 so down to 5 is confirmed?
The market is always a tossup…..
….. with your money being the only thing you can control.
No amount of blog entries will change the market very much but………..
here’s a well reasoned position on LT GOLD from a guy whose TA kung fu is historically strong…
http://www.gold-eagle.com/article/gold-price-forecast-final-bottom-gold
FULL DISCLOSURE…sold my DUST this morning…..33% profit 2 days….THANK YOU LARA….currently no position and waiting for a clue to signal end of W4….or????
GDX fib ratios look very interesting at the close today.
.786 retrace from 16.16
Anyone else seeing a cup and handle pattern on the daily chart?
I’ve been short last couple of days, I now have my stop in to take profit. Looking to go long if the price breaks up through the handle trend line.
Note divergence on monthly charts look positive, but may take a while to play out.
For me Lara is doing a terrific job. made some good profit by letting her charting help guide my own trading.
On gold/gdx/dust? I see a potential cup and handle on daily for dust which volume seems to favor also.
Thanks Joseph,
I’ve now drawn a trend line for the handle,hoping this pattern plays out. Should be a nice trade if it does.
Alex
This statement by Lara is acceptable for EW principles to be meet.
““As long as I consistently use the same data feed for the EW analysis then the wave count will be correct for that data.”
There are endless sources of data feed in in the world. And they don’t all provide the same information. In a perfect world they would, but they don’t. So our data feed may be different than Lara’s.
There is no way to once and for all determine which one is the most correct.
That would be impossible.
All that is required is that Lara consistently use the same quality data source to ensure the utmost consistency in her ongoing analysis. There is no need for her data to agree with all members and so many members it won’t be possible unless we all use the same data provider.
Yes Richard agreed. I know I have brought this up a couple of times in the past myself because I was troubled by by the fact that it could cause a divergence in counts. I am satisfied that there really is no resolution to it. At best, one must at least be consistent with the data they are using each day, which is what Lara does.
We should note, for the spike low that particular day, FXCM had 1071 I believe, Stockcharts had 1080, Investing . com had 1083.5 and Barchart had 1088.1 in the cash contract. So it’s not like FXCM was wrong and everyone else had it correctly. In fact, one might speculate that FXCM was the only one that was right as it was more complete.
No way to know for sure. Use Lara’s analysis, consider an alternate count based on a different data feed (e.g. consider this is a bigger wave 2, not wave 4), and use one’s own TA to confirm/overrule. I think that’s the only sane way to proceed
And PMbull had 1072
and if I did a different wave count for each I’d never have time to anything else
that’s just not going to happen
Now out of 90% of my DUST position.
Lara, it appears from your comment about today’s action that if it remains a 3-wave, we go up from here in the bull, but if it’s a 5-wave, then we are in the bear count. Is it that simple right now to separate the bull and bear? I must be over simplifying this.
No need to respond, I am sure today’s analysis will be clear.
Lara ,
Your answer to me below is totally unacceptable . You yourself have pointed to the fact that the data is not accurate . If two data feeds differ by whether there is a new low or not , then that 100% merits an extra count to see what the count would look like in the opposite case . What is so difficult to understand about this ? Looks to me that you just don’t want to put the extra effort in … that is fine but you should be honest and say so .
To claim it does’t matter what data you use makes no sense .
New low or not new low . Doesn’t matter . Lol .
As to your question as to why I subscribe , I wasn’t planning to continue anyway no . I am better off just reading your free monthly post to get some possible ideas .
You do not want to accept that there is a reason for different data from different providers.
You seem to think the data I’m using is wrong so my work is wrong.
I know that volume data from FXCM is unreliable, but that does not mean price data is also unreliable. That does not change retrospectively like their volume data does.
How do you know the StockCharts data is right? You don’t.
Do you seriously expect me to do EW wave counts for both sets of data?
I do not think you understand how much time each analysis takes. It takes literally hours.
I will refund your last payment and cancel your membership.
I can vouch….
Even with the motive wave program (as amazing as it is) analyzing one commodity can take hours of your time. Some days are straightforward but the last several weeks have been consuming, not to mention confusing .
Equally frustrated but understand …
I don’t normally get involved in the ramblings of others, but this one hits a raw nerve so I feel compelled to put forward my opinion. Please don’t get me a rong; picking a quarrel is the last thing on my mind.
I do my own due diligence every day after market closes, and each analysis takes at least one hour. I acknowledge that I am no expert, not even anywhere close, hence the inordinate amount of time spent. To ask Lara to do additional work because of different data feeds is very unfair to her. Even if she is willing to accommodate this, what good does it do? Does it mean higher precision? I don’t think so. Bear me out as I recount my experiences working with data.
As an engineer by profession, I have worked with data all my life. We have to make decisions based on whatever data we have. These are much more incomplete and unreliable than what we have here. The reality in life is that we have to make judgment calls in real time. We cannot afford to delay until more data becomes available. And how do you know that additional information increases accuracy? Mathematically, every data set contains errors. Barring errors in the data source itself, you have to consider how the data is being obtained. Simply put, Information stream is continuous but data obtained from it is done by sampling. You have to contend with sampling rate, sampling intervals, truncation errors, instrumental errors et al. Worst case scenario, errors stack up in one direction. There is no escaping the inherent inaccuracies in any method of data sourcing. We all have to live with it. This is an imperfect world, but hey, it’s home.
Lara, the hourly alternate looks more like the gold movements today.
Did the stock market correction today effect the overall bullish outlook.
Does gold next head for 1131 then up much higher or still need to go to 1,170 area before
1,131 then bullish up or does the bearish alternate now have increased probability?
You would think so at first glance, but that downwards movement does not subdivide as a complete five. It looks much more like a three. Which fits the main hourly wave count better.
So far I see lower volume for today. If that’s how the day closes (and StockCharts data including volume is not available until NY has closed) then it does not support the fall in price and so is bullish rather than bearish.
Do you see more near term downside?
If this is a fourth wave correction then it may move up from here to 1,165 or above.
If it’s a new wave down for the alternate count it needs to stay below 1,145.82.
Not ambiguous enough ?
Lara, clear and helpful thank you. Just what I needed until full analysis is out.
Yes, very clear and helpful. :
[recent] …”downwards movement does not subdivide as a complete five. It looks much more like a three. Which fits the main hourly wave count better.”
If this is a fourth wave correction then it may move up from here to 1,165 or above.
If it’s a new wave down for the alternate count it needs to stay below 1,145.82.
,,,, Thank you Lara
Gold ends near one week low as ‘stench of fear’ abates – Aug 25, 2015 3:16 p.m. ET
http://www.marketwatch.com/story/gold-dips-haven-demand-weakens-as-stench-of-fear-abates-2015-08-25
I’ve been taking profits on DUST today, up about 40%-50% in 3 days. bull or bear, I have to take that off the table.
DUST just went up 50.25 % to 29.81 since Thursday close of 19.84
Great trade MTLSD. Cha-Ching.
My avg. was $19.71, sold at $25.22, 29.20, and holding the rest for $30+. Had a quick 5% gain on DGLD overnight as well. This has been a great 7 or 8 trading days for me, I had a very nice Natural Gas short trade last week. Lara might like to EW natural gas, it LOVES it’s fibs.
Whether we are bull or bear, we will end this impulse down shortly and turn up, and I plan to be positioned for that.
I’ll be off for the rest of the day, good trading to all!
Congrats!
Thanks! Still unsure if we are going to drop here or bounce back up to finish. GDX looks like it wants to go lower still, but maybe just to finish a b wave. We shall see.
A three-day (Stock markets) bounce is now possible into Thursday.
Western Share Markets Rebound – Decoupling from China
http://www.armstrongeconomics.com/archives/36488
Do you know what else he is saying about the market longer term ? He says test of the lows will come after the bounce … Is that going to be a successful test or is he bearish ?
I don’t know as just noticed this that is all.
Any wave count.
Where to next for gold today $1131 or towards 1170 or stay at 1136 until Lara comments?
Richard. We are now in a 4th wave. It could be minuette 4 of minute c of Minor 4, or subminuette 4 of minuette 3. This means there is one final fifth wave down (in the first case) or a 5th, 4th and 5th (in the second scenario). Apologies, couldn’t spare the time to count down to the smaller waves for added precision. Am too tied up with monitoring S&P, oil, and DUST at the same time also. Perhaps someone could shed more light on this?
Miners being dumped big today. GDX down 3%
DUST moved up much higher than should of at this gold price of $1136
DUST is priced as if gold is about $1,110
I think it is way overbought at $29 and will drop unless gold keeps moving down today.
Gold almost looks like it is in the bearish wave count instead of bullish hourly.
It just took off up because markets and US dollar jumped up and gold dropped at open and kept dropping.
All markets up big today some even up 9% Australia ETF except precious metals.
Don’t blame DUST. It is just acting out its EW script. I have it as a fifth wave starting from 24.50 and with a first target of 30.36. (My first target for the third wave was surpassed, that’s the problem of trying to fit a Fib ratio to a wave count, but the fourth wave was quick).
I didn’t work out EW for NUGT yet. Theoretically, it is supposed to be correlated to GDX, but they are two separate entities. GDX count may not be mirrored in NUGT.
By the way, as I understand it, the rise in markets today is the dead cat bounce. It will pass. Unless I’m dead wrong.
Disclosure: I was into DUST at the open today as I saw the low as near to my fourth wave target, and am now slowly scaling out my exits. The turn may be abrupt.
Tham, if we assume DUST 5th wave ends at target of 30.6, very generically, how do you see the next few up-coming DUST moves?
He mentioned 30.36 DUST first target.
That is only 2% higher.
DUST just went up 50% since Thursday close.
Amazing.
Yes Richard, my question to Tham was (in a generic sense) what does he project AFTER 30.6. I was soliciting thoughts of a DUST expert on up-coming mid-term DUST moves.
Hi Davey. In my larger degree wave count, the current move up is the B wave of a larger C wave. The C of a C can be looked at as a 3rd of a 3rd, a very deep correction. As a very rough estimate (because a target cannot be calculated with any degree of precision until this B wave completes) I have the C target in the region of 15. I surmise that it would tie in with gold’s subsequent rise to 1400 thereabouts. Time will tell. I’ll take it one step at a time. However, there’s no simple way to short DUST, so I would consider switching to NUGT instead. Will keep you guys posted.
Tham, thank you. Always impressed by your analysis-great help to anyone trading miners as they do move differently than gold. Hope you will post all your analysis as time permits.
Thanks for your help today Tham. Glad you caught DUST run today.
Thanks guys for your kind words. I always believe in sharing among friends. There is nothing to lose and plenty to gain, a win-win situation.
By the way, I exited my last DUST position at 29.90 just before the close. Price was quite close to my target and I felt it was safer to take the money. With the uncertainty in the market, and the unknown long stretch in the Asian and European markets, anything may happen. He who fights and runs away, lives to fight another day.
Alan, you wrote… “I didn’t work out EW for NUGT yet. Theoretically, it is supposed to be correlated to GDX, but they are two separate entities. GDX count may not be mirrored in NUGT.”
Just to check this, I overlaid the price plots for GDX and NUGT. On a one-hour chart, there appears to be a few minor discrepancies over the past two months. The path seems to be almost identical, with a few “overshoots” or “undershoots” for NUGT which I attribute to differences in the log scale of my charts at the current prices.
On a thee-minute, three-day chart, it’s nearly a perfect match, except that NUGT, being 3x leveraged, will show slightly larger bars at these small timeframes.
I’m confident that any wave count for GDX will be valid for NUGT and inverse for DUST.
Thanks Curtis. You are a great help. I will work out NUGT based on GDX. I did notice that they move in tandem most of the time. I noticed also that DUST has a looser inverse correlation with GDX. There are many instances that both move in the same direction, albeit for shorter timeframes.
The reason I said that GDX and NUGT / DUST are two separate entities is that they are marketed by different companies. Well, even if they are from the same company such as NUGT and DUST, I am sure different departments will be working on each of them. You know companies, different departments sometimes don’t even communicate, or at least not 100%.
You’re right Alan, DUST does seem to stray more widely from GDX than NUGT. Not quite sure why that is.
As I’ve traded in and out of NUGT/DUST over the last year or so, I’ve sometimes had the sense that bid/ask pricing was being constrained by computer algorithms within a very tight window. ProShares uses the term “geared” for their 2x and 3x leveraged ETFs. That’s almost how it feels to me.
I suspect the bid/ask window at any given moment is only slightly wider than that of the index or index fund these leveraged ETFs are “geared” to follow. It seems remarkably tight.
Incidentally, have you looked at the underlying assets of these leveraged ETFs? It’s no wonder they warn investors so strenuously against holding them long-term. There is little in the way of tangible assets, but rather mostly “credit swaps” involving large financial institutions.
The financial engineering is under the hood is more complex than I can grasp. I’m happy to day trade in leveraged ETFs, but I rarely hold them overnight, and never for more than a couple days.
Thanks Curtis. The background to NUGT/DUST is very enlightening. What I know is that only some gold ETFs have underlying physical assets, and even then they are unallocated, which gives the ETFs the ability to hypothecate. And that is also a hidden danger. Leveraged ETFs do not normally have underlying assets. It’s all “paper” and so the danger is always there. I only trade NUGT/DUST intraday, like you. When I first started trading these instruments, I hold them for a couple of days, often with disastrous results. I’ve learnt my lesson the hard way and so had sobered up.
Stopped out of short. Was sweet, hope it wasn’t too early. Will look for next long opportunity in next day or so.
Short and sweet, terrific. Great trade Eli. Looks like DUST may have started leveling off at 10:08 and topped at 10:24.
thanks Richard. I may have jumped the gun, but i’m going to have to let the profit gods take the rest. will wait to see how the dust settles. I’d like to go long very soon, but it may be too soon at the moment I don’t know.
Anyone, what would you make of this graph & trend line? Does it not indicate a downtrend is still in place? Forgive my ignorance, I’m a Certified Public Accountant but not at all an Elliott Wave technician.
I think Lara says to wait for break above the trendline to initiate longs .
I am definitely looking for excuse to go short here but there are some conflicting messages . Usually 4th touch of trendline fails . There’s that . And then Lara is giving bear count only 10% probability . She sounds pretty sure about this one .
IMO the downtrend is still in effect but has been weakened.
Gold already hit 1,145.92 at 2:40 am EST.
I thought the Gold bullish count may hit about 1,170 area first before 1,145 or 1,131.
Is the 1,170 area still possible then gold could drop lower?
Lara I just received the email at 1:05 am EST with
EWG New Post: GOLD Elliott Wave Technical Analysis – 24th August, 2015
For a moment I thought something had changed because I saw it on your website at 9:10 pm EST but no changes made to it. It just arrived late.
I’m having doubts about the numbers used for analysis also. If I didn’t see the tick in real time and it’s important enough to have a wave label on it, I must treat it as somewhat suspect now. That’s why I will allow myself to break a rule every now and then.
I do have to warn you though, that if that’s your approach to EW it won’t work.
The rules are black and white. Breaking them because you think the data is suspect will not give a valid wave count.
Thank you Lara, point taken. When I find myself in the grey areas I’ll post a chart for your critique. You are without a doubt the best EWP teacher working today.
Edward I agree with your kind comment. I have learnt more from Lara than any other forecaster. She made me a believer in EW. Before Lara I never heard of EW.
Hi Richard, if Lara is your *first* then I’m sure you’re getting the purest and most unadulterated EWP education available today. 15 years ago though, this stuff was a hard learn.
Cheers Edward. I always like seeing another wave count, sometimes it helps me to see something I’d not considered before.
And part of your membership is my feedback on your own EW attempts. And it’s one of the parts I love the most!
The most valuable part of my subscription was the “Making of” videos you did months ago. Studying the end result is necessary of course, but watching you work motive wave while talking to yourself…
That’s priceless
o7
LOL
I hope it’s priceless because it was good learning, not because you managed to have a good laugh at me.
And if you did, that’s entirely okay.
I’ll be keeping the clips I edit out of my daily videos, one day I will put a bloopers video compilation up. Then we can all have a good laugh 🙂
Lara it is truly a special privilege to receive your EW super analysis.
You make what seems incomprehensible into easy to understand.
Thank a lot for your diverse training and tremendous efforts that
make that possible and happen.
You know that’s ok if you say this kind of thing once in a while but it is like everyday . Makes me wonder what you are actually about and what is your motive . I have been wondering about it for a long time actually .
P.S. Nothing you say is going to help convince me one way or the other . Maybe a conclusive polygraph test only .
alex, relax. I sent it to Lara with zero intent to effect other’s opinions. Every word in my comment to Lara is truly how I feel. I can’t speak for how others feel. I am only expressing my opinion and it isn’t everyday. It might be on average once a month and I am the type of person who believes in the power and benefits of the power of appreciation in the lives of the two people giving and receiving it. I only express it when I am strongly moved deep in my heart to do so. All others are entitled to their opinions and to express them.
I’m not interested in polygraphs or motives. I’m interested in excellence, love, prosperity, honesty and truth and experiencing them everyday as they give meaning to life.
P.S. Thanks for asking. Have an excellent day. Prosperous trading.
Well , if you are being sincere , and looks like yes , then you must be making a ton of money off this service . I would sure like to know exactly how you do it .
I get plenty of pretty negative and sometimes downright mean and nasty correspondence from time to time.
Putting your neck out in such a public way, trying to do the near impossible and accurately predict market movements, invites derision and hate sometimes.
When I get the analysis wrong it can get pretty bad.
So Richards comments are a big relief. He’s been a member since the inception of EWG, about 2 years now. I know he’s genuine, he’s a good trader and he knows what he’s doing.
It’s a good thing what he’s doing, it works, and sometimes his comments lift me up and make me keep going when I’ve received something particularly nasty.
You’re welcome Richard, thank you.
Lara, Thanks for giving us such a comprehensive analysis. Good to see all the options.
You’re welcome. It’s necessary during B waves to consider all possibilities.
Lara , I am also highly interested in the answer to Matt’s question .
Lara,
The main wave count has the first wave up beginning immediately after the July flash crash. This, in turn, makes the wave count look incomplete with only 3 of 5 waves finished. However, if you instead used the data listed in your technical analysis section – which has the ultimate low occurring 4 days later – the wave count could not stand as is.
The alternate wave count can luckily avoid this problem because it’s b wave can be an expanded flat too.
While this is a data problem, it has serious consequences for the resolution of this wave count. Can the bull count be constructed in a different manner, if the data under the technical analysis section is indeed correct (…which I still think it is)?
Thanks.
My FXCM data gives me time frames right down to tick data.
My StockCharts data is daily and higher time frames only.
Different data feeds for this global market will have some differences. I think this is because they’re using different sections of the globe.
As long as I consistently use the same data feed for the EW analysis then the wave count will be correct for that data.
It would be a slightly different wave count possibly for a different data feed.
For the bull count if the data that StockCharts is using sees that final move down as a five then yes, the wave count would be different.
For FXCM data that last wave down simply will not subdivide as a five, it only works as a three. That wave is not ambiguous at all.
“As long as I consistently use the same data feed for the EW analysis then the wave count will be correct for that data.”
If two data feeds differ , one of them must be WRONG . And therefore any count based on it must be WRONG as well .
That’s my take on it unless you have a really good argument to refute . It seems unacceptable to me to ignore the potential effects of bad data . The alternative scenarios should be checked out .
“For the bull count if the data that StockCharts is using sees that final move down as a five then yes, the wave count would be different.”
Yes , the question is how different .
Alex, consider (numbers are imaginary).
There are 1000 dealers buying and selling gold around the world.
(1) StockCharts contracts with 800 dealers for live gold sales data feed.
(2) FXCM contracts with 900 dealers for live gold sales data feed.
Neither encompasses 100% of gold buys and sells around the world consequently there is always some variance in data.
Best any analyst can do is pick the best of several data feed options available and stick with it thru one major gold move. Can not ride two horses at same time–that’s a circus act.
P.S. Also keep in mind there are multiple computers running complex algorithms at various levels in gold sales and data feed process-whether anyone will admit it or not sometimes one hiccups and blips some data and everyone says “where did that come from”.
We are talking about new low or not new low . That doesn’t happen that often . If the data is bad , the analysis bad . End of story for me .
If you think the data I’m using is bad and therefore my analysis is bad I’m not sure why exactly you’re a member. Feel free to cancel your membership at any time. Otherwise, you’ll have to accept that this is the data I’m using, have been for years, and will continue to use.
I have tried BarCharts data, they do not provide Gold cash / spot data. Only futures. The futures data is too light in volume for reliable EW analysis.
I have tried Money.net data, same problem. No spot / cash Gold data.
So which one is wrong?
And possibly either they’re all wrong? Or maybe they’re all right?
Different data feeds have slightly different data. That’s the way it always has been. Because they’re using slightly different parts of the global market, or excluding some small parts of the global market.
I cannot use StockCharts data. It will not synch with Motive Wave.
Some other members may judge the FXCM data to be right and StockCharts data to be wrong.
I cannot answer the question of how that last wave subdivides on StockCharts data because they only provide daily, no lower time frame.
If you think it’s unacceptable for me to ignore potential bad data, how exactly would you suggest I approach this problem? Change the data I’m using to one that you find acceptable? Many other members may not find that acceptable. And remember, it must be able to be used in Motive Wave.
I already said it “The alternative scenarios should be checked out .”
Guess I was ultimately curious what the bullish wave count would be using the numbers in your technical analysis section (because those are the only numbers I see in every gold chart on the web).
The answer is probably that gold made a 5 up and is now in a 2nd wave correction. However, gold could still be in a 4th wave correction if it remains above 1119.23. Only when gold goes beyond the start of 1 at 1077.49 (or thereabouts) is the correction over.