
Movement below 1,119.23 has invalidated how the bull wave count was labelled for most recent movement and reduced the probability overall of that count.
At this stage, I now have a bull and bear count which have about an even probability. Price should tell us which one is correct.
Summary: For the short term, both wave counts expect downwards movement. The bull count expects a zigzag down to end most likely within a range of 1,105 – 1,091. The bear count expects a strong third wave down should be underway. A new low below 1,072.09 would finally and fully eliminate the bull count and provide confidence in the target at 957.
Changes to last analysis are bold.
To see weekly charts and the three different options for cycle wave b (main wave count) click here.
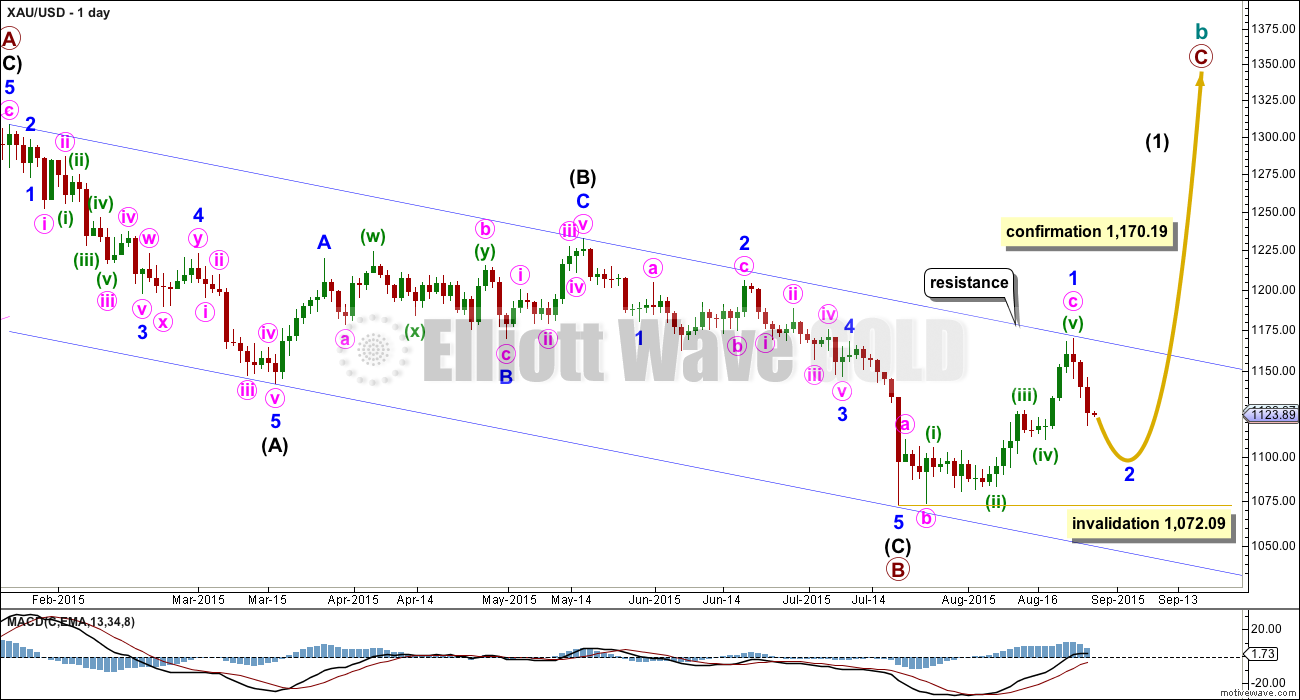
BULL WAVE COUNT – DAILY
Click chart to enlarge.
The bigger picture at super cycle degree is still bearish. A large zigzag is unfolding downwards. Along the way down, within the zigzag, cycle wave b must unfold as a corrective structure.
At this stage, there are three possible structures for cycle wave b: an expanded flat, a running triangle, or a combination.
This daily chart works for all three ideas at the weekly chart level.
For all three ideas, a five up should unfold at the daily chart level. This is so far incomplete. With the first wave up being a complete zigzag the only structure left now for intermediate wave (1) would be a leading diagonal. While leading diagonals are not rare they are not very common either. This reduces the probability of this bull wave count now to about even with the bear wave count.
A leading diagonal requires the second and fourth waves to subdivide as zigzags. The first, third and fifth waves are most commonly zigzags,, the but sometimes may appear to be impulses. So far minor wave 1 fits well as a zigzag.
The common depth of second and fourth waves within diagonals is between 0.66 to 0.81 the prior wave. This gives a target range for minor wave 2 from 1,105 to 1,091.
Minor wave 2 may not move beyond the start of minor wave 1 below 1,072.09. If this invalidation point is breached, then it would be very difficult to see how primary wave B could continue yet lower. It would still be technically possible that primary wave B could be continuing as a double zigzag, but it is already 1.88 times the length of primary wave A (longer than the maximum common length of 1.38 times), so if it were to continue to be even deeper, then that idea has a very low probability. If 1,072.09 is breached, then I may cease to publish any bullish wave count because it would be fairly clear that Gold would be in a bear market for cycle wave a to complete.
To the upside, a new high above 1,170.19 would invalidate the bear wave count below and provide strong confirmation for this bull wave count.
Upwards movement is finding resistance at the upper edge of the blue channel and may continue to do so. Use that trend line for resistance, and if it is breached, then expect a throwback to find support there.
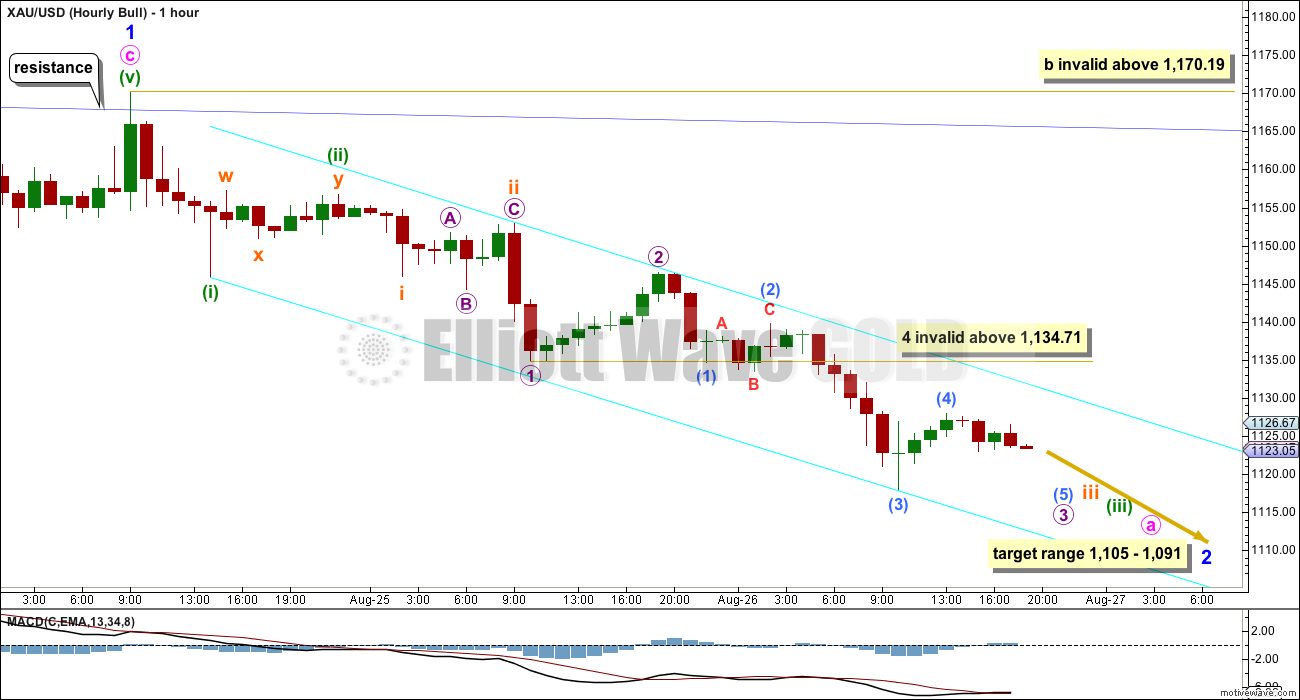
Click chart to enlarge.
Minor wave 2 should unfold as a zigzag. Zigzags subdivide 5-3-5. So far the first 5 down is incomplete.
Within minute wave a, the middle of its third wave looks to have passed. Submicro wave (5) should make a new low to complete the impulse for micro wave 3. When that is done micro wave 4 may not move into micro wave 1 price territory above 1,170.19.
Downwards movement is so far sitting nicely within the bright aqua blue best fit channel. Along the way down, while minute wave a completes, this channel may continue to show where price is finding resistance and support. When that channel is breached by upwards movement, then that may be the first indication that minute wave a should be complete and minute wave b upwards may have begun.
Minute wave b upwards should show up on the daily chart, so it should produce at least one green candlestick and probably more. It may not move beyond the start of minute wave a above 1,170.19.
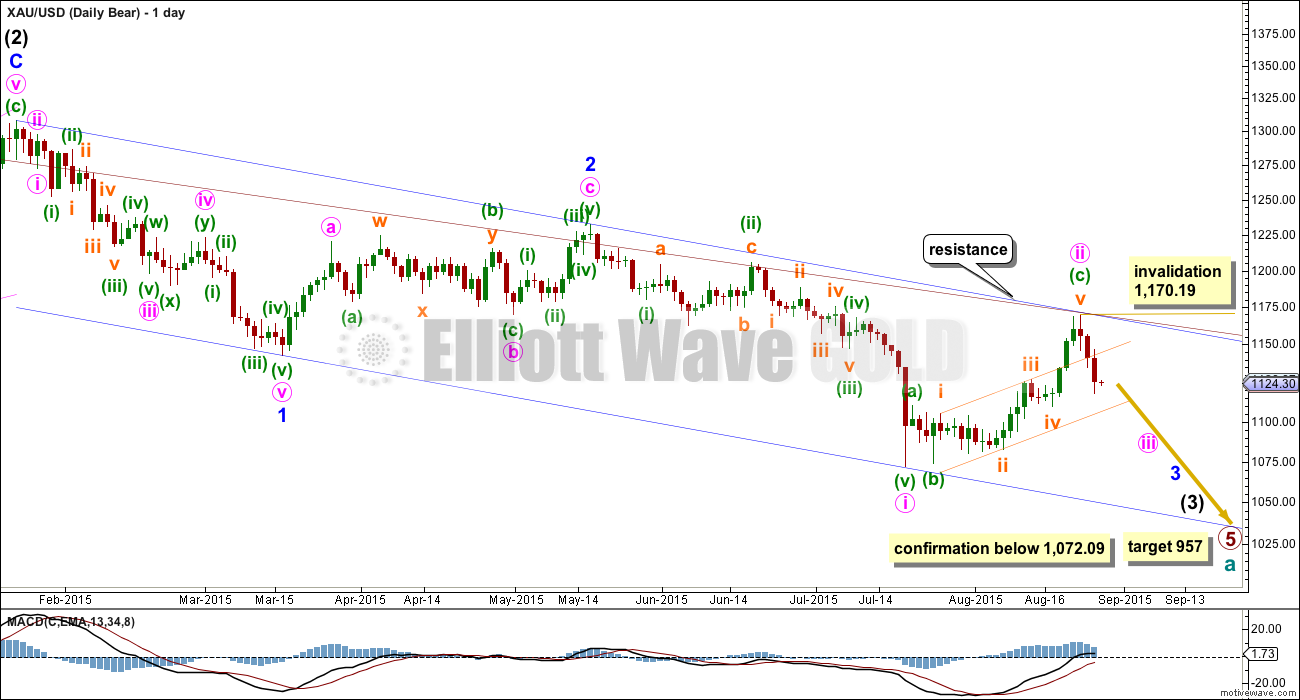
BEAR ELLIOTT WAVE COUNT
Click chart to enlarge.
At this stage, the reduction of probability for the bull wave count sees this bear wave count about even now in probability.
This wave count now sees a series of three overlapping first and second waves: intermediate waves (1) and (2), minor waves 1 and 2, and now minute waves i and ii. Minute wave iii should show a strong increase in downwards momentum beyond that seen for minute wave i. Before that comes though, we may yet have another second wave correction and if it unfolds before price makes a new low below 1,072.09, then we may not have clarity between these two wave counts for some time yet.
The blue channel is drawn in the same way on both wave counts. The upper edge will be critical. Both wave counts expect some downwards movement from here to bounce down from resistance about the upper blue trend line. Here the blue channel is a base channel drawn about minor waves 1 and 2. A lower degree second wave correction for minute wave ii should not breach a base channel drawn about a first and second wave one or more degrees higher. If this blue line is breached by one full daily candlestick above it and not touching it, then this wave count will substantially reduce in probability.
With the base channel providing strong resistance and price now moving strongly lower, I will move the invalidation point down. Within minute wave iii, no second wave correction may move beyond the start of its first wave above 1,170.19. A breach of that price point should see this wave count discarded as it would also now necessitate a clear breach of the blue channel and the maroon channel from the weekly chart.
Full and final confirmation of this wave count would come with a new low below 1,072.09.
If primary wave 5 reaches equality with primary wave 1, then it would end at 957. With three big overlapping first and second waves, now this target may not be low enough.
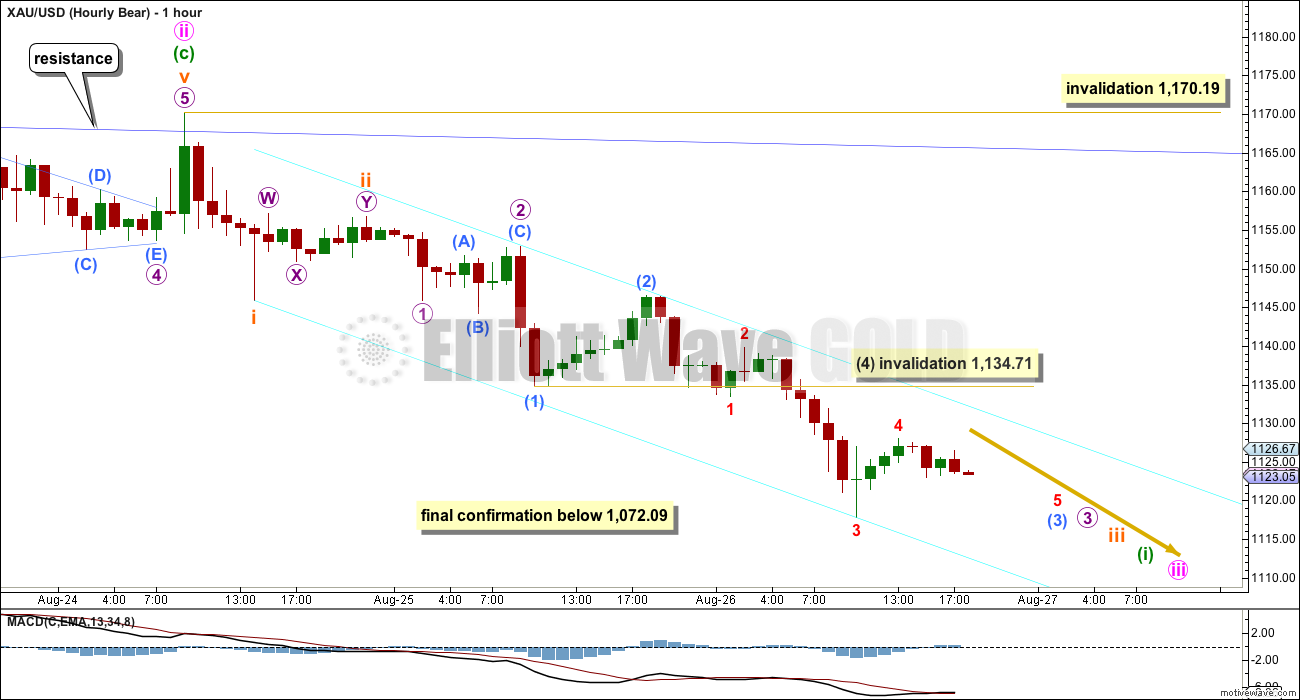
Click chart to enlarge.
This wave count expects an impulse to be beginning downwards. An impulse subdivides 5-3-5-3-5. So far the first 5 down is incomplete.
The beginning of an impulse and the whole of a zigzag have exactly the same subdivisions. There is no divergence between the labelling of the subdivisions at the hourly chart level (apart from the degree here being one lower) between bull and bear wave counts. The expectation of how downwards movement will unfold for the next few days will be the same.
When the first five down is complete, then the following second wave correction may not move beyond the start above 1,170.19. The rule for a second wave is the same as the rule for a B wave within a zigzag. There is no divergence between invalidation points either.
TECHNICAL ANALYSIS
Click chart to enlarge. Chart courtesy of StockCharts.com.
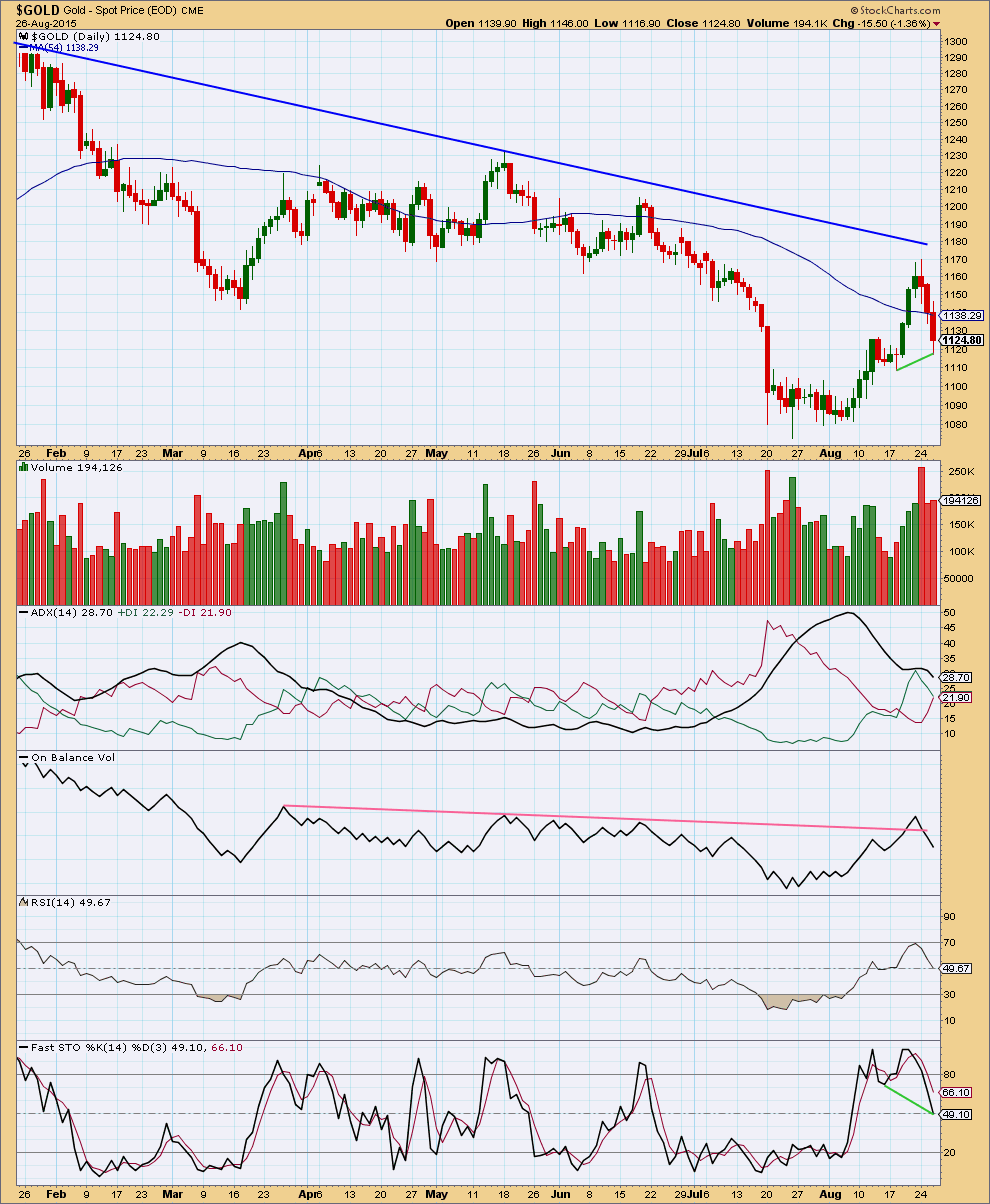
Wednesday’s downwards day comes on slightly increased volume. The strongest volume day for recent movement is the spike for 24th of August at 255,624, a downwards day. This favours the bear wave count, especially as this fall in price is so far supported by rising volume.
On Balance Volume today also favours the bear wave count. The breach of the trend line on OBV is bearish.
ADX indicates there is as yet no clear trend to the market, with the black ADX line pointing lower. ADX does tend to be a lagging indicator.
There is still hidden bullish divergence between price and Stochastics: price has made higher lows so far while Stochastics is making lower lows. This indicates price has strength, which is normal for a correction within a bull market. This piece of information supports a bull wave count, which is in opposition today to volume which supports a bear wave count.
Overall, today, volume favours a bear wave count. Volume is a stronger indicator than an oscillator. But the strongest and simplest of analysis tools are trend lines. With the blue trend line on the TA chart and the EW charts still holding that gives the market a bearish bias.
This analysis is published about 08:37 p.m. EST.
Gold looks potentially bullish short term to me right here. I”m going to send a few long probes out there and see what happens
On the hourly chart there’s no divergence yet with price and MACD.
At the end of a movement there usually is some divergence, at least a little.
This doesn’t always work, but almost always.
Yes I like to use RSI for that. That’s also not quite there yet but perhaps a little more interesting. But there were a number of other factors as well
No US Oil trade today. Let Oil go up and reverse .
I agree. The correction upwards could be a second wave at intermediate degree. Second waves must have three subwaves. It is still in its infancy stage. Moreover, intermediate degree waves take a longer time to play out.
Thanks
If oil moves much higher Lara will likely update charts which will provide some context. Entry at top of this correction could provide very nice 6 month buy and hold short opportunity for mid-term investors such as myself who are not masters of short-term EW waves.
DUST is dropping like a rock today from $33.77 high to 27.61 low a few minutes ago down 17% today
Miners are bullish today.
Miners are traded as stocks. And the stock market is having a dead cat bounce, although I feel that the magnitude of this bounce is rather large. (Maybe the dead cat has been given helium instead of oxygen to try to revive it?) A rising tide pulls up all ships, and so miners rise substantially, which means that DUST fell much more than has been expected.
Tham, do you believe SP 500 bounce is complete after move up today?
It is quite possible that S&P could have topped at 1989.60 just now. The other possibility is that it would top at 2013 in which Minute 4 is 0.618 of the third wave. At 1989.60, it is a 0.50 retrace. We might have to wait to see which is right. Fourth waves are quite difficult to analyse.
Interesting, thanks.
Lara,
I am sure that I am speaking for a majority of your subscribers when I ask do you have any rough expectations of when the first substantial (2nd wave) correction may occur for the bear count? I know that you can’t necessarily offer any hard numbers just yet, and I don’t expect you to guess the bottom, but any light that you could shed on this would certainly be much appreciated. I personally have difficulty knowing what to make of something like 3-4, 3-4, 3-4, 5. My guess is that this is the number one question amongst your subscribers at this point in time.
Thanks!
I would expect it to begin before we get a new low below 1,072.
And I would expect it to maybe again come up to touch that blue trend line on the daily chart.
Gold price is having an inside day so far and appears to be meandering in range 1129-1118 with 1125-26 currently resistive; what to expect now?….
I’m looking for the expected gold high from now until close to buy DUST for the rest of the gold drop in the next few days to a possible bull lower target of 1,105 – 1091.
1,129.39 at 6:06 am was the high since the Wednesday close
– 1,118.33 at 9:55 am was the low since the Wednesday close
= 11.06
x .618
=6.83
+ 1,118.33
= 1,125.16 possible retrace target gold high today.
Buy DUST and hold until Tham’s targets of $36 or 38 or with extension 39.29
or until gold at Lara’s bull target gold low of 1,105 – 1,091.
I’m interested in any feedback or corrections, thank you.
Hi Richard. If you use the gold price as a reference for DUST movement, then gold has not reached micro 3 yet. Lara had submicro 3 at 1117.80. Submicro 4 ought to be at today’s high of 1129.39, and now submicro 5 / micro 3 is so slow to complete. Actually, I am waiting for micro 4 to complete before loading up on DUST. At the moment, you could buy some but the gains may be quite small.
Tham, please give us a post when you go for DUST.
Hi Davey. Will do.
I am waiting for micro 4 in gold to take advantage of the fall to micro 5 for a buy in DUST.
At the present moment, it is possible to buy DUST for some gains as gold is trying to complete micro 3. As I explained to Richard, this down move is quite puzzling. If Lara is correct in her wave count, then I can see submicro 5 is going to be fairly large if it is an impulse. It looks like there are only 2 subwaves (out of 5) completed. If so, I am quite tempted to put in a small position now. I can’t work on DUST wave count to smaller degrees as I could not find a good live chart (something like pmbull for gold price). I am using daily chart from stockcharts.com, so the bigger picture is quite alright but not the smaller degree waves. Intra-day I still depend on gold movement.
Tham, you are Dust Divinator, however you work your skills are better than mine so I always appreciate your comments.
I spent some time on the five minute chart today Alan.
I’m seeing (for the bull count at the hourly chart) submicro (4) as already over, micro 3 has a curved look to it. There are a bunch of quick fourth waves at the end of it.
So the sideways movement for this session is now labelled one degree higher, micro, for the bull and submicro for the bear.
Still need more movement lower though.
Based on my momentum indicators I bought NUGT yesterday. DUST is not a buy yet???
It would be if gold submicro 5 is an impulse, but not so lucrative if it is an ED. It just depends on how much gains you want.
Hi all, any thoughts on Crud Oil? How high will this correction be?Happy for all thoughts what to expect is here.
Thanks
I am interested in US oil too. Once my indicators tells me then I will buy DWTI/SCO,
Papudi, I like oil shorts, have been waiting, waiting, waiting for a bounce up to enter. Nice 7% move up today. Do you believe this is good entry point?
It is is in buying range here. I will wait for close. Small amount only.
My short was stopped out for a small profit. It didn’t “stick” but I have no loss, so that’s okay.
Looking at the structure on the hourly chart I don’t think this correction is done yet.
Will update Oil in the next couple of days. And I’ll be looking to enter another short when this correction is done. But I’m not going to pick the high, I’ll figure out a channel about it and wait for the channel to be breached. Then I’ll wait for a throwback and enter short there.
Lara, thanks for comments, I like your approach to entry.
It’s a much safer technique than trying to pick highs and lows.
I don’t like unnecessary losses in my account. I’m naturally extremely cautions and I exercise patience when trading.
I also don’t get emotional about it. At least, that’s my goal 🙂
Morning Tham , If you are out there, do you have a count for DUST?
Good morning Robert.
I have reverted back to my bull count, presupposing that gold is in a bear market. Currently, gold is trying to complete micro 3 and rise slightly after that before resuming its downtrend. So, DUST is consolidating, and would drop slightly before resuming its upward movement. My targets, corresponding to gold’s immediate stages of down moves are very close to 36.00 and 38.00 (with a possible extension to 39.29) respectively.
Thanks Tham, I was looking for an entry point, however I just bought at $29.88
Hope I didn’t jump the gun.
That should be a good entry.
Hopefully, you took profit at 31+. That’s a good 2+ dollar gain.
No, I bailed with a small loss early. Glad I got that out of my system. I new I was due for a loss.
Lara, So you’re making minor 1 into a zig-zag instead of a leading diagonal because it is uncommon to have a leading diagonal in a wave one.. But instead we are creating a larger leading diagonal that will still remain in a first position??
In other words… A leading diagonal in minor 1 is rare/wrong, yet a leading diagonal in intermediate 1 is acceptable?? I don’t get it??
In any case, I only have one count now.. And it’s down..
I’ll take a shot but anyone can correct me – i believe she is seeing the movement up from the spike low as a zigzag. it’s either a corrective wave 2, or the first wave up in a leading diagonal. It cannot be seen itself as a leading diagonal, and so those are the only two choices.
Thanks Eli, that’s right.
I’m making minor wave 1 a zigzag within a leading diagonal for intermediate (1).
But because the first five up of a potential new bull market must be starting with a leading diagonal in a first wave position, that reduces the probability of the bull wave count to close to even with the bear now.
testing testing testing…
Pullback is pretty much on the cards…. Gold price is currently finding resistance at pivot 1129.66 with upside risk 1137-43 though upside limitations apply… Will look for a break below 1119 and then 20dma 1117-16….