
Price has moved higher.
Summary: Short term both wave counts expect this upwards movement is a small correction against a downwards trend, which may end on Monday about 1,148 – 1,150. Thereafter, for a few days price should move lower. The bull count expects the next wave down to end about 1,105 – 1,091 and to not move below 1,072.09. The bear wave count would then expect an explosive third wave down to make a new low below 1,072.09.
Changes to last analysis are bold.
To see weekly charts and the three different options for cycle wave b (main wave count) click here.
BULL WAVE COUNT – DAILY
Click chart to enlarge.
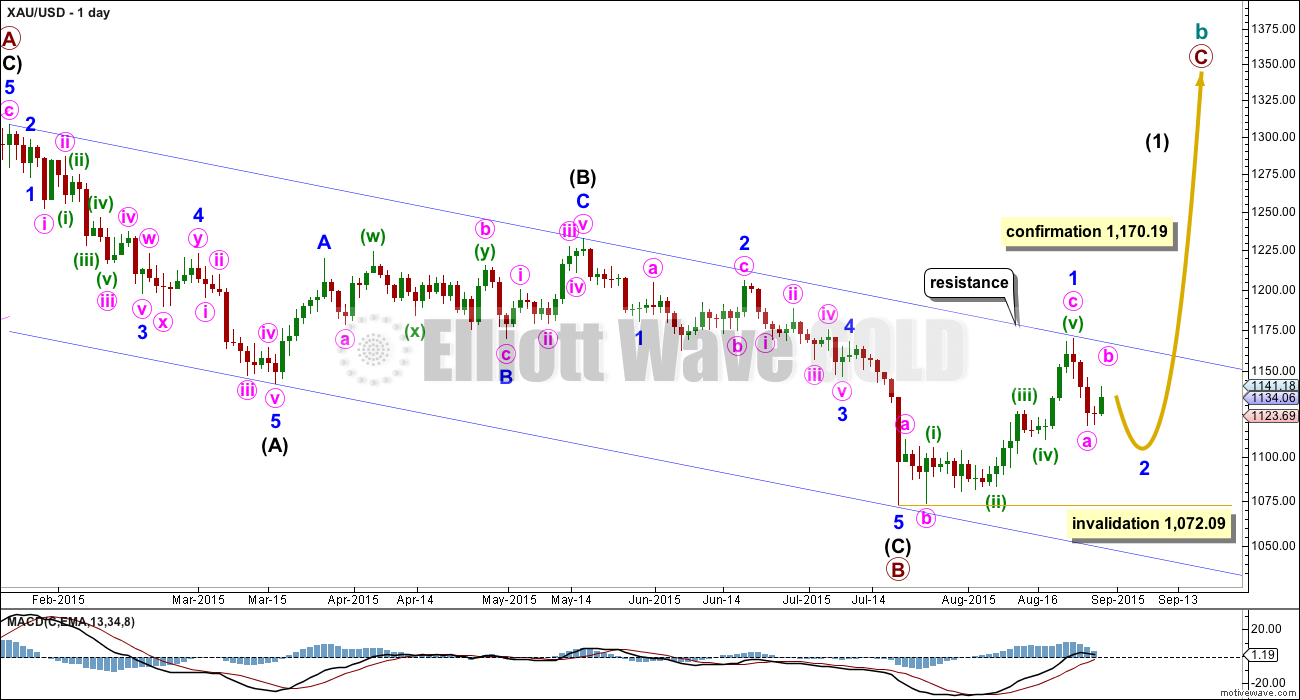
The bigger picture at super cycle degree is still bearish. A large zigzag is unfolding downwards. Along the way down, within the zigzag, cycle wave b must unfold as a corrective structure.
At this stage, there are three possible structures for cycle wave b: an expanded flat, a running triangle, or a combination.
This daily chart works for all three ideas at the weekly chart level.
For all three ideas, a five up should unfold at the daily chart level. This is so far incomplete. With the first wave up being a complete zigzag the only structure left now for intermediate wave (1) would be a leading diagonal. While leading diagonals are not rare they are not very common either. This reduces the probability of this bull wave count now to about even with the bear wave count.
A leading diagonal requires the second and fourth waves to subdivide as zigzags. The first, third and fifth waves are most commonly zigzags, the but sometimes may appear to be impulses. So far minor wave 1 fits well as a zigzag.
The common depth of second and fourth waves within diagonals is between 0.66 to 0.81 the prior wave. This gives a target range for minor wave 2 from 1,105 to 1,091.
Minor wave 2 may not move beyond the start of minor wave 1 below 1,072.09. If this invalidation point is breached, then it would be very difficult to see how primary wave B could continue yet lower. It would still be technically possible that primary wave B could be continuing as a double zigzag, but it is already 1.88 times the length of primary wave A (longer than the maximum common length of 1.38 times), so if it were to continue to be even deeper, then that idea has a very low probability. If 1,072.09 is breached, then I may cease to publish any bullish wave count because it would be fairly clear that Gold would be in a bear market for cycle wave a to complete.
To the upside, a new high above 1,170.19 would invalidate the bear wave count below and provide strong confirmation for this bull wave count.
Upwards movement is finding resistance at the upper edge of the blue channel and may continue to do so. Use that trend line for resistance, and if it is breached, then expect a throwback to find support there.
At this time, one reason why I will retain this bull wave count is my expectations for the stock markets. My S&P500 analysis is expecting a primary or super cycle degree bear market which is in its early stages, and this expectation may turn out, at least in the beginning, with a corresponding rise in the price of Gold.
Click chart to enlarge.
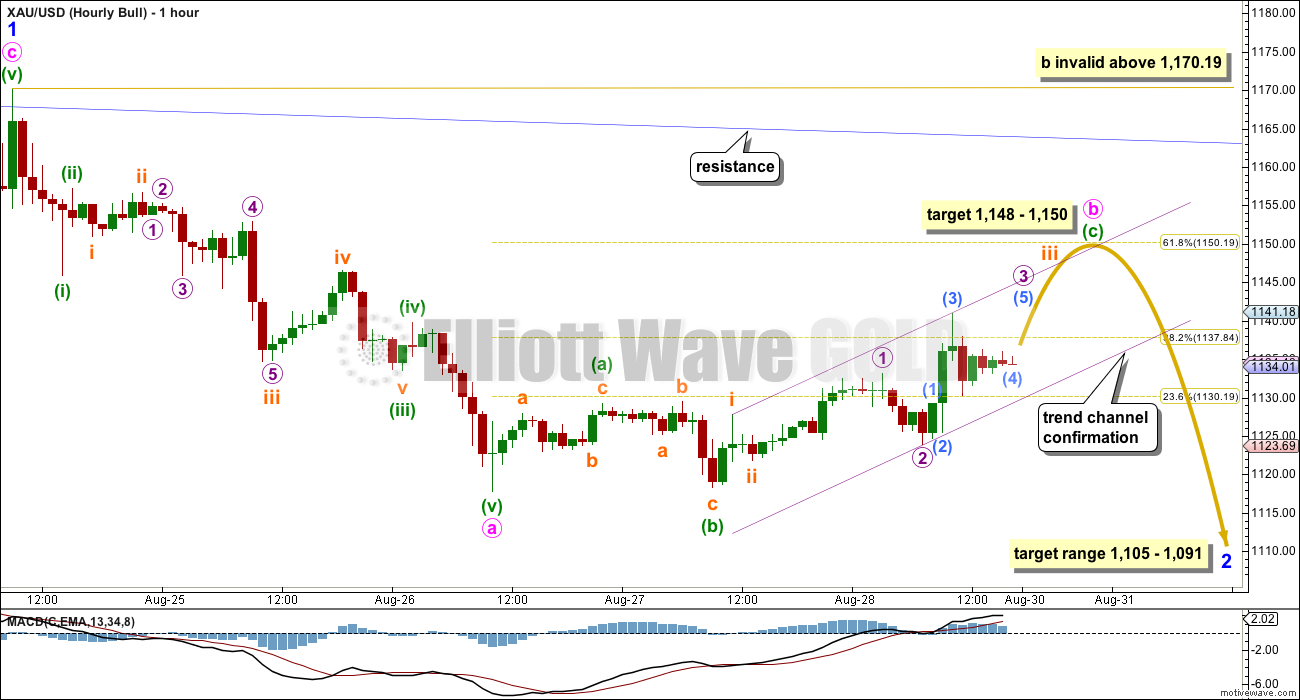
Minor wave 2 should unfold as a zigzag. Zigzags subdivide 5-3-5. So far the first 5 down is complete.
Friday’s upwards movement is showing up on the daily chart, so this is most likely minute wave b. Minute wave b may be unfolding as a flat correction.
Minute wave a will subdivide as a completed five wave structure. Ratios within it are: minuette wave (iii) is 0.66 short of equality with minuette wave (i), and minuette wave (v) is 1.74 short of equality with minuette wave (iii).
Minute wave b may be a flat correction as labelled, but it is also possible to see it as a zigzag with minuette wave (a) ending earlier. Either way, the structure is incomplete.
If minuette wave (a) ends at the point labelled here, then at 1,148 minuette wave (c) would reach 2.618 the length of minuette wave (a). This is close to the 0.618 Fibonacci ratio of minute wave a at 1,150, giving a $2 target zone for this upwards movement to end.
Use the small best fit channel about minuette wave (c) as an indicator of when this upwards correction is over. When that trend line is breached by downwards movement, then that should be the early stage of the next wave down.
Minute wave b within a zigzag may not move beyond the start of minute wave a above 1,170.19.
BEAR ELLIOTT WAVE COUNT
Click chart to enlarge.
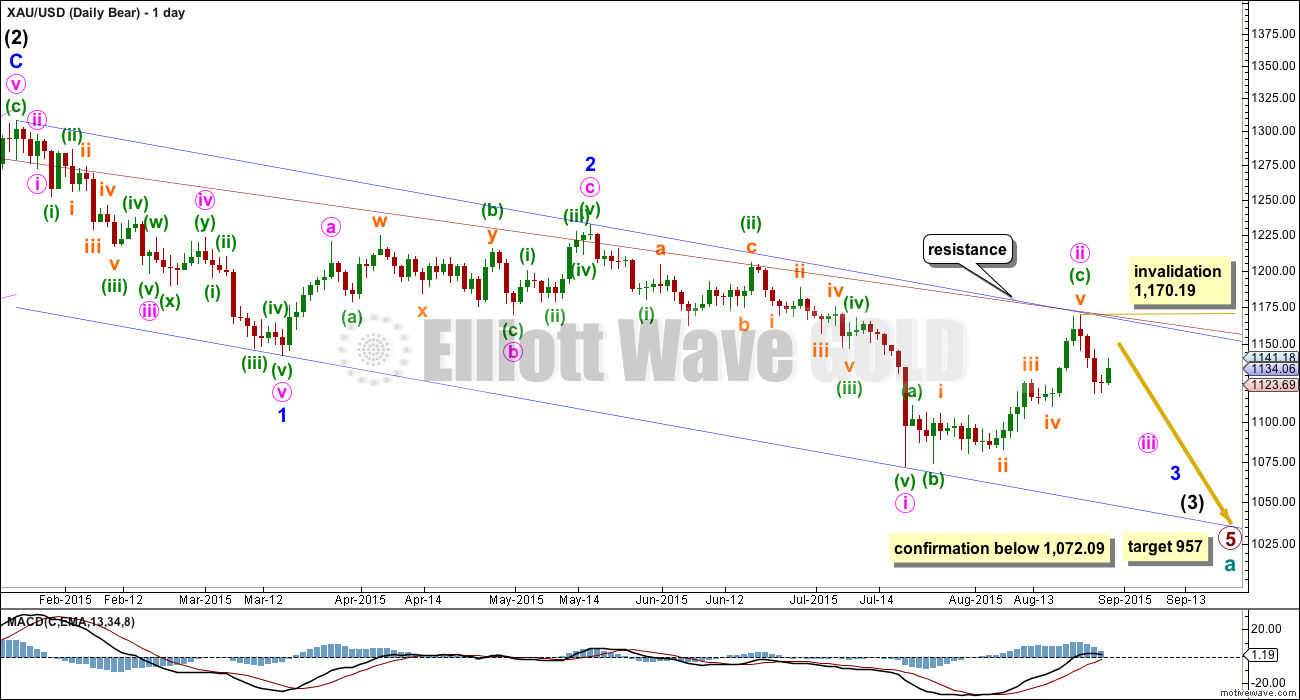
At this stage, the reduction of probability for the bull wave count sees this bear wave count about even now in probability.
This wave count now sees a series of three overlapping first and second waves: intermediate waves (1) and (2), minor waves 1 and 2, and now minute waves i and ii. Minute wave iii should show a strong increase in downwards momentum beyond that seen for minute wave i. Today there is another second wave correction unfolding for minuette wave (ii). If the correction moves higher, then it should find very strong resistance at the blue trend line. If that line is breached, then a bear wave count should be discarded.
The blue channel is drawn in the same way on both wave counts. The upper edge will be critical. Both wave counts expect some downwards movement from here to bounce down from resistance about the upper blue trend line. Here the blue channel is a base channel drawn about minor waves 1 and 2. A lower degree second wave correction for minute wave ii should not breach a base channel drawn about a first and second wave one or more degrees higher. If this blue line is breached by one full daily candlestick above it and not touching it, then this wave count will substantially reduce in probability.
Within minute wave iii, no second wave correction may move beyond the start of its first wave above 1,170.19. A breach of that price point should see this wave count discarded as it would also now necessitate a clear breach of the blue channel and the maroon channel from the weekly chart.
Full and final confirmation of this wave count would come with a new low below 1,072.09.
If primary wave 5 reaches equality with primary wave 1, then it would end at 957. With three big overlapping first and second waves, now this target may not be low enough.
Click chart to enlarge.
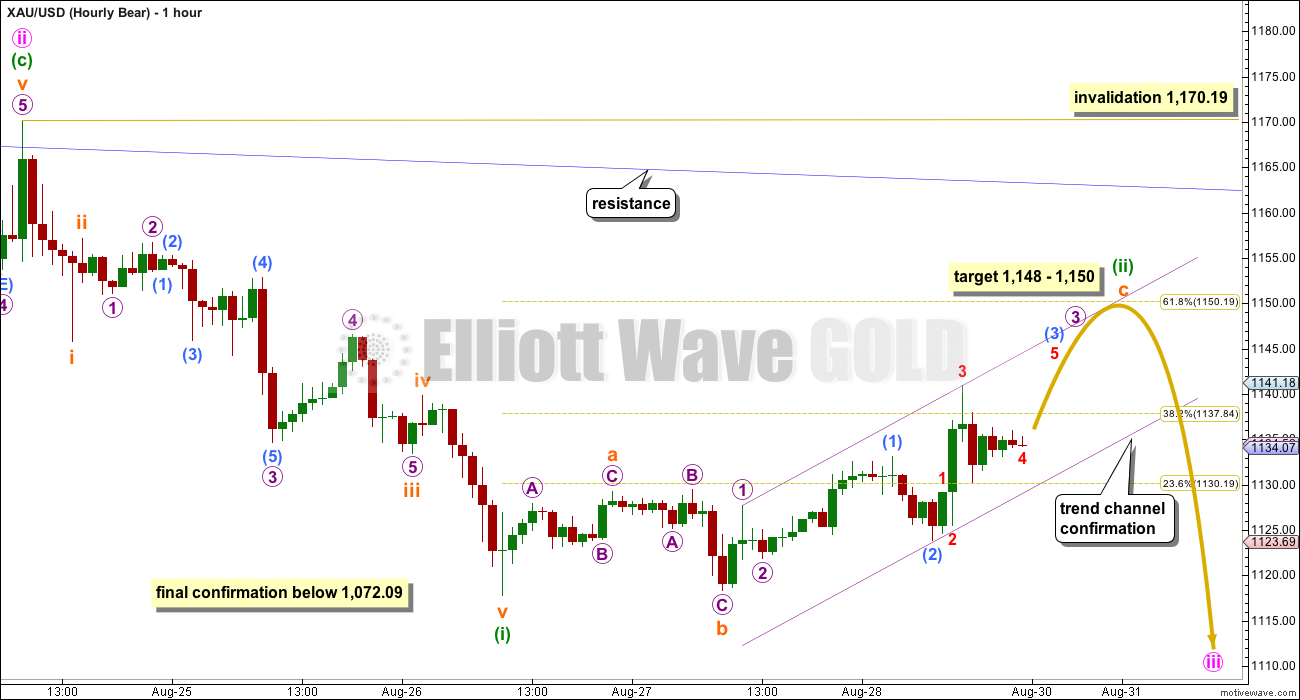
This wave count expects an impulse to be beginning downwards. An impulse subdivides 5-3-5-3-5. So far the first 5 down is complete.
The beginning of an impulse and the whole of a zigzag have exactly the same subdivisions. There is no divergence between the labelling of the subdivisions at the hourly chart level (apart from the degree here being one lower) between bull and bear wave counts. The expectation of how downwards movement will unfold for the next few days will be the same.
Minuette wave (ii) may not move beyond the start of minuette wave (i) above 1,170.19. The rule for a second wave is the same as the rule for a B wave within a zigzag. There is no divergence between invalidation points either.
TECHNICAL ANALYSIS
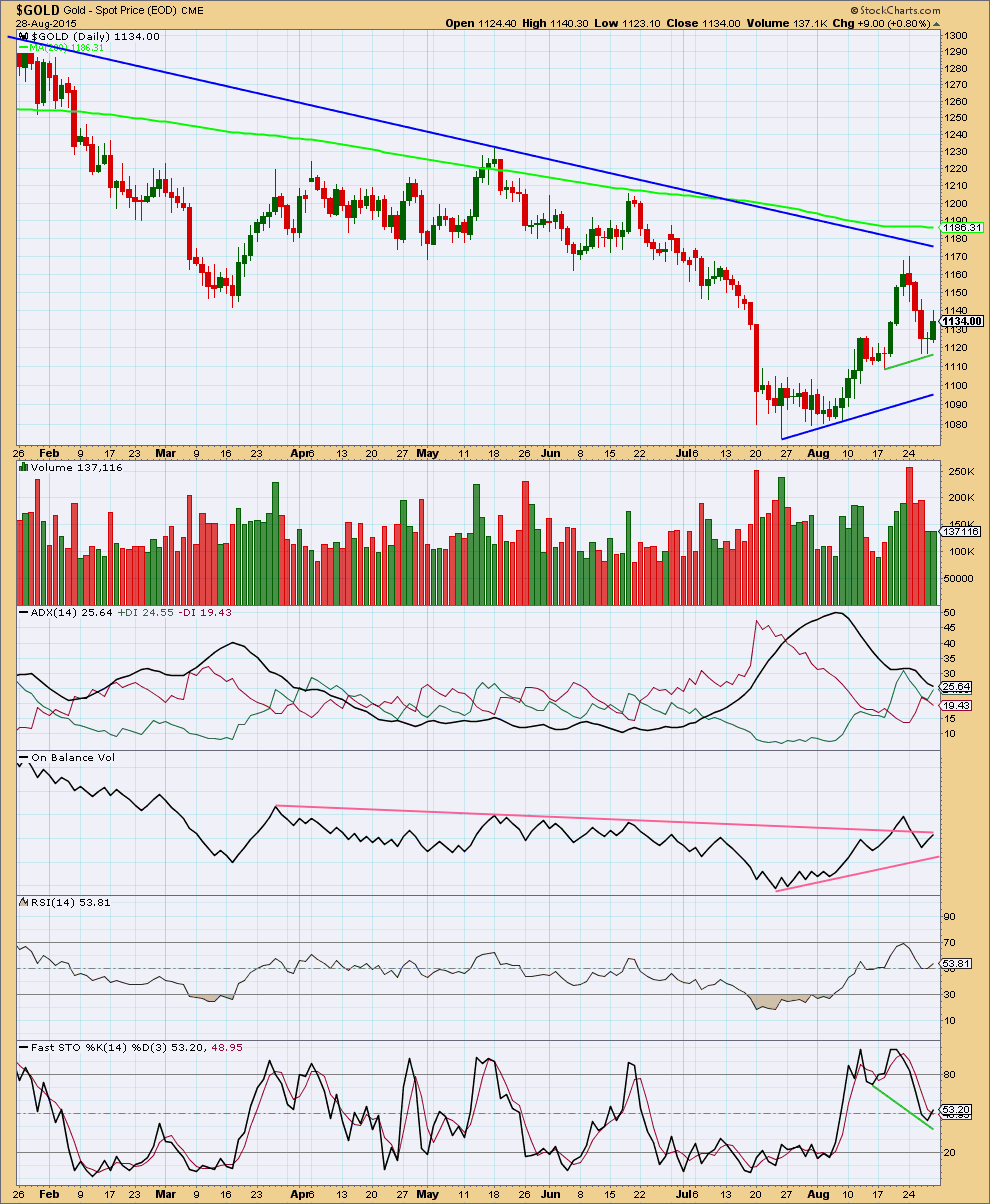
Click chart to enlarge. Chart courtesy of StockCharts.com.
The regular technical analysis picture is unclear.
Price has remained below the 200 day SMA since 6th February this year. A break above that line would be very bullish. With price below it and the average pointing down the larger picture looks bearish.
Today the upwards move in price is not well supported by volume. Volume, importantly, remains well below prior downwards days suggesting today’s rise in price is a small correction within a trend which is down at least in the short term. This supports both Elliott wave counts which see this upwards movement as a small correction.
During the prior upwards movement, the rise in price was clearly supported by a rise in volume culminating in a volume spike at the end. This looks bullish.
Overall the strongest volume day comes on a downwards day which supports the idea of a downwards trend, but that day was also a volume spike for the end of a movement, so it is not definitive either.
ADX is clear and tells us there is no trend and the market is range bound. A range bound system would be better employed than a trend following system. Resistance is being provided by the upper blue trend line, a potential support line has been drawn also in blue. Downwards movement would be expected to continue for this approach until Stochastics reaches oversold and price reaches support at the same time. Range bound markets should be avoided by all except the most experienced traders because they offer greater risk of losses. Trading a range bound market must be done with good money management and stops should always be used.
On Balance Volume is still overall bearish. While price is moving lower OBV also moves lower supporting the fall in price. The breach of the upper pink trend line on OBV is also bearish. I have added another trend line to OBV today which may provide some support. If that too is breached, then OBV would be again providing bearish indication. Today OBV has come to again touch the upper trend line. This trend line has been breached before and OBV returned below it, so it is no longer highly technically significant. It may provide some resistance again here.
There is still hidden positive divergence with Stochastics moving lower while price has not made new lows. This is a weak signal, but it is bullish.
At this time, because the picture is unclear from both the Elliott wave counts and regular technical analysis, the best approach would be to expect the market is currently range bound and to act accordingly. This means either stepping aside to wait until a clear trend emerges, or using a range bound system (like the one presented here with support / resistance and Stochastics). When traders insist on trading an unclear range bound market losses must be accepted as part of the risk, which must be carefully managed so that losses are minimized.
The strongest and simplest piece of technical analysis on this chart is the long blue downwards sloping trend line. This is replicated on the daily Elliott wave charts (it’s slightly different because the scales are slightly different). The larger picture is more bearish than bullish while the long blue downwards sloping trend line continues to provide resistance and price is below it. The bullish Elliott wave count must see price break above that line before full confidence may be had in it.
This analysis is published about 05:29 p.m. EST.
My wave counts both expect Gold is still within a small B or second wave correction. It’s not done yet.
It may move sideways as a combination: flat – X (which may also be incomplete) – zigzag.
Or it may move sideways as a double flat, the second structure may be another flat.
Or it may move sideways as a triangle if the bull wave count is correct, and that could take a few days even. (second waves can’t be triangles).
Or it may be a single flat and the b wave within it may move lower before the c wave is ready to move higher.
So overall, there are several structural possibilities. The one thing I am expecting it is not is over. The downwards movement will not subdivide as either an impulse or a leading diagonal (the third wave within that possibility would be the shortest of 1, 3 and 5 so that’s invalid).
Without a five down it looks pretty clear this correction is continuing.
One or maybe two more days of choppy overlapping sideways movement is expected.
Thank you for your comments today Lara. They helped out.
Here’s my idea for a count. Looks like the W wave may have ended with an expanding diagonal. Target for the Y wave is the .618 retracement. Don’t think the channel breach from Fridays analysis was enough to confirm the downtrend this time.
I agree with this. The idea is similar to the one I described below. We’ll just wait for this count to be confirmed.
I think we are in the second (of five) wave of C / X now. The first wave ended right where it should, and that gives me some confidence in the count.
I agree with the general idea. My only problem is the very first move down from the high you have labelled W subdivides as a three, it’s a zigzag on the five minute chart.
I have it as a 5 too. My contention is that Minute B or Minuette 2 is a 5-3-5.
At the 6 minute mark in the video Lara explains when the upwards move to 1150 area would be over with at least 1 red candlestick breach below the pink hourly channel.
Gold has already breached the lower hourly channel by about 8 hours including 1 huge red candlestick this morning at 8 am from 1132 down to 1128 for a clear Trend channel confirmation down toward 1105 – 1091. I’m surprised this isn’t being noted here except by Papurdi and I. Unless some EW exception wave has happened then clearly the up wave towards 1150 is over. I’m surprised that 1150 target is still being mentioned instead of down to 1105 and lower.
Hi Richard: Cant say what wave count is in play but it clearly appears Gold price is finding support at 1133-31 poised to take out 1135-36 for 1138-40. A break below 1126-23 is required to see Gold price lower….
Hi Richard. I always trade on the premise that price is the final arbiter. Everything else is a mathematical model trying to fit price movement. As such, I have always been flexible and not dogmatic about what should be, but focus on what is.
I have staked my claim, rightly or wrongly. When I came to the conclusion I posted, I bought NUGT around 10 am at 3.00. I intend to ride it until the end of the third wave of C or end of day whichever comes first. Of course, if I’m wrong, I’ll quickly bail out.
Hi Tham, I assume it would be a day trade either way? never mind, I read it again!!
Hi Robert. It is now the third wave of C. I have 45 minutes to go. Most likely wouldn’t complete by then. But I’m not going to risk the Asian/European markets.
This is true Richard.
But the downwards movement is subdividing as threes and not looking very impulsive at all.
Today has moved price sideways, not lower. It looks like minute b (or minuette (ii) ) will keep moving sideways for another day before we get the next wave down.
I think the drop to 1125.80 has invalidated all the waves below Minute B in the bull count (and below Minuette 2 in the alternate).
Consider the bull count. (It doesn’t matter which count to use because all three counts have the same movement next. I just use the bull count so as to anchor the inflection points.) It is possible that we have completed Minuette A of Minute B at the high of 1140.97, and Minuette B at 1125.80. The current movement is to complete Minuette C, and hence Minute B, at the target of 1148-1150.
Any other views?
Alan, this morning is another weird gold situation.
Lara forecast gold to 1148-1150 however if gold goes below the hourly trend line at least 1 hour then we’re in the early stage of next wave down as per Lara forecast.
Gold has now breached lower trend line for 6 hours for a trend channel confirmation down so I see no reason to still have a 1148-1150 target.
There is no invalidation and unless gold is in some unexpected complex down pattern that still allows up to 1148-1150 then I’d expect gold to head down.
Right now I don’t know whether to buy GDX heading for 1148 target or DUST heading for new low below 1072 this week. Sitting on the fence due to gold and EW confusion.
It’s still in a small correction I think Richard. This should keep going sideways, It’s taking longer than originally expected.
Tham, everything is murky, your gold count seems reasonable.
Does your DUST count support or deny gold’s projected move? A nice DUST up this AM parallel with gold’s move down—do you expect we will see 10% drop in DUST when / if gold moves up to the 1150 target?
I would say much more than a 10% drop in DUST from here if gold hits 1150 area. DUST might be at $20 – 22, just a guess with gold at 1150.
Gold now 1135 DUST at 26.25 so could drop 20% or more at 1150 target
Richard, appreciate your insight.
Hi Davey. Sorry I did not reply earlier. I was trying to calculate SPX move. SPX had just had a death cross, and chances are that it will sink like the Titanic soon. Very good gains to be obtained if that happens.
I have DUST in a C wave down targeting 26.97 (already superseded) then 22.30.
Tham, thanks for comments on DUST.
Also like your comments on SPX–how do you play that, SPXS, TVIX, SPY options, other? So you believe SPX drop is imminent, that dead cat bounce is over?
Hi Davey. I’ll go for TVIX or UVXY when volatility is high. Otherwise, I’ll use SPXS as it is “safer”.
The picture is still not clear at the moment, too much consolidation. I’ll go in once a clearcut trend emerges.
Looks logical. If C=A, target would be about 1,148.40. Same as Lara’s original target.
‘Trend channel confirmation’ down has been confirmed with more than 1 full hour breach below the lower trend line , the pink channel on the hourly bull and bear chart. There has already been about a 6 hour breach now at 10:00 am.
“Use the small best fit channel about minuette wave (c) as an indicator of when this upwards correction is over. When that trend line is breached by downwards movement, then that should be the early stage of the next wave down.”
Sideways movement is overlapping. Does not appear to be the start of the next leg down yet.
Gold is not overlapping it has already breached the lower hourly channel by about 8 hours including 1 huge red candlestick this morning at 8 am from 1132 down to 1128 for a clear Trend channel confirmation down toward 1105 – 1091.
Gold price below the 23.6% of weekly H 1169.80/L 1116.90 (1129-30) and below 5ma/50dma… Not good enough, need to see a break below 1123…
Gold traded below the bear hour wave count trend channel at 1128.78.
It is confirmed that gold is in bear trend????? Is it?
Gold in subminute wave iii down.
Lara thanks for updating US oil EW chart .
You’re welcome.
Stock futures down sharply on China worries, Fed comments – Aug 31, 2015 1:23 a.m. ET
http://www.marketwatch.com/story/stock-futures-down-sharply-on-china-worries-fed-comments-2015-08-31
U.S. stock futures tumbled in early trade on Monday, partly due to comments that China’s government will no longer support the stock market via big purchases of stock.
Oil prices also fell with October crude futures CLV5, -1.42% down 62 cents, or 1.4%, to $44.60 a barrel.
US Oil weekly chart. A strong weekly close with huge Bullish engulfing candle, hammer. Plus has huge bullish divergence in weekly RSI and Price.
Side way to upward movement may ensue here. Hopefully the channel will provide resistance. If breaks to upside target may be 50 to 54 the next resistance.
Friday initiated short trade for short term only,
COT and Gold prices: Favoring Lara’s down EW wave so it appears. Commercial shorts increased significantly from previous week. In the past when ever shorts increased at the top gold has turned around.
Lara: Is it time for update on US Oil EW??? Or we wait another week for more movement of prices????
I planned on updating it this weekend. I may have a chart to publish tonight or tomorrow. So far I’ve been working on Silver.
Laura, will you be updating your EW analysis soon?
This analysis is updated five times a week, usually published just after NY closes.
Monday is not closed yet.
Retest of broken support looks complete. Bearish unless gold moves back above this line?
Chart courtesy of Matt Roberts on Stocktwits
Finally in US Oil short. Gold to Oil ratio dropped from all time high. As ratio consolidate hear there will be more opportunity to add to shorts. Specially once Lara’s oil update comes out.
Lara, an awesome weekend for a tutorial.
Maybe you could explain to us why a triangle is ok in a wave 4 position but not in a wave 2. I’ve been neck deep in Prechter’s book all day (its raining here) with no enlightenment. Seems they know the rule, but not the psychology behind it.
The psychology of triangles I think is that they are a pause before the final thrust (of the same degree).
They exist to pause, take up time and move price sideways.
If they’re a final pause before the last move then it makes sense that they’re in fourth waves (and B waves) and not second waves.
Ok that makes sense. Its like the confusion in a crowd when everybody is looking at everybody else and saying “What do you mean you’re following me, I’m following you!” Then the breakout is everybody going their own way, with the majority establishing the last leg before it all falls apart again.
Wave 2 must have everybody certain that they’re right, determined to head in their direction without regard for what others are doing, until obviously proven wrong. Then its everybody to the same side of the boat for wave 3.
Waves 2 and 4 are totally different beast
maybe
Thanks Lara
Lara, have you considered the Primary triangle as a B wave? There are some impressive Fib ratios in there if you change Primary 3 to Primary A. Make Primary C an Expanding Diagonal, 3 is longer than 1 so 4 has to be longer than 2, is that right?
Whoops Here’s the chart again
I can see a few problems with that wave count.
1. Intermediate (2) is labelled a very rare triple. But it’s a triple zigzag, which moves sideways. The purpose of second and third zigzags in a multiple zigzag is to deepen the correction because the first and second don’t move price deep enough. To achieve that purpose their X waves are normally shallow, and the whole thing has a clear slope against the trend, it does not move sideways. So while that part of the wave count doesn’t violate a rule technically, it makes no sense.
2. The middle of the third wave does not look at all like an impulse. It looks like you’re trying to fit that move down from the end of intermediate (2) into 3-4-5 where it would best be seen as one impulse for the whole thing.
3. Intermediate (4) is grossly disproportionate to (2), and it’s a zigzag. There’s inadequate alternation in structure. The proportions make that five you have labelled look too strongly as a three. I know Gold has third waves which look curved, but that level of gross disproportion at the monthly chart level doesn’t look right for Gold. At the monthly chart level Gold normally looks textbook perfect, or close to it.
4. Within the ending diagonal of primary 5, intermediate (2), check the subdivisions of that possible double zigzag carefully on the daily chart. I’m pretty sure you’ll find it doesn’t work. It must be a five, it can’t be a three.
Wow, Ok, I’ll try to work up some arguments in the “For” case in the morning, I still need to think about our discussion concerning triangles. A B wave triangle does not exhibit the same behaviour as a wave 4 triangle. Yes? Otherwise Primary 5 would be done and dusted.
But at this scale, I haven’t broken any rules, have I? Just the weight of probability against me.
Have a look at the fib ratios into and out of the triangle, that’s what attracting me to this count. Dataset is located at http://stooq.com/q/d/?s=xauusd , daily from 1969.
Oh, BTW, has anybody told you that you’re the best of the best today?
It’s not a comment on you personally, it’s just a comment on what I can see that is not the best fit for that wave count.
If you can’t make the zigzag for intermediate (2) work then yes, a rule regarding how the wave must subdivide would be broken.
The idea is to find a wave count which meets all the rules, has normal looking structures and meets as many guidelines as possible. Such a wave count should have a good probability. Other ideas can be developed, and ranked in order of probability based upon Fibonacci ratios, the “right look” and how many guidelines are met or not met.
And thank you, yes, now someone has 🙂
Reading this comment from Lara above, made me want to go back and take a look at the last SPX and gold top. Lara states “At this time, one reason why I will retain this bull wave count is my expectations for the stock markets. My S&P500 analysis is expecting a primary or super cycle degree bear market which is in its early stages, and this expectation may turn out, at least in the beginning, with a corresponding rise in the price of Gold”.
The attached chart is a 2 year timeframe comparison of GLD and SPX from 7/1/2007 to 7/1/2009. As you can see, SPX topped 5 months before GLD and GDX. Then at the lows, GLD and GDX bottomed about 4.5 months before SPX.
If SPX is now starting a bear market, can we expect the same? In other words, will gold continue up for a few months before turning down?
I don’t think we can make the same comparison, since this time, gold has been in a long term downtrend (bear), while SPX has been going up the last few years.
Does this provide any relevance or clue to gold’s next big move? Thoughts?
It’s just not a reliable relationship is it.
While the evidence you provide here says it’s unreliable, it’s “common knowledge” (to some degree at least) that during a bear market for equities money floods into the safe haven of Gold.
It seems that common knowledge may be…. common but not knowledge. An incorrect assumption.
This was an expensive common knowledge I learned was wrong back in 2008-2009 crash. I knew market is going to crash and invested in gold. Thinking gold will be a safe heaven will go up. It went down so fast I lost big.
Should have atleast diversify 50-59 short GM and long gold.
This time it is not going to be any different. Both sectors are going down fast.
COT – Commercial shorts increased by 23,285
Crazy Guy -Oscar Carboni
OMNI
Weekend amusement ???? LOL with some investment trading idea.
https://www.youtube.com/user/futuresanalysts
I really dislike that guy…he’s a clown that really isn’t all that accurate…also, he’s not very professional if you disagree with his methods. One thing he’s good at is patting himself on the back. Bleh…
Don’t be too hard on the guy, he said a bottom was in on the market when Many Elliott wave analysts were still expecting a 3rd wave crash. He was correct while they were shorting one of the biggest bull runs in history.