
A small correction is unfolding sideways.
The correction was expected to end Monday about 1,148 – 1,150, but it is not unfolding exactly as expected.
Summary: Both wave counts expect this correction is not yet over and should keep going sideways for another day, or possibly two or three days. When this correction is done, then downwards movement should resume this week.
Changes to last analysis are bold.
To see weekly charts and the three different options for cycle wave b (main wave count) click here.
BULL WAVE COUNT – DAILY
Click chart to enlarge.
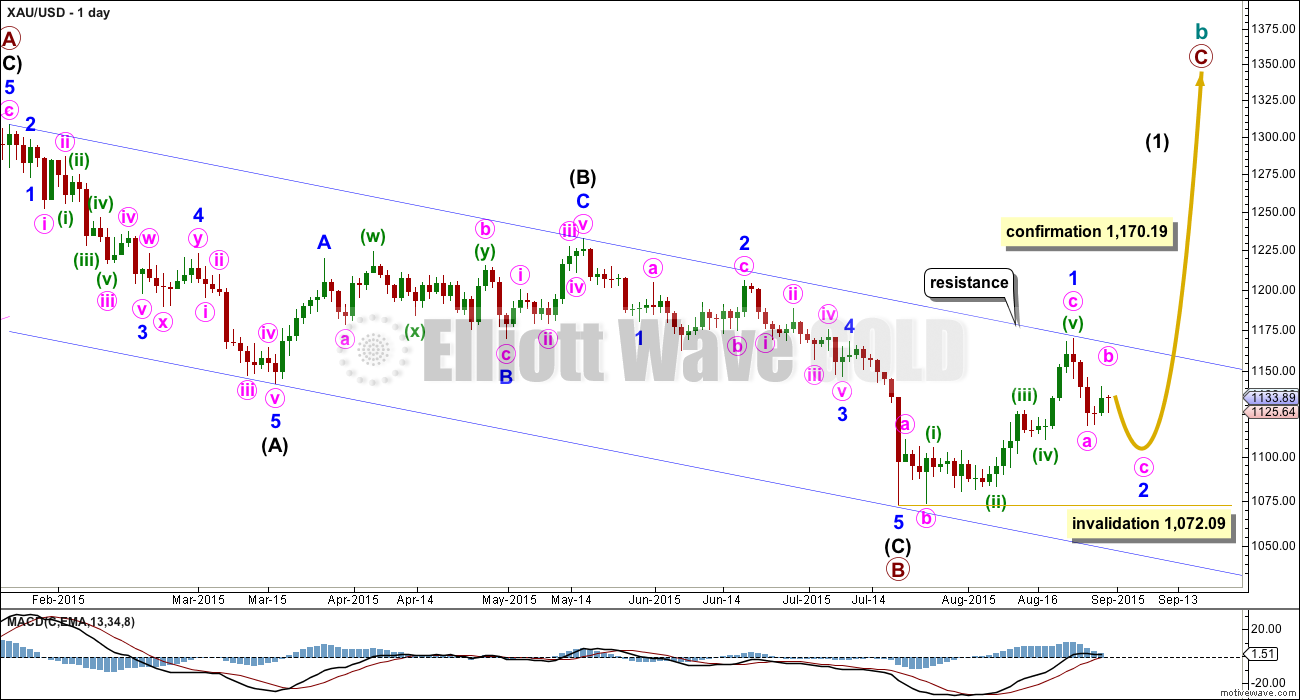
The bigger picture at super cycle degree is still bearish. A large zigzag is unfolding downwards. Along the way down, within the zigzag, cycle wave b must unfold as a corrective structure.
At this stage, there are three possible structures for cycle wave b: an expanded flat, a running triangle, or a combination.
This daily chart works for all three ideas at the weekly chart level.
For all three ideas, a five up should unfold at the daily chart level. This is so far incomplete. With the first wave up being a complete zigzag the only structure left now for intermediate wave (1) would be a leading diagonal. While leading diagonals are not rare they are not very common either. This reduces the probability of this bull wave count now to about even with the bear wave count.
A leading diagonal requires the second and fourth waves to subdivide as zigzags. The first, third and fifth waves are most commonly zigzags, the but sometimes may appear to be impulses. So far minor wave 1 fits well as a zigzag.
The common depth of second and fourth waves within diagonals is between 0.66 to 0.81 the prior wave. This gives a target range for minor wave 2 from 1,105 to 1,091.
Minor wave 2 may not move beyond the start of minor wave 1 below 1,072.09. If this invalidation point is breached, then it would be very difficult to see how primary wave B could continue yet lower. It would still be technically possible that primary wave B could be continuing as a double zigzag, but it is already 1.88 times the length of primary wave A (longer than the maximum common length of 1.38 times), so if it were to continue to be even deeper, then that idea has a very low probability. If 1,072.09 is breached, then I may cease to publish any bullish wave count because it would be fairly clear that Gold would be in a bear market for cycle wave a to complete.
To the upside, a new high above 1,170.19 would invalidate the bear wave count below and provide strong confirmation for this bull wave count.
Upwards movement is finding resistance at the upper edge of the blue channel and may continue to do so. Use that trend line for resistance, and if it is breached, then expect a throwback to find support there.
Click chart to enlarge.
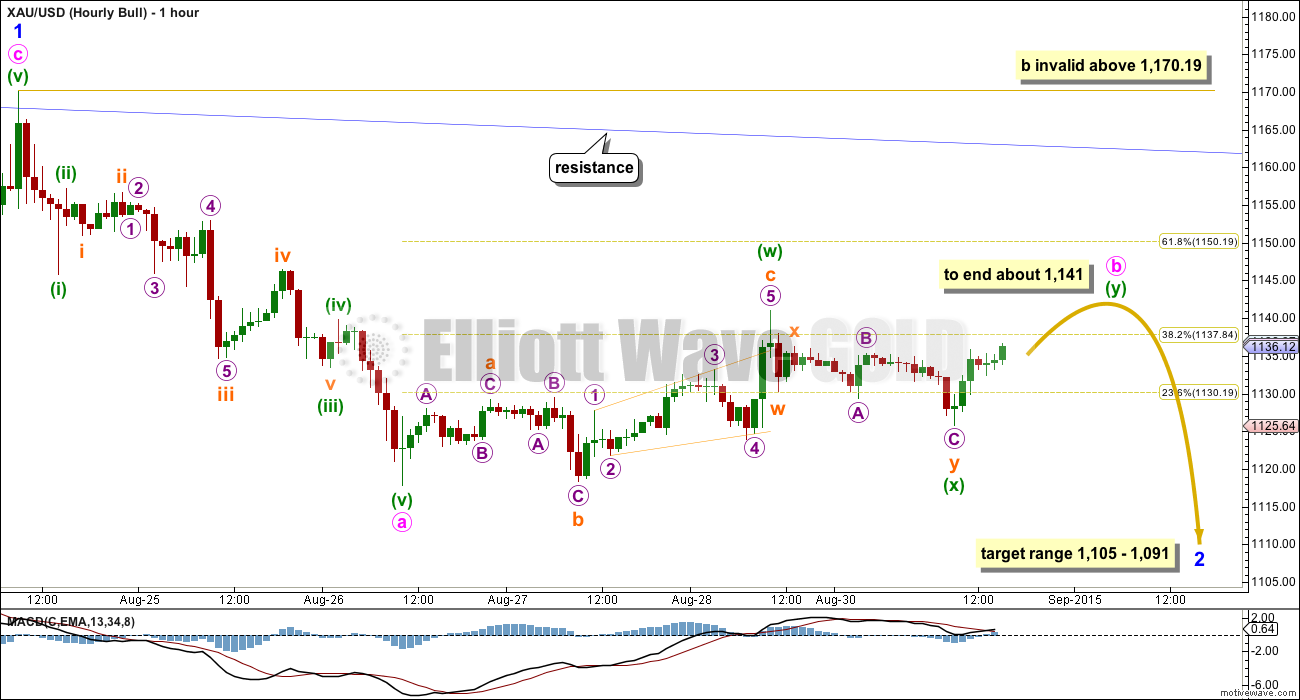
There are still multiple structural possibilities for this sideways correction. I will present two at the hourly chart level. All ideas work in the same way for both wave counts, with the exception of a triangle not being a possibility for this bull wave count because second waves may not unfold with a triangle as the sole structure.
The idea presented here works in exactly the same way for the bear count at the hourly chart level.
This correction may be unfolding as a combination or double flat: flat – X – second structure. (The second structure to be either a zigzag, triangle or flat correction.)
The purpose of combinations and double flats is to take up time and move price sideways. To achieve this purpose the second structure in the double normally ends close to the same level as the first structure. This idea expects choppy overlapping sideways movement for at least one more day, and maybe two, to end close to 1,141.
Minute wave b may also be a triangle which would expect choppy overlapping sideways movement in an ever decreasing range for another one, two or possibly even three more days. Triangles can be the most time consuming of all corrective structures. Their purpose is to test our patience.
Minute wave b may not move beyond the start of minute wave a above 1,170.19.
A clear five down on the hourly chart is what’s needed now to confirm this correction as over. While downwards movement will not subdivide as a five, we must accept the correction is not over.
BEAR ELLIOTT WAVE COUNT
Click chart to enlarge.
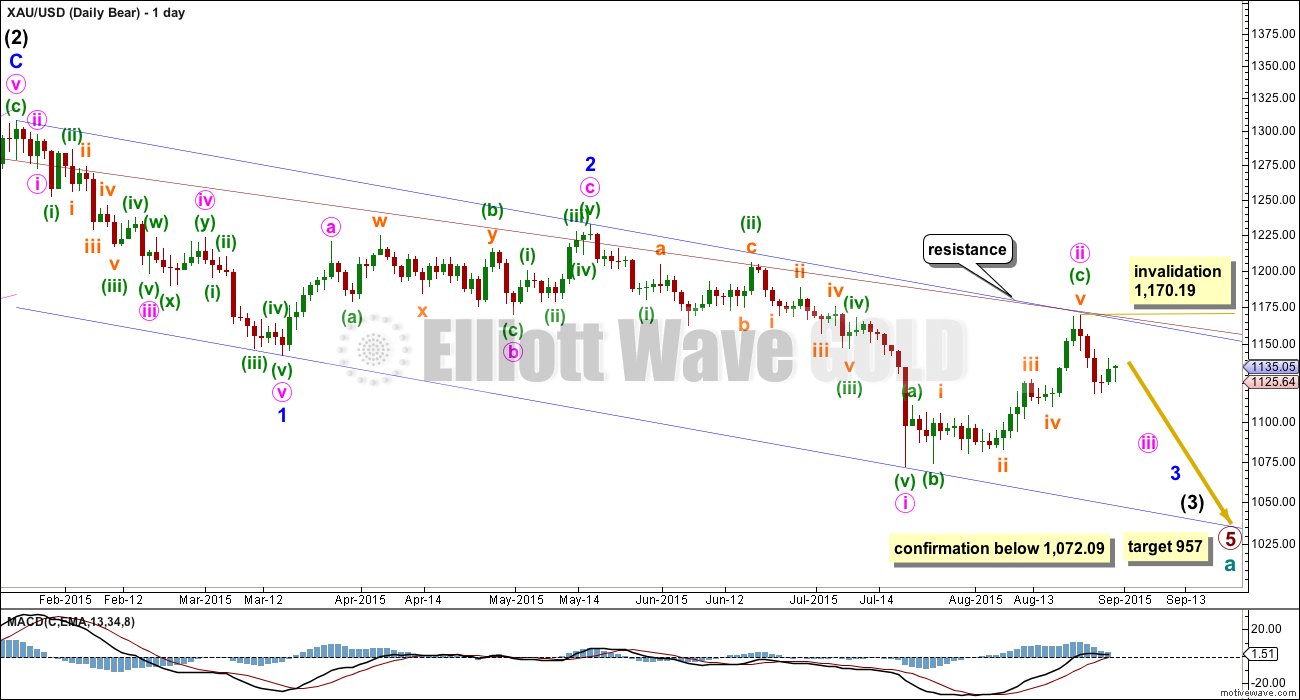
At this stage, the reduction of probability for the bull wave count sees this bear wave count about even now in probability.
This wave count now sees a series of three overlapping first and second waves: intermediate waves (1) and (2), minor waves 1 and 2, and now minute waves i and ii. Minute wave iii should show a strong increase in downwards momentum beyond that seen for minute wave i. Today there is another second wave correction unfolding for minuette wave (ii). If the correction moves higher, then it should find very strong resistance at the blue trend line. If that line is breached, then a bear wave count should be discarded.
The blue channel is drawn in the same way on both wave counts. The upper edge will be critical. Here the blue channel is a base channel drawn about minor waves 1 and 2. A lower degree second wave correction for minute wave ii should not breach a base channel drawn about a first and second wave one or more degrees higher. If this blue line is breached by one full daily candlestick above it and not touching it, then this wave count will substantially reduce in probability.
Within minute wave iii, no second wave correction may move beyond the start of its first wave above 1,170.19. A breach of that price point should see this wave count discarded as it would also now necessitate a clear breach of the blue channel and the maroon channel from the weekly chart.
Full and final confirmation of this wave count would come with a new low below 1,072.09.
If primary wave 5 reaches equality with primary wave 1, then it would end at 957. With three big overlapping first and second waves, now this target may not be low enough.
Click chart to enlarge.
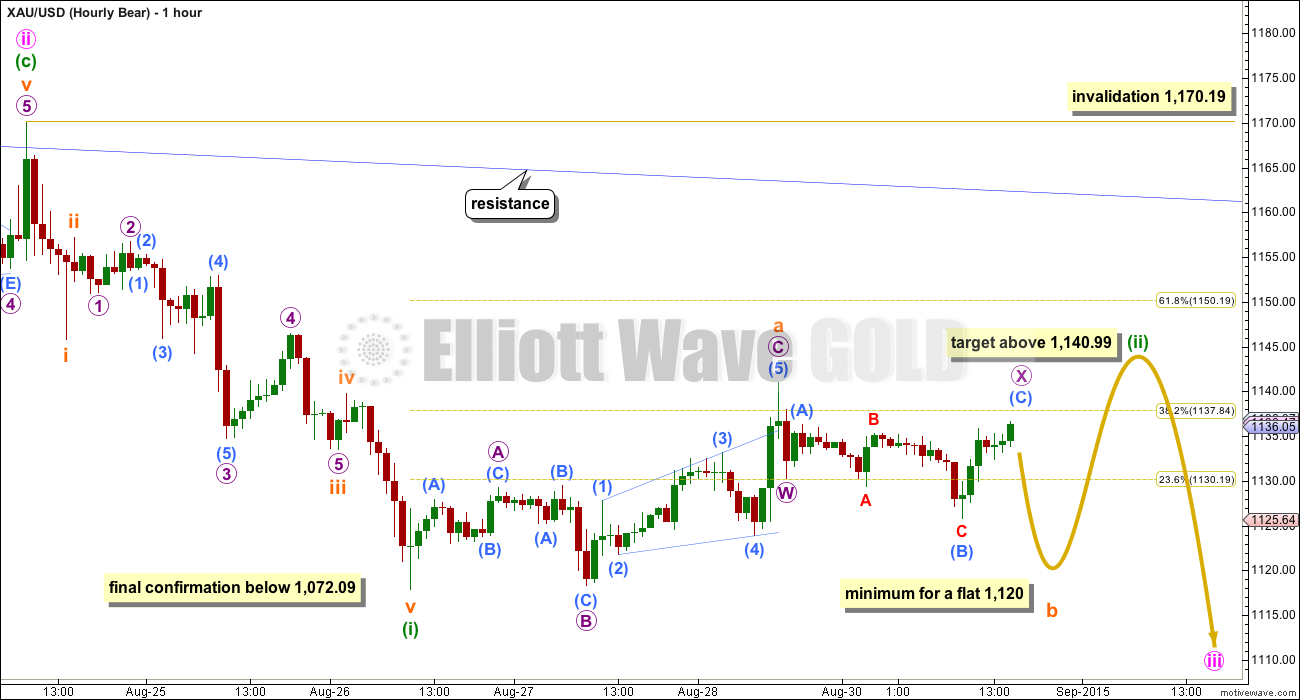
This wave count expects an impulse to be beginning downwards. An impulse subdivides 5-3-5-3-5. So far the first 5 down is complete.
The beginning of an impulse and the whole of a zigzag have exactly the same subdivisions.
At the hourly chart level, this bear wave count presents another structural possibility which may be unfolding for this sideways correction: a larger flat correction.
Within a flat both the A and B waves must subdivide as threes. The B wave must be a minimum 90% of the A wave. This would require subminuette wave b to reach down to 1,120 or below.
If an expanded flat unfolds, then subminuette wave b may move below the start of subminuette wave a at 1,117.84. There is no lower invalidation point for this idea.
A new low below 1,117.84 therefore does not confirm that the correction is over but that it may still be a part of the correction. Only a clear five down on the hourly chart can confirm the correction is over.
When subminuette wave b is complete then a five up for submineutte wave c would be very likely to end at least slightly above the end of submineutte wave a at 1,140.99 to avoid a truncation. It may reach up to the 0.618 Fibonacci ratio of minuette wave (i) at 1,150.
Minuette wave (ii) may not move beyond the start of minuette wave (i) above 1,170.19.
This idea also works in exactly the same way for the bull wave count at the hourly chart level.
TECHNICAL ANALYSIS
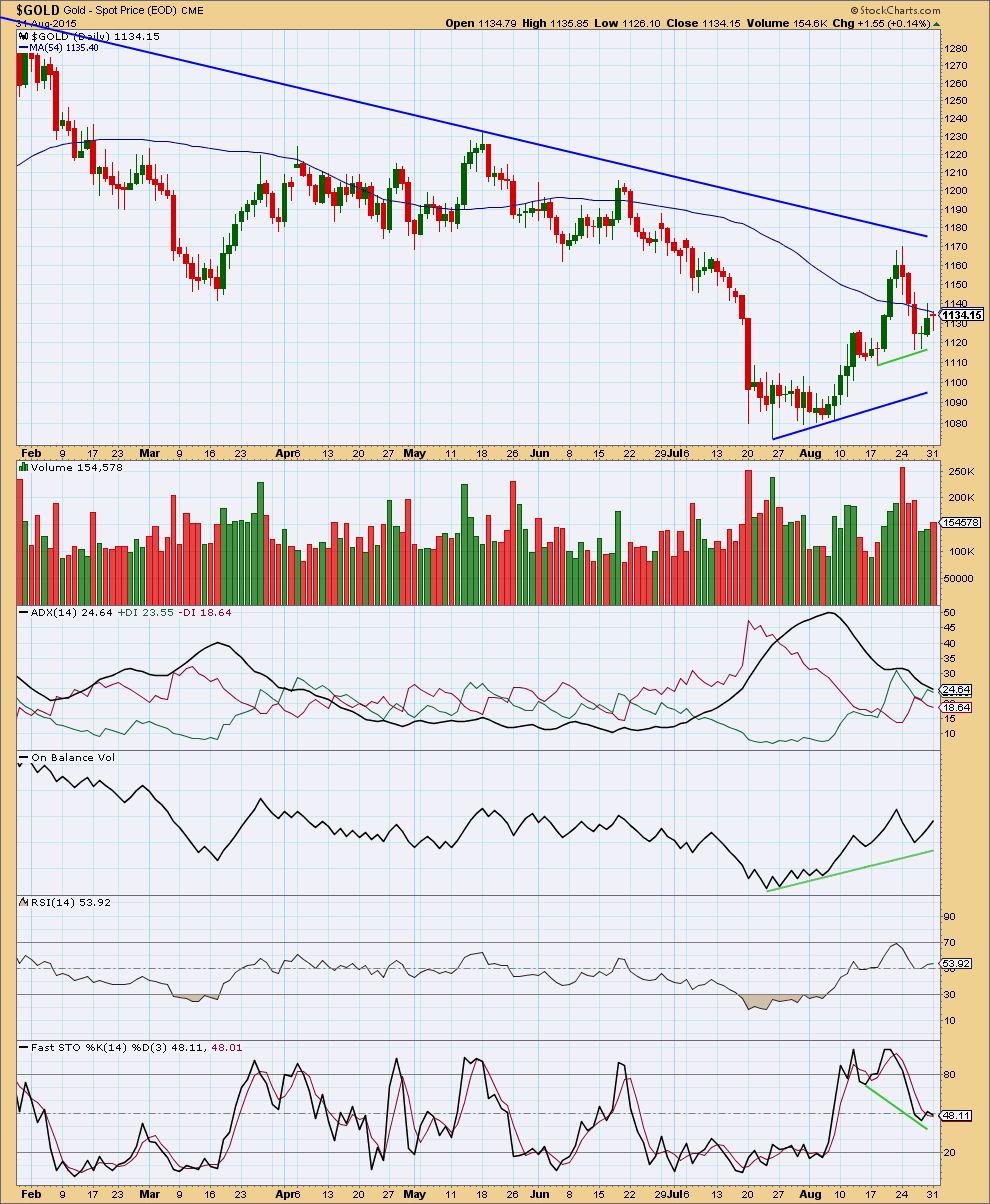
Click chart to enlarge. Chart courtesy of StockCharts.com.
A small red doji with a long lower shadow today indicates indecision, a balance between bulls and bears. It comes on slightly increased volume, indicating that this is part of a small correction and when the correction is done a downwards breakout is more likely than upwards. This fits perfectly with both Elliott wave counts.
ADX continues to decline indicating the market is not in a new trend and is range bound. Trading a range bound market is highly risky. The best approach is to step aside and wait for a clear trend to emerge unless you are a very experienced professional. There is a greater risk of losses in a range bound market.
On Balance Volume is overall more bullish than bearish while it remains above the green trend line.
An approach to a range bound market is to expect swings to continue from support to resistance and vice versa, and to use the blue trend lines for price in conjunction with Stochastics to tell when one swing ends and the next begins. This approach would expect a downwards swing to continue and only to end when price finds support and Stochastics is oversold.
This analysis is published about 04:47 p.m. EST.
Lara has gold made it’s high today at 1,148.05 at 9:08 am and now going down for 1 or more days towards 1,105 or lower?
I think so. But we don’t have confirmation of that.
As I commented to dsprospering last night: draw a trend line from the last two swing lows on the hourly chart. When that line is breached AND we can see a clear five down on the hourly chart that may provide confirmation.
If price finds support at that trend line on the way down then once breached there may be a throwback to the line. That may offer a nice entry point.
Confessions of Gold Analyst: Gold Selloffs And Human Nature Monday August 31, 2015 12:06 – Avi Gilburt
http://www.kitco.com/commentaries/2015-08-31/Confessions-of-Gold-Analyst-Gold-Selloffs-And-Human-Nature.html
Good read about market sentiment. Thx
Yes sentiment is a powerful indicator to watch.
Goggle DSI, Daily sentiment index.
At market extremes so is gold bullish sentiment either extreme high or low.
With Gold price basing off 1138-37 with 1133-32 below there holding, the upside does not seem done yet for a take out of 1144-46-47-48 making 1152-53 the next target….
Gold has behaved exceptionally well. It played out exactly as Dreamer and I suggested yesterday, a simple 3-wave affair ending Minute B at 1148.05. It is now beginning its slide downwards. I have the current movement as Minute C Minuette 1, with subminuette 3 just completed (at 1137.24). Now I can take a breather.
I’ve put my money where my mouth is. Bought DUST at 24.38 just after the open, and sold at 27.00 just now.
My next entry point will be after Minuette 2 completes, to take advantage of the large wave 3 drop. Not much by way of action from now, so will most likely be switching over to S&P which had completed its dead cat bounce and dropped quite significantly. I’m waiting to cash out of TVIX / UVXY.
Good luck everybody, and trade prosperously.
Nicely done.. That’s pretty slick pickin AT…
1 – do you trade the 1 minute chart? and
2 – what do you use for your setups and your triggers?
Hi Ted.
I use the 1 hour chart for the big picture view, and the 5 minute chart for entry / exit points. I sometimes use the 1 and 2 minute charts, but that is for top / bottom picking.
I trade using very basic tools. No frills. The simpler the better. Otherwise, there are too many things to monitor. And these have three main problems (a) distraction from the task at hand, meaning you can’t see the woods for the trees; (b) possibility of conflicting signals, causing hesitation, leading to indecision; and (c) I find that most indicators are good only for longer timeframes and not accurate for shorter timeframes as many of them are lagging indicators. To me, (b) and (c) are unacceptable in a fast moving market where opportunities may necessitate split-second decisions. I use EW as the framework for the larger timeframe (1 week to 1 month), and zoom in on real time price action, with Fibonacci ratios as a guide to resistance/support points. However, do note that everyone has to develop his/her own system, something they are comfortable with.
Tham, very interesting, appreciate hearing your strategy. What site / feed / tools do you use to track short term market action ?
Hi Davey. I use pmbull for gold price. To track the price movement, I use Bollinger bands and Parabolic SAR.
stopped out of long. that usually happens to me too early. We shall see
I went long after reading your comment last week and haven’t closed my position yet.
upwards movement looks like it could be over. I’ve already started nibbling on the short side. Might be early.
Lara, with tonite’s upward movement to 1142.xx is there a possibility that the bear hourly micro X wave continued higher? or can this upward movement be interpreted as ONLY the bull hourly is in play?
Clarification is appreciated for possible short-term position at market open.
Thank you.
That’s a good question. While the scenario I have on the hourly bear cannot be completely ruled out it is looking very unlikely now.
The scenario on the hourly bull chart looks right. Which means it’s most likely a combination, with the second structure a zigzag and now may be close to over.
A conservative approach to this would be to draw a trend line from the low I have labelled subminuette b within minuette (w) to the next swing low labelled minuette (x) on the hourly bull chart. Wait for that trend line to be breached to the downside, but it MUST be accompanied by a clear five down on the hourly chart. If that line offers support before it is breached then look for a throwback to the line as well, that may offer a good opportunity.
It is crucial to see a five down on the hourly chart (not a lower time frame). Otherwise it could be a b (or second) wave continuing yet further.
B waves are the worst. They can be the most complicated and difficult to analyse, a nightmare if you get caught trying to trade one.
Thank you for detailing a conservative approach. Wasn’t thinking about the a-b-c waves within minuette y being elongated
Thanks for the extra analysis Lara…tricky time right now…holding powder dry.
About that conservative trend line…”b to (w)”….
Could one place a parallel trend line on the top of (w)c5 and extend it to find a potential top for this wave at around the .618 retracement of the down wave “a”?
Is that a valid EW technique?
http://invst.ly/2dzf
Oh nice… when I did as you suggested it fits absolutely perfectly!
It’s not an Elliott channel. But it’s entirely technically valid.
Will have that on the hourly chart for today’s analysis.
With the afterhours move up, we could be getting close to a top. May be a sharp reversal down at the open.
Looking at the miner indexes, i’m thinking it might take a portion of tomorrow to complete or maybe longer. But we will find out in the morning. Not feeling to excited about shorting gold in here yet, but a nice looking target hit and reversal might have me change my mind.
Sept FOMC meeting isn’t too many trading days away. I’m expecting a rate hike.
Yep. Sep 17th is the day. A hike would likely see the $USD break to the upside from it’s trading range of the last few months, which of course should be bearish for gold.
The day before that is this Friday. All of the sideways movement this week is in anticipation of this last job report before the FOMC meeting.