
The main Elliott wave count expected downwards movement, which is what has happened for Monday.
Summary: The triangle is either over and a fifth wave down is unfolding (main wave count) or the triangle will continue sideways for another couple of days (new alternate wave count). The main wave count is in my judgement still about 80% likely. The first target at 1,071 may now be met in two days time. Until this fifth wave is over, I do not expect any new highs above 1,103.61. A classic technical analysis pennant pattern may still be completing. Use the lower trend line delineating the pennant and volume as indicators of a breakout; the breakout is extremely likely to be down, and should be underway when the line is breached and downwards volume shows an increase.
To see weekly charts click here.
Changes to last analysis are bold.
ELLIOTT WAVE COUNT
Click chart to enlarge.
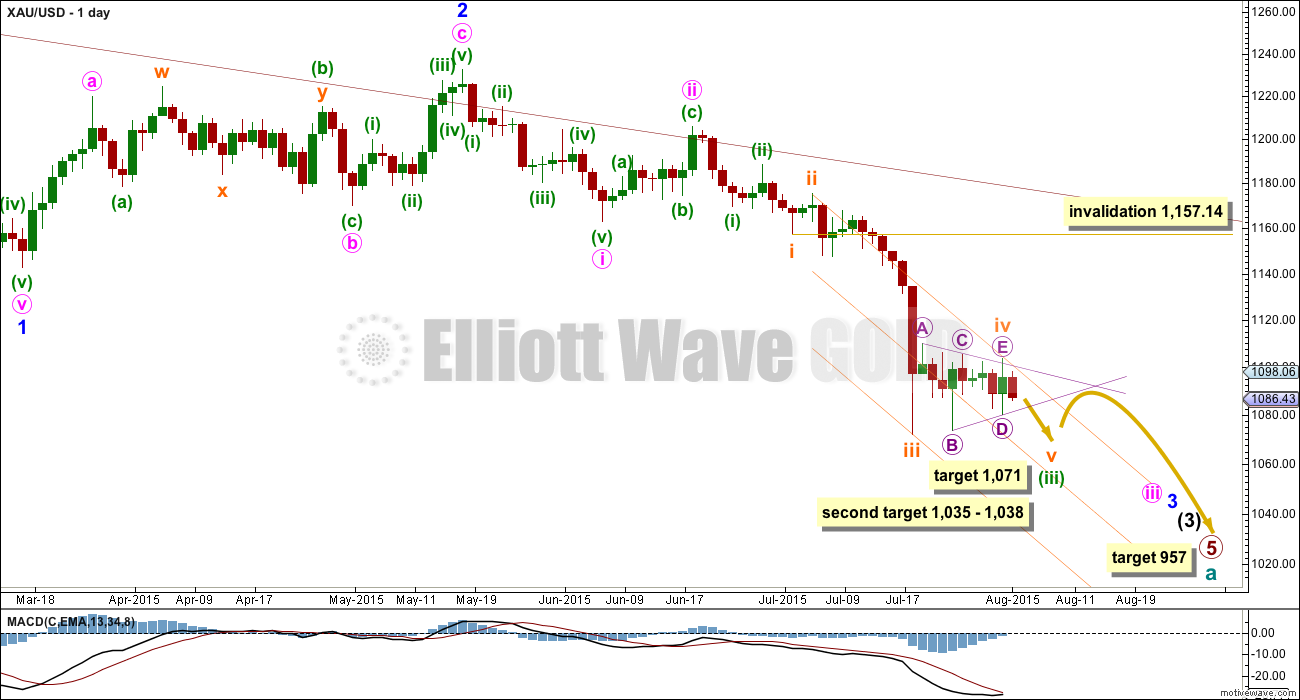
Cycle wave a is an incomplete impulse.
Within primary wave 5, the daily chart focuses on the middle of intermediate wave (3). Within intermediate wave (3), minor wave 3 now shows a slight increase in momentum beyond that seen for the end of minor wave 1 at the left of the chart. Third waves for Gold usually have clearly stronger momentum than its first waves, so I still expect to see a further increase in downwards momentum. The strongest downwards momentum may appear in a fifth wave somewhere within minor wave 3, or maybe the fifth wave to end minuette wave (iii) or minute wave iii, or that to end minor wave 3 itself.
Draw a base channel about minuette waves (i) and (ii) as shown (green trend lines). If the steeper orange channel is breached then look for the lower green trend line to provide resistance. Only if the upper green line is breached would I consider the wave count to be wrong.
Subminuette wave iii looks like it is over at the daily chart level. Subminuette wave iii has a typical curved look to it at the daily chart level and this wave count has the right look.
Subminuette wave iv may not move into subminuette wave i price territory above 1,157.14. A new low below 1,080.14 would confirm subminuette wave iv as a complete triangle, and only when that happens can the invalidation point be moved down.
Subminuette wave iv was most likely a regular contracting triangle. The structure is clear on the daily and hourly charts. Subminuette wave ii was a relatively deep 0.58 zigzag lasting two days, and subminuette wave iv exhibits perfect alternation as a shallow 0.29 triangle lasting nine days. Zigzags are normally quicker than triangles, so some disproportion would be expected; the disproportion is now bigger but still acceptable.
Draw the channel about minuette wave (iii) using Elliott’s second technique: draw the first trend line from the ends of subminuette waves ii to iv, then place a parallel copy on the end of subminuette wave iii. Subminuette wave v may end midway within this channel so add a mid line. Along the way down, upwards corrections against the trend should find resistance at the upper edge of this channel.
At 1,071 subminuette wave v would reach equality in length with subminuette wave i. At this stage, this would be my preferred target because fifth waves to follow fourth wave triangles are sometimes surprisingly short. The target would avoid a truncation.
If price reaches this target and the structure is incomplete, or if price just keeps falling through it, then a second target may be at 1,035 – 1,038; at 1,035 minuette wave (iii) would reach 4.236 the length of minuette wave (i) and at 1,038 subminuette wave v would reach 0.618 the length of subminuette wave iii.
Extend the triangle trend lines outwards. The point in time at which they cross may see a trend change. Sometimes this is when the fifth wave to follow ends. Sometimes it is a trend change within the fifth wave. When this is done on the hourly chart, the triangle trend lines cross over in two days time (the hourly chart is on an arithmetic scale).
Once price is below 1,072, look for the structure of subminuette wave v to be a completed five wave impulse on the hourly chart. Once that is clear, a subsequent breach of the upper edge of this orange channel would provide trend channel confirmation that minuette wave (iii) would be over and minuette wave (iv) would have begun.
Minuette wave (iv) should unfold sideways. It may be very shallow because minuette wave (ii) was relatively deep at 0.52. Minuette wave (ii) lasted three days and was an expanded flat. Minuette wave (iv) may exhibit alternation as another triangle or a zigzag most likely, and may last about five to eight days. If it is a zigzag, then it may be quicker and sharp.
At 957 primary wave 5 would reach equality in length with primary wave 1.
MAIN HOURLY ELLIOTT WAVE COUNT
Click chart to enlarge.
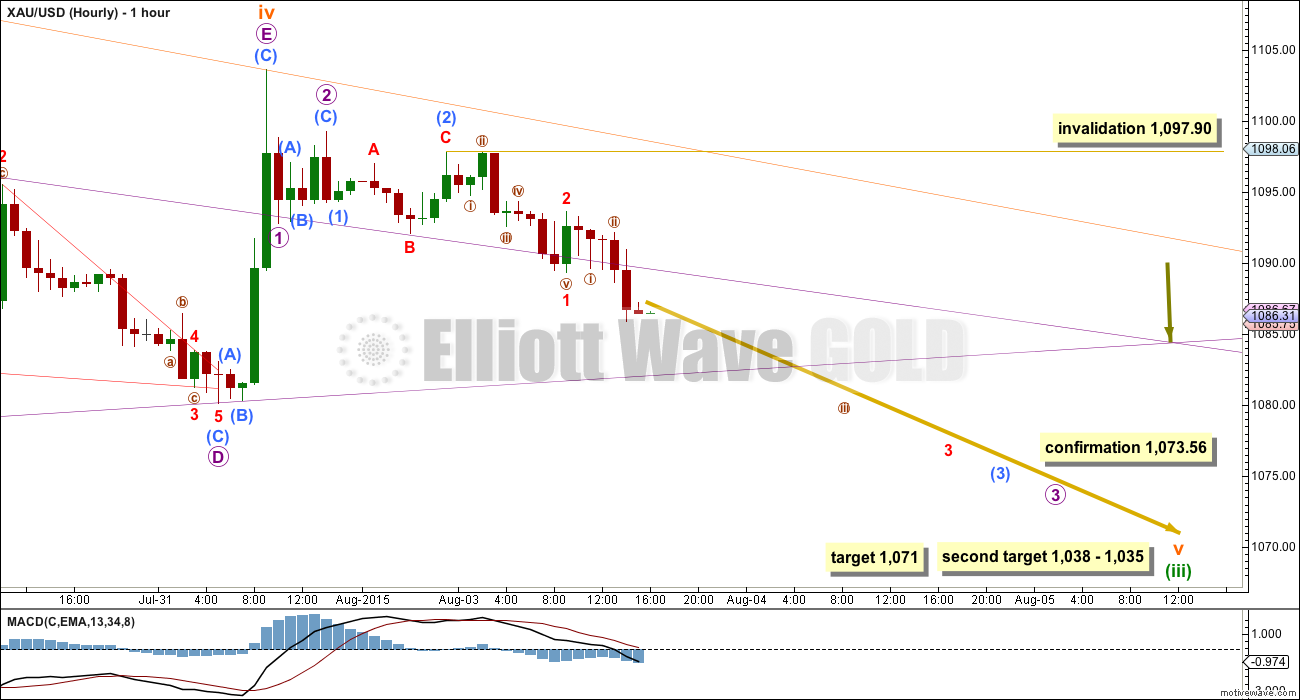
It is still most likely that the triangle is complete as labelled on the daily chart. The final E wave of the triangle overshot the A-C trend line; not as common as an undershoot, but the second likely way for an E wave to end.
If this fifth wave down ends when the triangle trend lines cross over, then at the hourly chart level that would be in two days time.
At 1,071 subminuette wave v would reach equality in length with subminuette wave i. This may be a more likely target because Gold sometimes exhibits short fifth waves following its fourth wave triangles.
If price keeps falling through the first target, or when it gets there the structure is incomplete, then the second target may be used. At 1,035 minuette wave (iii) would reach 4.236 the length of minuette wave (i) and at 1,038 subminuette wave v would reach 0.618 the length of subminuette wave iii. This second target would be several days away.
Subminuette wave v must subdivide as a five wave structure, and it looks like it may be unfolding as an impulse with an extended third wave. Within submicro wave (3), no second wave correction may move beyond its start above 1,097.90.
ALTERNATE HOURLY ELLIOTT WAVE COUNT
Click chart to enlarge.
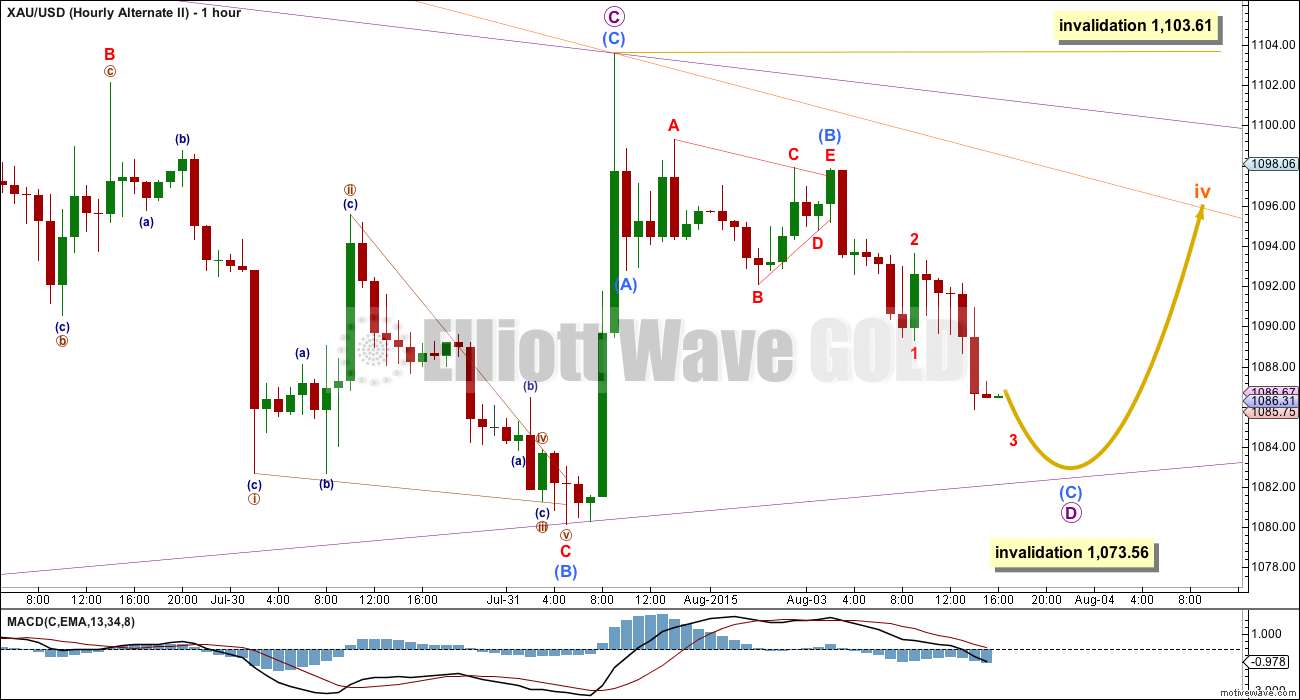
The last alternate now looks so unlikely I am discarding it. If subminuette wave iv is not over, then it is more likely that the triangle is continuing further sideways.
Micro waves A and B are the same as labelled on the daily chart and as labelled for the main wave count. Thereafter, it is possible that micro wave D ended at the last high at 1,103.61. Micro wave D would be a single zigzag with submicro wave (C) truncated by 1.57. The truncation reduces the probability of this wave count.
Micro wave D may not move beyond the end of micro wave B below 1,073.56, if this is unfolding as a regular contracting triangle (the most common type). If a barrier triangle is unfolding, then micro wave D may end slightly below this point as long as the B-D trend line remains essentially flat. The lower invalidation point is not black and white, the only Elliott wave rule with any grey area. When price gets down to 1,073.56, if downwards movement looks like a three wave structure and volume has not increased, then this may be a viable explanation.
My concern today is that although price is moving lower it is not supported by volume. Volume for Monday is light, and this does not support a downwards breakout.This may be resolved tomorrow with an increase in volume, and if that happens, then the probability of this alternate would reduce.
If volume remains light and downwards momentum does not strongly increase, then this alternate may increase in probability.
TECHNICAL ANALYSIS
Click chart to enlarge.
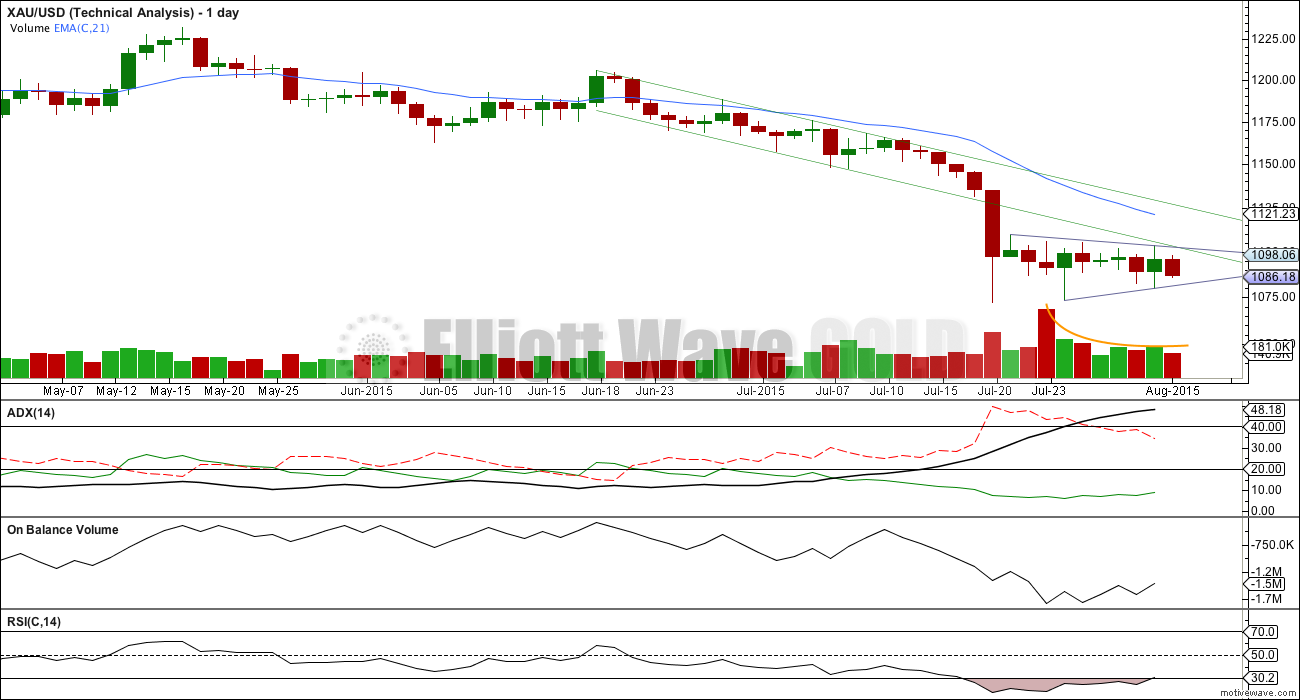
Daily Chart: The small pennant pattern is still overall working well: a new low was seen before the high and the high is not substantially above the upper pennant trend line.
The lower edge of the green channel is now providing resistance (previously the lower line provided support).
The lower green trend line is technically significant, shallow, and repeatedly tested. That line now should hold while the downwards trend remains intact.
ADX continues to rise during the formation of this consolidation. Despite price drifting sideways the trend continues to strengthen and remains down.
A trend following strategy should be used. Trading with the trend is advised. A mean reverting system which allows trades against the trend should only be used by the most experienced professional traders, and for all others it is strongly advised to never trade against the trend.
The simplest system for a downwards trend like this is to use resistance lines: each time price touches resistance that represents an opportunity to enter in the direction of the trend. Trades may be held until price either reaches support, a target, or if the trade is held for one day if you are a day trader. Depending upon your trading style, your risk management, and management of the equity in your account, stops as always are essential: they may be money management stops, they may be just above lines of resistance (allow for small overshoots), or they may be Elliott wave invalidation points.
Corrections against the trend offer an opportunity to join the trend at a good price. Corrections do not offer good trading opportunities when they are at low wave degrees; trying to trade the small waves within a correction exposes your account to the potential for big losses.
This approach outlined here is just one trend following method of many.
There is a little positive bullish divergence last week: the low for 23rd July did not move below the prior low of 17th July, but On Balance Volume did make a new low. OBV moved lower while price did not. This bullish divergence indicates a correction against the trend to unfold, which is what has been happening. This correction should resolve this divergence.
Monday’s candlestick is red, but a new low below Friday’s extreme has not been made and volume is light. If this is the start of a downwards breakout, then it is slow and unconvincing. This may be resolved if tomorrow produces another red candlestick on increased volume. The breakout to this small pattern is still expected to be very likely to be down, because volume within it is very clearly strongest for a down day and pennants are the most reliable of classic technical analysis continuation patterns.
It is possible that the pennant is not complete and is continuing; the pattern still looks like a pennant. I have redrawn the lower trend line for it. When price breaks below that lower line and downwards volume shows an increase, then the downwards breakout should be underway. This may offer an earlier indication of the breakout than the Elliott wave confirmation / invalidation point at 1,073.56.
This analysis is published about 04:54 p.m. EST.
Lara is the hourly alternate now the main wave count?
What is the target and time frame for micro wave E to be over? Is it 1100?
Once micro wave E is over is it 1 day down to 1071 and several days to 1035 – 1038?
Yes, it’s the alternate. I commented way below, last night.
Micro wave E is incomplete. I expect it should end with one last push up for submicro wave (C) to reach equality with submicro (A) at 1,099. That should happen now within the next 24 hours, and maybe within 8 hours.
When micro E completes the triangle look out for a short swift sharp fifth wave down. They can move fast.
The final target for that will probably be pretty much the same; at least slightly below 1,072 to avoid a truncation. 1,071 would be the preferred target with 1,035 – 1,038 less likely but also possible.
Gold hit Tham’s target range of 1085 – 1086 (1084.85 at 2:19 pm)
He mentioned gold would move up to 1100 to end Micro wave E.
If that happened then DUST might drop to $34 – 35. Lara may clarify if gold will bounce up to 1100 area before it drops to 1071 or even to 1035 – 1038 zone.
Lara’s note at 3:32 am this morning, “I’d expect micro wave E to be over within 24 hours most likely.”
Aiden
Below is a chart of NUGT from 2012 and you can see how price decay took place. Once PM sector was confirmed in down trend one could have short NUGT and held it now profit would be 100%.
There were two reverse splits 10 for 1 and 5 for 1.
Good luck!!
Gold is getting close to Tham’s target 1085-1086 before gold goes to 1100.
If anyone is considering taking DUST profits?
Alan Tham August 4, 2015 at 10:46 am (He has full comment earlier today)
…
Current price drop is the third wave, nano 3. I would expect submicro b to complete in the range 1085-1086.
That would facilitate submicro c / Micro E to end at 1100.15, in which c=a. (There isn’t much room for larger movements).
It may look like a 5 wave up to begin wave e of the triangle, but i think it’s entirely possible it was a completed 3. A zigzag or double zigzag. Need Lara to weigh in on that, but there is the possibility that triangle is complete.
Plus USD is surging and bumping up against a band of resistance. Potential breakout right here. Anyone seeing that too?
Yes US dollar at market open 9:30 am EST today $DXY 97.371
US dollar now at 2:27 $DXY is at 97.827
I agree, it looks pretty clear as a five up, now followed by a three down.
A new high above 1,090.38 would confirm the downwards wave as a three; at that stage it couldn’t be in a fourth wave correction for a five down.
The target for micro wave E to complete is 1,099
Taken at 38.10
I see a 1-2 1-2 on dust chart I got a target of mid 39ish for 3rd wave
Miners Advice:-
Hoping for some impartial advice/ thought son miners.
I am currently holding approx £160k in miners that are 30-35% down in the past month. I originally paid £220k.
Keen to hold these for 3-5 years to ultimately buy a house for myself. If you where (stupid enough to be) in my position would you sell and rebuy sub $1000?
Any thoughts appreciated, particularly if you are holding miners at this time or expect to be shortly.
I recommend you read Lara’s comments here and in the bottom technical portion of her analysis over the past week where she warns against trading against the clearly established downward trend and also about safe trading practices and also recommends a trading book.
Richard and Lara give good advice. None-the-less, I think the miners are putting in a bottom worth trading. This view is based on non-EW methods. Of course I could be wrong. Also, I do not expect this rally to last your desired 3-5 years.
I hope you are working overtime to learn EW and at least one other type of analysis so you are not whipsawed by varying opinions on this forum.
Hi Richard – Apologies if I wasn’t clear. I am looking at an investment over years rather than a trade. I am not worried by paper losses at this time, but would like to keep them as small as possible obviously. If gold enters a Bull Market in the sub $1000 these positions will be quickly made up.
Fencepost – Interesting – Is it a bear market rally you expect or a Bull Market? A gold Bull Market should last the expected duration based on past movements.
Hopfully you’ve done enough bullish buying for a few months until gold hits final bottom. As far as holding your miners during that period. I hope they are strong enough to avoid bankruptcy. I would think that gold final bottom would happen before the year end. I will have bought miners before that to keep long term.
You are not clear if you are willing to sell any since you are willing to hold them for years. Do you ever trade miners or just on Lara’s site hoping to buy low and hold?
Good questions Richard
I have a ‘core’ investment that is the miners stated. These are long term, however I was looking to see whether I could save 10-15% by selling at $1100 and buying back $980 ish. Or whether miners would bottom first and savings marginal at best.
I had a large ‘trading’ pot which is now 38k having held NUGT for 5 weeks and being smashed to pieces. I hope to recover some funds over the next few months trading this pot.
When do you expect to be buying miners?
Please take this advise. I do not know what your holdings are?? Long GDX? Short 3xetf DUST and JDST???
Long: Miners are going in to the toilet very soon. Just look at the charts of any senior miners. They are broken. PM sector is getting in the final Phase III of bear market that will capitulate every thing.
Shorts: Do not hold shorts for long time. These instruments are for trading. There is tremandous price decay if you hold short 3xetf. The way these works is 3x the daily performance of underline etf.
Example one advisor bought DUST at 50 in 2013 and two years later sold it for $13 even though GDX was down considerable.
Daily 3x performance is like a compound interest daily on your loan.
The only way to take advantage of 3xetf is to short the Bull 3xetf and hold for lone time. Short the JNUG and/or NUGT on a corrective wave up.
More data on this later.
I do not know how many other trading service you have, but with that kind of fund you want to join another one where excellent group of traders shares trading strategy. one month is free. Look up Rambus chartology.
You get the overview of all investments.
Thanks Papudi
I have bought the actual mining stocks rather than ETF’s – Recent losses (before I came here) came through NUGT – Aware of how brutal these are.
Miners I am holding:
Large holding 50k- GoldCorp, New Gold, Seabridge, Silverwheaton
Middle 20k- Fresnillo,
Small – Shanti, SOLG
I bought expecting a 20% rally and got slapped.
Thinking about holding these for long term OR selling all at 1100 and waiting for $980 and rebuying.
Conundrum
Appreciate your steer good sir.
When capitulation comes to PM sector no matter what one’s conviction is it gets shaken by the down draft.
I have experienced it in 2008. Finally sold it at rock bottom the same miners.
Be careful
For a longer term investment strategy I still recommend Magee and Edwards “Technical Analysis of Stock Trends”. This is the perfect book for you. It’s easy to read and covers investment strategy well, it also covers trading.
I have a Grand Supercycle EW analysis, look under “Gold Historical” category.
When primary wave 5 down is complete then I’m expecting a bear market rally. The rally should last one to several years. But beware, it will be a B wave. They’re the worst. They can be choppy and overlapping and hideous to analyse and trade, or they can be quick sharp zigzags that look like impulses. B waves exhibit the greatest variety in form and behaviour. There are a total of 23 possible patterns for them to unfold as. It could be a sideways drift or a sharp rally up.
Primary 5 still needs intermediate (3) to end which is weeks away yet and the strongest downwards move is ahead of us. Intermediate (4) should last weeks, maybe 8? Intermediate (5) also should last weeks.
I expect primary wave 5 may end at the end of this year, but it may take longer. It may end in the first quarter next year.
Then the B wave should start.
Lara you have described the gold analysis in a simple format any non EW trader can understand well while taking advantage of your fabulous reports every day.
Not all traders here who joins are as well verse in EW as some are.
It will be helpful to those who can get more out of the detail EW analysis if a similar para is added just below the the Summary as title “Overview” followed with detail EW technical report with EW waves rules and guidelines.
Thanks, Just my 2 cents.
I’ll add the time expectations to the historical analysis.
Lara, that was a nice gold summary.
Thanks Lara
I really appreciate this – both the thoughtfulness of your post and time taken.
Is there anything within EW that considers a market ‘rerate’?
That’s a fundamental approach to looking at markets.
Elliott wave is mutually exclusive to fundamental analysis. The two just don’t go together at all.
So no. There is nothing within EW that considers a market re-rate. But EW does expect large price movements.
Amazing summary thanks Lara.
Lara, you said “Primary 5 still needs intermediate (3) to end which is weeks away”, is it weeks or days. Thanks.
Aidan–Are you a trader or investor?
If you say you are an investor how can you not align with a primary trend? The primary gold trend is down. Ask yourself if your gold investments are aligned with the primary trend? That is your answer.
JUST A VIEW: Hard to see Gold price get to or take out 1099-1101 range and likely to get knocked back down from within 1093-95…. All it takes at this stage is a break below 1089; nothing there between 1089 and 1078-77 except thin air lol….
So far as I can see, today’s price movement favours the alternate count. (My reason for saying this has been posted in my response to Lara).
Micro D ended at 1081.08.
Micro E is subdividing as 3 waves.
The first wave, submicro a looks like 5 waves, which means that Micro E is a 5-3-5 zigzag.
Submicro a ended at 1094.88.
Submicro b has 2 subwaves completed at 1090.38 and 1094.72 respectively.
The third subwave, miniscule c, must subdivide into 5 waves. The first two are already completed. Current price drop is the third wave, nano 3. I would expect submicro b to complete in the range 1085-1086.
That would facilitate submicro c / Micro E to end at 1100.15, in which c=a. (There isn’t much room for larger movements).
Thanks Tham
Thanks Tham
So for the novice (me):
1094.88 TO 1085/6 TO 1100.15 TO 1072 and below?
Hi Aidan. That is precisely what I can see at the moment. I hope there are no surprises that would require a rework.
Star – Really helpful, particularly for people learning this.
Appreciated
Good morning.
Thank you Tham for your timely analysis of where we are.
This is so very exciting following golds down moves.
Will be ready to add to position at top of C. Trying not to overtrade this, and just be positioned well. (I did buy back about $4 lower after my last huge profit taking) Hope your doing well.
and Good trading to all….
Tham, thanks for your excellent analysis and forecast. Awesome.
Gold looks like the hourly alternate
Then invalidation is 1103esh
I realise its not an obvious three at the moment, but any possibility E could already have completed?
You are right that the rise looks more like a 5 than a 3, but it seems to have gotten close to the trendlines Lara mentioned in her 3:32 am post.
Another possibility I have not seen discussed is an ending diagonal for the move down from 1103 (subminuette v). All subwaves of an ending diagonal have to subdivide as zigzags.
Thanks for your feedback yesterday Alister
I had misinterpreted what was written so thanks for the heads up.
Interested in getting out of NUGT and positioned in DUST.
Is the Wave ‘C’ higher the last move higher we have?
No problem. I’m not fully sure where we are. Could be more upside to end E? I’m holding DUST, but looking to reduce my position in case gold continues to go up after market open.
Re: ‘c’ wave. If I’ve understood Tham correctly, then I think wave ‘c’ (of submicro c of micro E) should end the upward movement, yes.
Appreciated – Holding NUGT through a fortunate error.
Looking to exit soon after open and see how the day pans out.
Lara,
It seems that if we are to have an increase in momentum to the downside, we would have to drop well below 1071. We are currently at ~1083, and I can’t imagine a $12 drop doing much for momentum on the downside. What are your thoughts on this?
I mean an increase in momentum for the third wave within subminuette wave v.
Subminuette wave v doesn’t have to stronger momentum than subminuette iii.
At this stage it looks like the alternate is correct. Upwards movement has bounced off the lower trend line and is moving strongly higher. Because it’s back into minuscule wave 1 price territory on the main hourly wave count it can’t be minuscule wave 4.
It could be another second wave correction…. but now that just doesn’t look right. It’s far too long in duration, much longer than second wave corrections one, two and three degrees higher.
I’d now be looking for micro wave E to complete as an obvious three wave structure and to fall short (most likely) of the A-C trend line. It may find resistance at the upper orange trend line, or maybe the lower green line on the TA chart.
I’d expect micro wave E to be over within 24 hours most likely.
When it is done the movement out of the triangle may be swift, sharp and short.
The targets for the following fifth wave down would be pretty much the same; 1,071 most likely, or 1,035 – 1,038 less likely.
I think you are right. I had counted the lower degree waves and the strong upward movement should have been submicro 4. However, the high was at 1094.88 which penetrated (slightly) submicro 1 territory.
It fits well as the a wave of submicro c of micro E of the alternate count though.
Tham, at what price will you be looking to get into dust today? I am thinking between 35-36.
This triangle is going to give us a great price today!
Since ‘a’ took us as high as 1094.88 I’m a bit concerned at how high ‘c’ might take us further. Is the EW requirement just that it be slightly higher than 1094.88?
It is quite difficult to say how low DUST will go to as my graph feeds do not provide enough waves to count it. I will go by the gold price. Once it reaches a high, then gold will drop and DUST will break its down move.
HI Alan Tham,
do you have a target for wave E to end?
Sorry, my reply somehow went on top of this.
“Corrections do not offer good trading opportunities when they are at low wave degrees; trying to trade the small waves within a correction exposes your account to the potential for big losses.” – Lara