
The alternate Elliott wave count proved to be correct in the last 24 hours.
Summary: A fourth wave triangle should end about 1,099 within the next 24 hours, or maybe as soon as about 8 hours. Thereafter, a fifth wave down should unfold to reach at least slightly below 1,072 to avoid a truncation. The target for it to end will be about the same at 1,071 in the first instance, with a less likely possibility about 1,035 – 1,038. Beware: movements out of triangles can be very fast and short lived.
To see weekly charts and analysis click here.
Changes to last analysis are bold.
ELLIOTT WAVE COUNT
Click chart to enlarge.
Cycle wave a is an incomplete impulse.
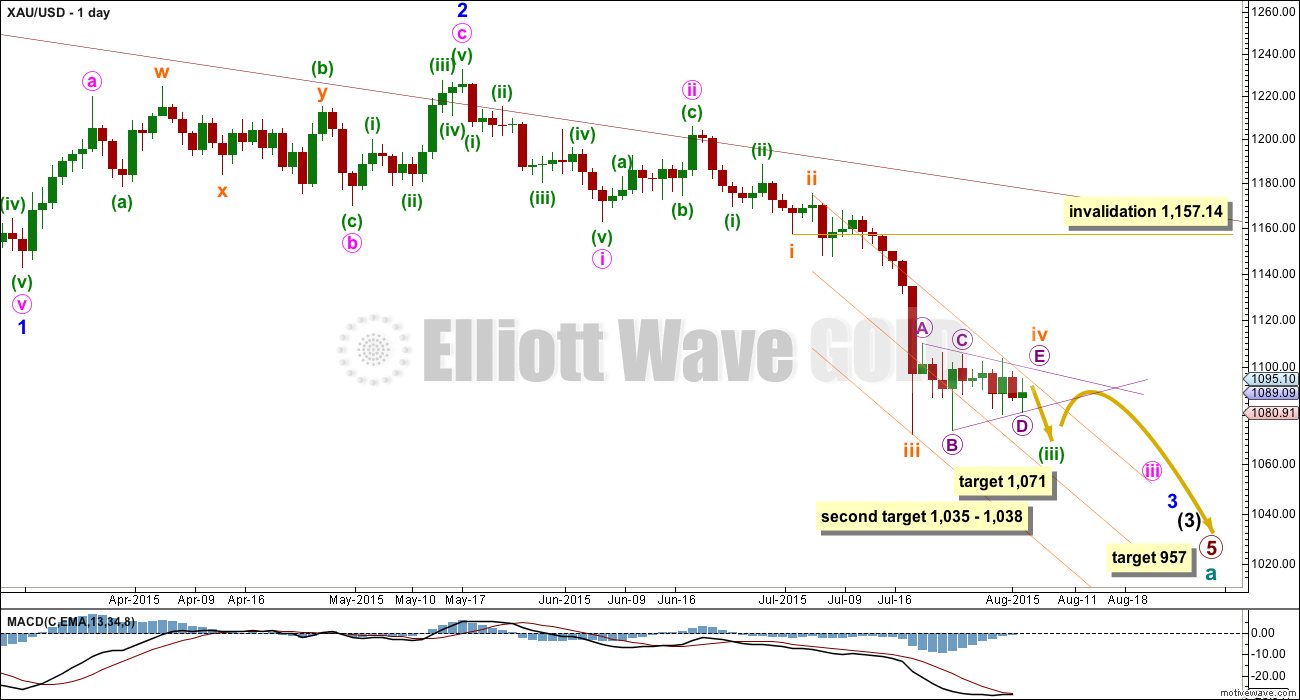
Within primary wave 5, the daily chart focuses on the middle of intermediate wave (3). Within intermediate wave (3), minor wave 3 now shows a slight increase in momentum beyond that seen for the end of minor wave 1 at the left of the chart. Third waves for Gold usually have clearly stronger momentum than its first waves, so I still expect to see a further increase in downwards momentum. The strongest downwards momentum may appear in a fifth wave somewhere within minor wave 3, maybe the fifth wave to end minuette wave (iii) or minute wave iii, or that to end minor wave 3 itself.
Subminuette wave iii looks like it is over at the daily chart level. Subminuette wave iii has a typical curved look to it at the daily chart level and this wave count has the right look.
Subminuette wave iv may not move into subminuette wave i price territory above 1,157.14.
Subminuette wave iv is a regular contracting triangle. The structure is clear on the daily and hourly charts. Subminuette wave ii was a relatively deep 0.58 zigzag lasting two days, and subminuette wave iv exhibits perfect alternation as a shallow 0.29 triangle lasting eleven days. Zigzags are normally quicker than triangles, so some disproportion would be expected; the disproportion is acceptable.
Draw the channel about minuette wave (iii) using Elliott’s second technique: draw the first trend line from the ends of subminuette waves ii to iv, then place a parallel copy on the end of subminuette wave iii. Subminuette wave v may end midway within this channel so add a mid line. Along the way down, upwards corrections against the trend should find resistance at the upper edge of this channel. The triangle is almost complete, so redraw the channel when it is over.
At this stage targets are approximate. When the triangle is complete it will be known at which point the fifth wave begins, then targets can be calculated more accurately for it to end. It is most likely to reach equality in length with subminuette wave i about 1,071.
If price reaches the first target and the structure is incomplete, or if price just keeps falling through it, then a second target may be at 1,035 – 1,038; at 1,035 minuette wave (iii) would reach 4.236 the length of minuette wave (i) and at 1,038 subminuette wave v would reach 0.618 the length of subminuette wave iii.
Extend the triangle trend lines outwards. The point in time at which they cross may see a trend change. Sometimes this is when the fifth wave to follow ends. Sometimes it is a trend change within the fifth wave.
Once price is below 1,072, look for the structure of subminuette wave v to be a completed five wave impulse on the hourly chart. Once that is clear, a subsequent breach of the upper edge of this orange channel would provide trend channel confirmation that minuette wave (iii) would be over and minuette wave (iv) would have begun.
Minuette wave (iv) should unfold sideways. It may be very shallow because minuette wave (ii) was relatively deep at 0.52. Minuette wave (ii) lasted three days and was an expanded flat. Minuette wave (iv) may exhibit alternation as another triangle or a zigzag most likely, and may last about five to eight days. If it is a zigzag, then it may be quicker and sharp.
At 957 primary wave 5 would reach equality in length with primary wave 1.
Click chart to enlarge.
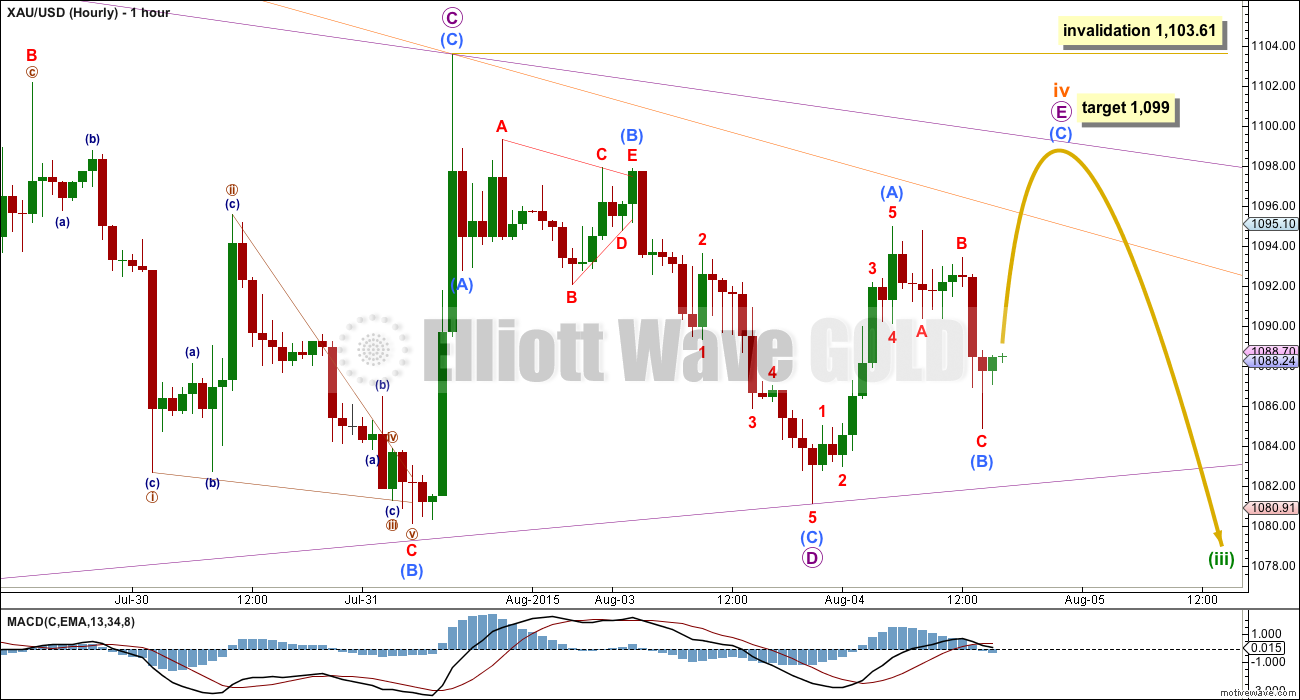
The final wave for micro wave E is unfolding as a zigzag. At 1,099 submicro wave (C) would reach equality in length with submicro wave (A).
Micro wave E of a contracting triangle may not move beyond the end of micro wave C above 1,103.61.
Submicro wave (A) lasted a Fibonacci eight hours and submicro wave (B) lasted nine hours. Submicro wave (C) may complete in a total Fibonacci eight hours, and so may end now in about six hours time.
Micro wave E is most likely to fall short of the A-C trend line (violet line). But if it does not end short, then the other likely way for it to end is to overshoot that line.
Fifth waves following fourth wave triangles for Gold often move very fast and are surprisingly short. When submicro wave (C) can be seen as a complete five wave structure and has moved at least slightly beyond the end of submicro wave (A) at 1,094.98 avoiding a truncation, then look out for a trend change and a quick strong downwards movement.
TECHNICAL ANALYSIS
Click chart to enlarge.
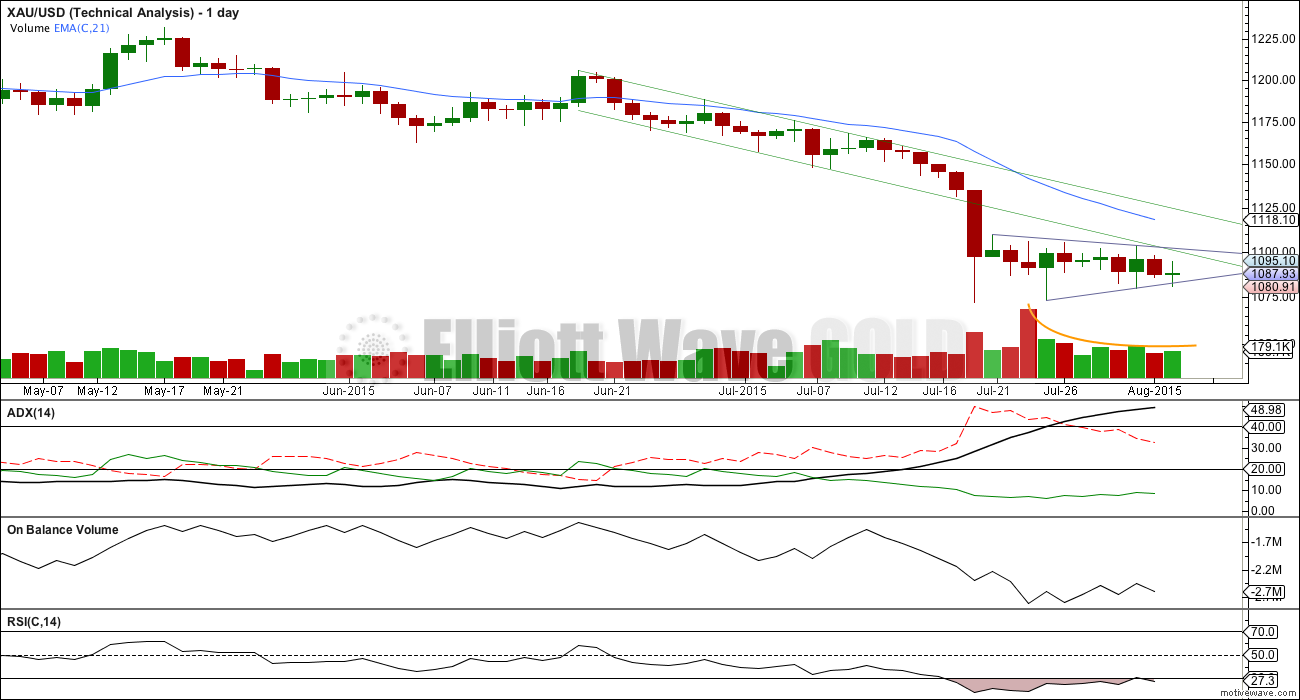
Daily Chart: The small pennant pattern continues to unfold. Pennants are smaller versions of triangles. This classic technical analysis pattern is the most reliable continuation pattern, particularly when it turns up in a clearly defined trend and unfolds on declining volume as this one does. During the unfolding of this pennant pattern, it is a downwards day which clearly has the strongest volume providing further indication that the breakout of this pattern is likely to be downwards. When price breaks below the lower trend line of the pennant, and when volume shows an increase, then a downwards breakout should be expected to be underway.
ADX continues to rise during the formation of this consolidation. Despite price drifting sideways the trend continues to strengthen and remains down.
A trend following strategy should be used. Trading with the trend is advised. A mean reverting system which allows trades against the trend should only be used by the most experienced professional traders, and for all others it is strongly advised to never trade against the trend.
The simplest system for a downwards trend like this is to use resistance lines: each time price touches resistance that represents an opportunity to enter in the direction of the trend. Trades may be held until price either reaches support, a target, or if the trade is held for one day if you are a day trader. Depending upon your trading style, your risk management, and management of the equity in your account, stops as always are essential: they may be money management stops, they may be just above lines of resistance (allow for small overshoots), or they may be Elliott wave invalidation points.
Corrections against the trend offer an opportunity to join the trend at a good price. Corrections do not offer good trading opportunities when they are at low wave degrees; trying to trade the small waves within a correction exposes your account to the potential for big losses.
This approach outlined here is just one trend following method of many.
There is a little positive bullish divergence last week: the low for 23rd July did not move below the prior low of 17th July, but On Balance Volume did make a new low. OBV moved lower while price did not. This bullish divergence indicates a correction against the trend to unfold, which is what has been happening. This correction should resolve this divergence.
The small green doji candlestick for Tuesday represents indecision, a balance between bulls and bears. The doji supports the idea that price is consolidating.
This analysis is published about 05:13 p.m. EST.
IMO Lara’s count is still on track. Gold is now in the final small 5 wave structure up to complete that E wave. The first 2 of 5 should be complete.
Some upward movement to 1099 area, followed by a move down to lower 1070s/ upper 1060s seems plausible. Thereafter I expect a sizable bounce.
The Friday morning jobs report will have a big impact on price.
Matt, do you have an opinion of the 1070 ish target vs the 1035 ish target probability?
I think 1035 is unrealistic right now. That will come later. I also believe that the move up from 1070ish (IMO gold may get to the 1060s) may be very fast.
Hi Matt
Do you have a target in mind if the temporary bottom is 1070/60’s?
Appreciated
I assume that you’re talking about an upside target. Conservatively, 1100. However, I would not rule out a move to 1130 zone.
My wave count today will see submicro (B) moving lower. Submicro (C) still needs to move above 1,094, the end of submicro (A), to avoid a truncation.
Micro E is a zigzag. So submicro (B) within it can’t move beyond the start of submicro (A) below 1,084.09. While price remains above that point my preferred wave count will expect that the triangle is incomplete, that the final zigzag of micro E is still unfolding.
Only a new low below 1,084.09 would indicate the triangle is over and price is breaking out downwards.
But first, if the lower B-D trend line is clearly breached by downwards movement (not just overshot) that may be an earlier indication the triangle would be over.
For now submicro (A) looks like such a clear five, and this downwards movement looks like a very corrective movement.
Volume is lighter today too. This does not look like the downwards breakout… yet.
Triangles take their time and test our patience. That is their purpose. This one is achieving that purpose very well.
Lara – 1,084.09 has already been breached
Are we heading lower now?
It may not be her gold count from her feed?
I agree something is not right. Volume is very light and dust/gdx seems to be divergent of gold. The bottom trend seems to be holding well….could see a big shoot up tomorrow?
I’m so sorry everybody! My bad.
I read the high not the low of the candlestick.
The breach needs to be the low I have labelled micro D.
Which is 1,081.10
DUST at 39.95 high. When DUST goes up $4.40 in one day it’s a good time to take profits before the close as it usually drops overnight and cheaper the next morning or next day.
Hopefully the triangle is intact, so tommorow we can get a better price and take another ride on the dust wave!!!
Yes however when gold goes up Thursday, DUST would have dropped a lot. So buy DUST low and sell high and happens almost everyday especially in this pennant/triangle.
Do we have a wave count yet for today?
Gold flirts with 5-year low as dollar strengthens – Aug 5, 2015 2:30 p.m. ET
http://www.marketwatch.com/story/a-looming-rate-hike-weighs-on-gold-2015-08-05
DUST $39 target hit
2:47 pm Gold just dropped quick.
Maybe ended or starting another down wave?
Elliott Wave, the endless cycle of surprises.
DUST just triple peaked.
Unless this gold wave continues down???
@ Shahab Zaidi, maybe today is the day.
May I ask, how did you determine your target? I saw the other day you were looking for over $39 too.
i got wave 1 from 35.60 to 37.60 = 2 x 1.618 = 3.2
i got wave 3 starting at 36.40 + 3.2 = 39.63
ah, Thank you.
.. didn’t recall you are doing EW on dust itself
i am trying, but these triangles are making me dizzy
i understand.
oooo. dust is breaking out of hod.
NUGT test $3.02 for third time in three day’s. Fourth times a charm?
The various possible wave counts illustriously posted by members here is awesome…. IMHO, very simply, a break below 1082-81 is required to test and break below 1078… On the upside gold price ought not to be able to get past 1091-93 range with 1096-97 on the outside limiting. Don’t think Gold price is going to be making it past 50% retrace of 1073/1104 at 1088-89 in a hurry. Taking out 1096-97 would then likely see Gold price look to rise towards 1105…. A gap between 1085-87 will likely get filled at some stage…
Only problem for the downside thus far, in the last few days – every time Gold price drops towards 1080 and weekly RSI begins to dip below 30, Gold price bounces back up without really testing weekly RSI to break below 29…. Appears Gold price is still stuck in range 1080/1098
All the endless levels and varieties of Elliott Wave can be confusing.
Any idea which way gold might go from here today?
Back up to finish the job of peaking above 1,094.98 or down to 1,071 or sideways the rest of the day?
The consensus is confusion. Regarding your question Richard, I think the best we can do is identify the move once it happens and position for the next move which should be clearer.
If the triangle is over, then I think we are either late in minor 4 or early in minor 5 of subminuette v (down to 1072 or lower).
Pleased I am not the only one!
Hopefully someone managed to pick up some DUST and benefit.
Richard, this is a difficult question to answer. The market has gone into consolidation mode (Bollinger bands are tightening) to digest the “weird” moves this morning. I am thinking aloud here. What if price drops below 1083.04? It is getting very close to that just now. If so, do we have a 11-wave triangle? 13 -wave? If that is the case, I’d rather go along with the downward scenario, that we are now in subminuette 5. The engine of submicro c seems to be sputtering.
It would be good if the market does us a favour by decisively breaking out in either direction to resolve this impasse. Until then, confusion is the order of the day.
I’m getting the feeling that 11:52 am was and will be the DUST high of the day at $38.45 when gold dropped to 1,083.10 and we’ll have to wait for Thursday for gold to drop down to 1,071.
Tham thanks, I was watching and ready to buy DUST if gold dropped below 1,083.04 low of today but didn’t happen.
I should of noticed that each day this week gold opened high and DUST cheap then gold dropped and DUST moved up between $3 and $4 each day.
So would of been best to take profits each day and buy again in the morning for Mega profits daily instead of getting profits daily then losing profits overnight.
Of course hindsight is 20-20.
Lara does recommend trading the swings instead of just holding for a bigger high..
“The simplest system for a downwards trend like this is to use resistance lines: each time price touches resistance that represents an opportunity to enter in the direction of the trend. Trades may be held until price either reaches support, a target, or if the trade is held for one day if you are a day trader.”
Richard. You have a sound strategy. I myself now swing trade intra-day. You are right that in this type of market setup it is unwise to leave positions overnight. I have found that the greatest movements are in the one hour or so when the market opens, and just before it closes. At other times, unless there is some strong external stimulus, the market goes into hibernation mode.
The odd day that I bought before the close because DUST was cheap it turned out that DUST opened up higher, so the patterns change.
Just follow the usual rule, buy low and sell high daily or overnight as long as gold is range bound and it has been in so for several days now.
Maybe minor 4 of subminuette v is a triangle. We are definitely getting a lot of practice with triangles this week.
that idea was invalidated
Any consensus on the direction of travel here?
dust look likes it is getting ready to go, hopefully this time we get over 39!
if it gets over 37.60, look out!
Gold just dropped $5 in 15 minutes from 1090 to 1,083.04 at 10:10 am
Is gold finished about to finish a down move before heading up to 1099 area?
Or is this the very fast and surprisingly short drop to 1071 area?
It hasn’t gone above 1,094.98 yet so doesn’t it still have to do that first.
I know Lara said it could end in as little as 6 hours and maximum 24 hrs.
“When submicro wave (C) can be seen as a complete five wave structure and has moved at least slightly beyond the end of submicro wave (A) at 1,094.98 avoiding a truncation, then look out for a trend change and a quick strong downwards movement.”
Hi Richard. JUst for sharing.
Sometimes it is not good being too circumspect before entering/exiting a trade. I have learned the hard way that we would lose a good many opportunities with this line of thinking.
I learned that there are two ways to overcome this. The first is a laissez faire style. Just buy based on whatever you fancy for trading, be it chart pattern, candlesticks, indicators, even gut feeling. Set appropriate stops and ditch with a modest loss should the tide goes against you. The majority of the traders do that; they don’t care two hoots about TA or fundamental analysis. To them, nothing ventured nothing gained.
That first way doesn’t appeal to my training and personality. I prefer this second way, in which I do careful analysis (due diligence) beforehand and work out various scenarios. When these point to one strong direction, I’ll enter the trade. For example, when price rose to 1092.64 premarket, failed to break 1094.88 and then dropped, that movement corresponds to either a strong third in the second possibility I described, or the completing fifth of c of y of submicro b. Both unequivocably point to a strong down move and so I entered when the market opened. I made a $1.20 gain in DUST in less than 40 minutes.
Tham, because you have trained yourself in Elliott Wave and also do your due diligence before the market opens you are more aware and ready and willing and able to jump on prime trading opportunities. You reap the just rewards $$,$$$ of your efforts that you sow and the skillset that you utilize. I am very happy you made profits on that quick run.
I myself have made more profits the last 30 days than in quite awhile and getting better at it as utilize Lara’s guidance since new down trend and also use a great set-up of advanced technical indicators by trading legend John Carter. However I should improve my Elliott Wave knowledge to increase the cash flow into Turbo mode like you Tham.
Morning Tham, Sounds like you already took profits on DUST? I also bought this morning it was a great setup , just like yesterday. Drop into support at $35.55, small bounce and retest of $35.55 and then up. My favorite type of entry point. I’m still holding DUST waiting to see what Gold does at 1082. Thanks again for all your EW counts
Good morning, Robert.
Sorry, took a break so I didn’t respond earlier.
My wave count indicates that in the next hour or so gold price will be dropping slightly, whether it is the submicro c move upwards or the minuette 5 move down. At the low to be made, gold will be correcting upwards by quite a bit. If you twist my arm, I would say the low in gold then will be the best time to exit DUST. If I were to hold DUST now (I don’t as I unloaded all at around 10:10 am), I would not want to be whipsawed by the rise in gold price. Recently, the drop in DUST price, once it gets underway, is quite substantial. I notice something like a one to two dollar drop.
Thanks Tham, I just exited on return to $38.46, Time to look for the next entry point, somehow that’s always a lot easier.
Great trade Robert. I that was almost a $3 gain on DUST for you since the open.
The price drop to 1084.31 has really thrown a spanner in the works. Judging by the numerous attempts by you good folks in trying to unravel this “anomaly”, there appears to be a plethora of possibilities. May I add in my own, for the purpose of sharing. Basically I see two possibilities.
The first is that the uptrend is continuing. Submicro b is a combination WXY ending at 1084.31, and now we are finally into submicro c. This idea is invalidated should price falls below 1084.31. Then, the n-waves triangle (where n is an odd number > 5) is underway.
The second possibility is that the triangle has already ended at 1094.88 and we are now in subminuette 5 down. This idea is invalidated if price fails to fall below 1084.31.
Latest: At this point in time with price sub-1094.88, I would deem the first possibility invalidated. (The n-waves triangle is too cumbersome to analyse, and I don’t know how it can be validated). We are now in the strong third subwave of subminuette 5 down.
Tham gold dropped to 1,083.04 at 10:10 am.
“the second possibility is that the triangle has already ended at 1094.88 and we are now in subminuette 5 down. This idea is invalidated if price fails to fall below 1084.31.”
Has a truncation happened along the way toward 1071 area or can gold still go up to 1099 area?
On second thought, I see another possibility. The movement down to 1083.04 can be all or part of the fifth wave of c of y of submicro b. And this means price can now begin its ascent towards 1099 (or lower).
Agreed. The 9 wave triangle is simply a regular triangle with a triangle for the last wave (triangles are deemed 3’s). I think this idea even resolves the truncation issue. I’m not sure will need Lara to confirm this idea
I agree. There is no problem with triangles with “extra” waves. If price drops further, we can simply have 11-, 13-, … wave triangles. The only way to tell is that the idea is invalidated if price drops below the BD triangle trendline.
Could it be (or have been) a 9 wave triangle?
I was just thinking about that, or a triangle to end a triangle, and came to post it and saw you beat me to it.
I think it’s a real possibility. Either that or Lara’s count is still unfolding. Or a third possibility – these are a series of 1’s and 2’s getting ready for an upside move per a totally different count based on different data feeds. I’m concerned that I’ve seen a few data feeds showing the big move down ending at around 1080, not 1071
Low today 1,084.31 at 4:32 am as per http://www.pmbull.com 1 minute count
Yeah that’s about right, was referring to the big wave 3 down on July 19. I see lows of 1180 and 1187 in some data feeds, different from Lara’s. That is significant to the count as it would be different based on those feeds.
I understand your concern about a third possible wavecount. I have become very cautious about reading interpretations into these drawn out corrective patterns. So I try to position my portfolio, and set stops, to allow for that possibility. Anyway, we are only $15 from Lara’s downside target and the upside potential after that is much larger than $15. Lara has also said that downside target could be met suddenly, and I presume at a time when I am not looking or cannot trade. Factor in how oversold everything is, and I don’t dare be net short.
That is certainly prudent I agree with that. I am short myself but am fully aware that the easy money has been made on the short side and i can get run over pretty easily right here so i’m not being super aggressive with it. That said, the 9 wave triangle idea is looking better and better at the moment.
Lara, what do you make of a count like this? It shows wave 4 of the ending diagonal as a 3 and I know your count depends on this same segment being a 5. I will say that Captainewave has been bullish for awhile now and keeps having to update his count with each new low, so has not been too accurate lately.
Fencepost, I recall you mentioning that you think we may bottom soon. Does something like this chart fit your thoughts?
http://www.gold-eagle.com/article/major-market-update-ewave-analysis
Captain ewave’s ending diagonal seems to break a rule in that it does not have wave -iii- shorter than wave -i- which is required for a contracting diagonal.
My view that we are forming a bottom in the miners is not based on EW. The EW alternatives to Lara’s count that I have looked at all seem to call for more down action, so what I am looking for is reduced downside momentum (wedging, truncations) and possibly a large portion of the wavecount moved up a degree. We could have an intense rally, especially in the miners, that relieves the oversold condition and then see that retraced most or all of the way over months.
As to Aiden’s question of whether this will be a bear market rally or a bull market, we won’t know that until we look back from years into the future. Keep in mind that Ron Rosen’s super bull EW count is legal but very low probability…we cannot bet on it, but if it comes to pass there will be a lot of EW counts that get rewritten once it has been proven. Even Rosen’s idea needs the current down wave structure to complete and I have not seen any detailed count from him showing how he expects it to complete.
There’s a few things wrong with that wave count which make it invalid. As fencepost below points out the third wave of that possible ending contracting diagonal is longer than the first. It must be shorter to meet the rule for wave lengths in a contracting diagonal. So that invalidates the count right there.
The whole thing is labelled as a fourth wave. Which makes no sense. It’s a diagonal, and fourth waves can be triangles but not diagonals. That also invalidates the count.
In the final zigzag for the fifth wave the triangle for the B wave looks all wrong. It’s not invalid, but it doesn’t look at all like a triangle.
And that right there is a good lesson in Elliott wave. There is a large amount of work online calling itself “Elliott wave” which does not meet the rules. It’s worse than useless, it’s misleading.
Anyone can put a chart up with a bunch of labels and call it an Elliott wave count, and they can make whatever they like fit however they like. I’ve even seen some absolute rubbish published on Kitco for goodness sake. But if it doesn’t follow Elliott wave rules as laid out in Frost and Prechter it’s not Elliott wave.
As you can tell I do find it somewhat annoying.
Lara, not sure if you’re up. Recent movement went in unexpected direction.
Is the recent dribble down to 1083 still part of submicro B and micro E is on schedule? Or can micro D be some kind of combination? Hoping you can post on direction by the time I wake back up for the early am. Thanks.
I’m up. And caffeinated. And comment is made above 🙂
Gold Drops as Lockhart’s Signal on Rates Adds to September Focus
August 4, 2015 — 8:38 PM EDT
http://www.bloomberg.com/news/articles/2015-08-05/gold-drops-as-fed-s-lockhart-signals-rates-may-rise-next-month
Avi Gilburt – Gold & Silver: Are you Feeling Bearish Yet?
First published Sat Aug 1 for members.
http://news.goldseek.com/GoldSeek/1438718400.php
Lara, Do you see the current down move as 5 wave? It made lower low few min back.
Hi Lara,
Just curious-why would you say this triangle pattern would break down? I’ve seen triangle patterns break either way up or down. In TA, triangle patterns are 50/50. Please advise. Thanks.
Rob
Rob with regular technical analysis triangle breakouts are 50/50.
Lara has mentioned several times over the years that Elliott Wave enables the investor to know the direction of the breakout.
Very interesting. Even though I’m new to EWG, however I’ve been trading for many years using TA. I’ve never been assured of a pattern breaking a certain direction. For a day trade, using last Thursday’s high as my breakout point for a long or the low for a short. In trading, you always have to be flexible and take what the markets give you. Thanks and good luck with your trade.
I would add that in EW, triangles are either the B wave or fourth wave (cannot be the sole corrective structure in a 2nd wave), so they are always corrections against the larger trend. If this is indeed a fourth wave triangle of a downward 5 wave structure, and not part of a combination or anything like that, I believe the breakout must be down.
Elliott wave triangles are analogous to pennant patterns.
I’m seeing this as a pennant, not a classic TA triangle.
Elliott wave triangles are continuation patterns. As are pennants.
Volume also favours a downwards breakout.
Lara,
Thanks for the follow up on downward momentum from last night. I will be looking for the top of the c wave to short down into 1071 or lower.
Ben
Rob, I will do the same. Buy DUST at upper target 1099 which Lara says may end short or overshoot a little. Then hold DUST until 1071 and Lara mentioned it may end a couple of dollars below it (so 1069). Checking if the 5 wave pattern is complete there and if not then gold may continue to the lower targets.
The Gold Guru has spoken. Thank you.
Lara you are right, it did breakout down.
In his exhaustive study of chart patterns, Tom Bulkowski provides multiple non-EW metrics on PENNANTS here…
http://thepatternsite.com/pennants.html
and distinguishes them from several types of TRIANGLES, for which he also provides metrics here…
http://thepatternsite.com/chartpatterns.html#T
Thanks Ted! Great stuff, further info on pennants. So far this one is ending in week 2. If it ends shortly it will still be a pennant as opposed to a triangle, but if it continues into next week it would be a triangle.