
Both Elliott wave counts expected more downwards movement for Friday, which is what happened.
Now is when the bull and bear wave counts diverge, and next week price may provide clarity.
Summary: For next week, the bear wave count expects downwards movement to continue, with an increase in momentum, and the bull wave count expects upwards movement. The critical trend line is the pink / green downwards sloping channel on both daily charts. A break above that channel would favour the bull, but while price remains within the channel the bear will be slightly favoured.
Changes to last analysis are bold.
It’s time to step back again and look at the bigger picture with weekly charts.
BEAR ELLIOTT WAVE COUNT
Click chart to enlarge.
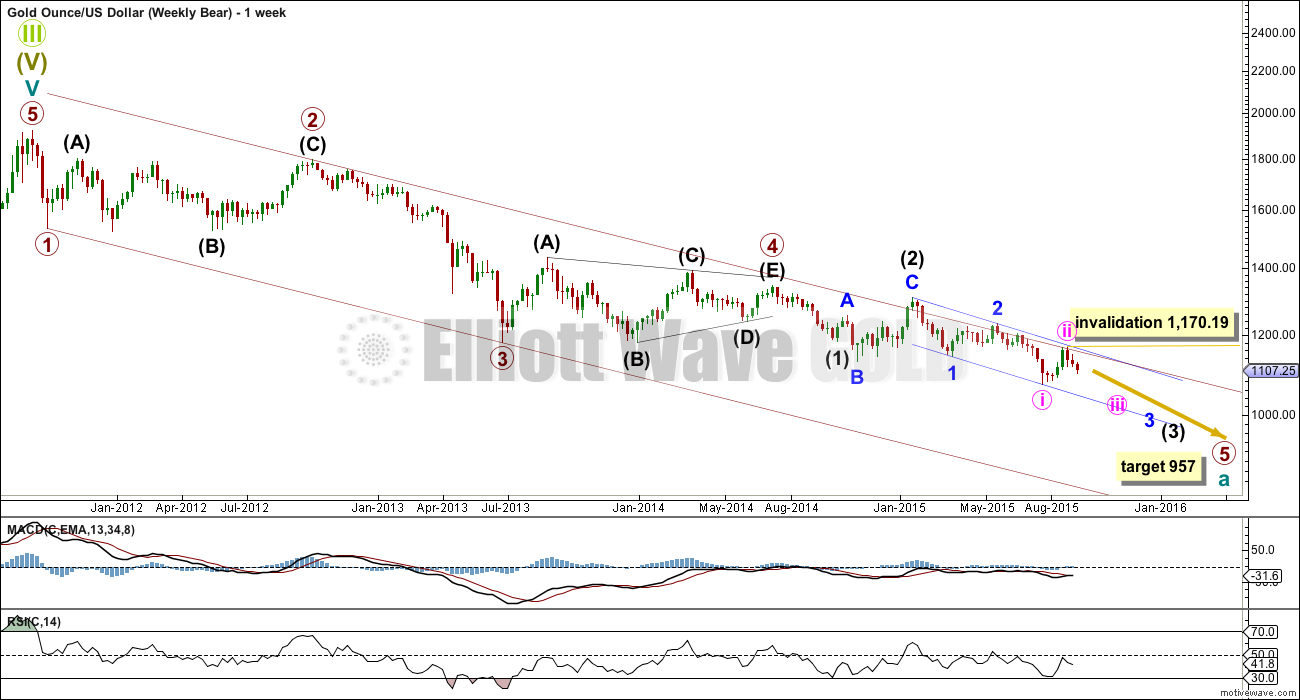
Gold has been in a bear market since September 2011. There has not yet been confirmation of a change from bear to bull, and so at this stage any bull wave count would be trying to pick a low which is not advised. Price remains below the 200 day moving average and below the blue trend line (copied over to the daily chart). The bear market should be expected to be intact until we have technical confirmation of a big trend change.
The maroon channel is drawn using Elliott’s technique about an impulse: draw the first trend line from the ends of primary waves 1 to 3, then place a parallel copy on the end of primary wave 2. The upper edge of this channel has been breached slightly twice during primary wave 5, which is a cause for concern and a reason to consider a possible bull wave count, but the breaches are not enough confirmation of a big trend change though.
A five wave impulse is unfolding lower from the all time high. The subdivisions all fit perfectly.
It is not possible to see primary wave 1 ending any earlier because it must be a five. Primary wave 2 was a deep 0.68 running flat lasting 53 weeks. Primary wave 3 was a perfect impulse and 12.54 short of 1.618 the length of primary wave 1. Primary wave 4 was a shallow 0.27 regular contracting triangle lasting 54 weeks. There is perfect alternation in depth and structure between primary waves 2 and 4. There is almost perfect proportion also, which gives the wave count a textbook perfect look at the weekly chart level. It is the proportion between the corrections of an impulse which give it the “right look”.
At 957 primary wave 5 would reach equality in length with primary wave 1.
Within primary wave 5, there is some concern that intermediate wave (2), minor wave 2, and now minute wave ii are all much bigger and time consuming than these corrections at these degrees normally are. This is the second reason for considering a bull wave count.
If price moves above 1,170.19, then this bear wave count would be invalidated.
Click chart to enlarge.
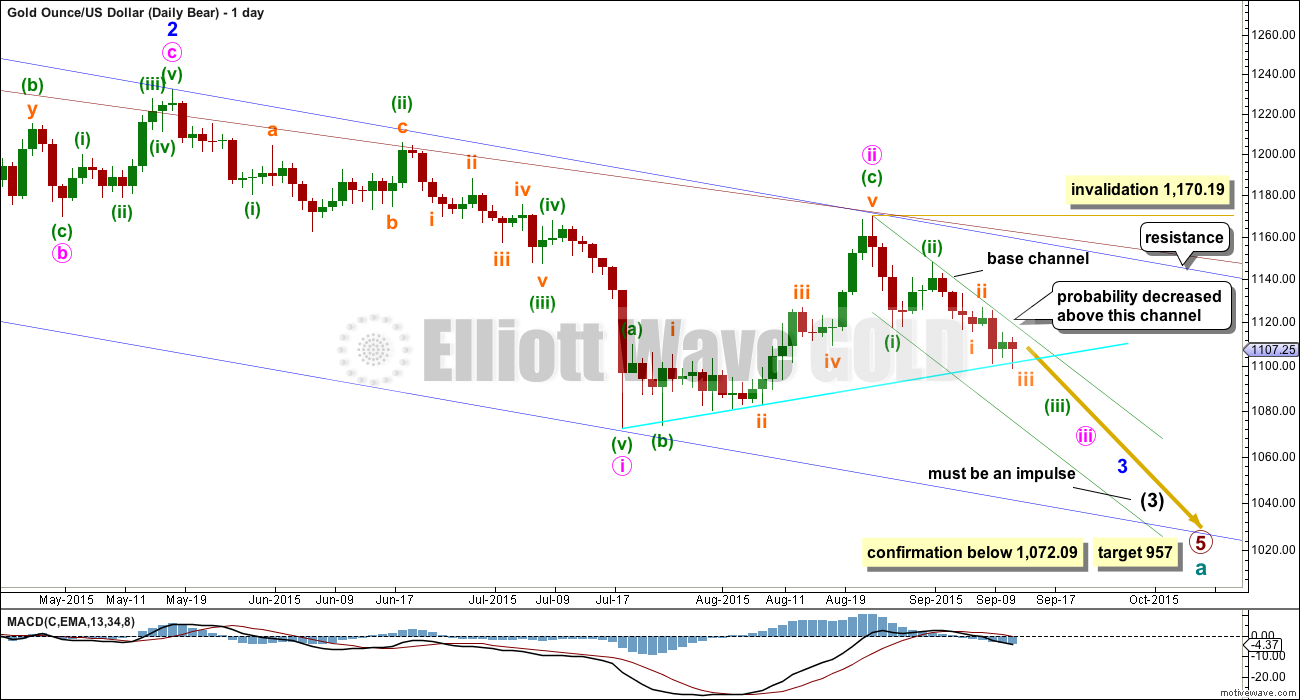
This wave count now sees a series of seven overlapping first and second waves: intermediate waves (1) and (2), minor waves 1 and 2, minute waves i and ii, minuette waves (i) and (ii), subminuette waves i and ii, micro waves 1 and 2 (on the hourly chart), and now minuscule waves 1 and 2. Minute wave iii should show a strong increase in downwards momentum beyond that seen for minute wave i. If price moves higher, then it should find very strong resistance at the blue trend line. If that line is breached, then a bear wave count should be discarded. The blue channel is copied over here from the weekly chart.
The blue channel is drawn in the same way on both wave counts. The upper edge will be critical. Here the blue channel is a base channel drawn about minor waves 1 and 2. A lower degree second wave correction for minute wave ii should not breach a base channel drawn about a first and second wave one or more degrees higher. If this blue line is breached by one full daily candlestick above it and not touching it, then this wave count will substantially reduce in probability.
Minuette wave (ii), if it were to continue, may not move beyond the start of minuette wave (i) above 1,170.19. A breach of that price point should see this wave count discarded as it would also now necessitate a clear breach of the blue channel and the maroon channel from the weekly chart.
An earlier indication of which wave count is correct would come from the green base channel drawn about minuette waves (i) and (ii). This channel too is drawn in the same way on both daily charts for bull and bear. Price must find resistance at the upper edge of this channel for the bear wave count. A breach of that channel would substantially reduce the probability of the bear wave count. Minuette wave (iii) should have the power to break below support at the lower edge of this channel. If that happens, then the probability of this bear wave count would substantially increase.
Full and final confirmation of this wave count would come with a new low below 1,072.09.
If primary wave 5 reaches equality with primary wave 1, then it would end at 957. With three big overlapping first and second waves, now this target may not be low enough.
Click chart to enlarge.
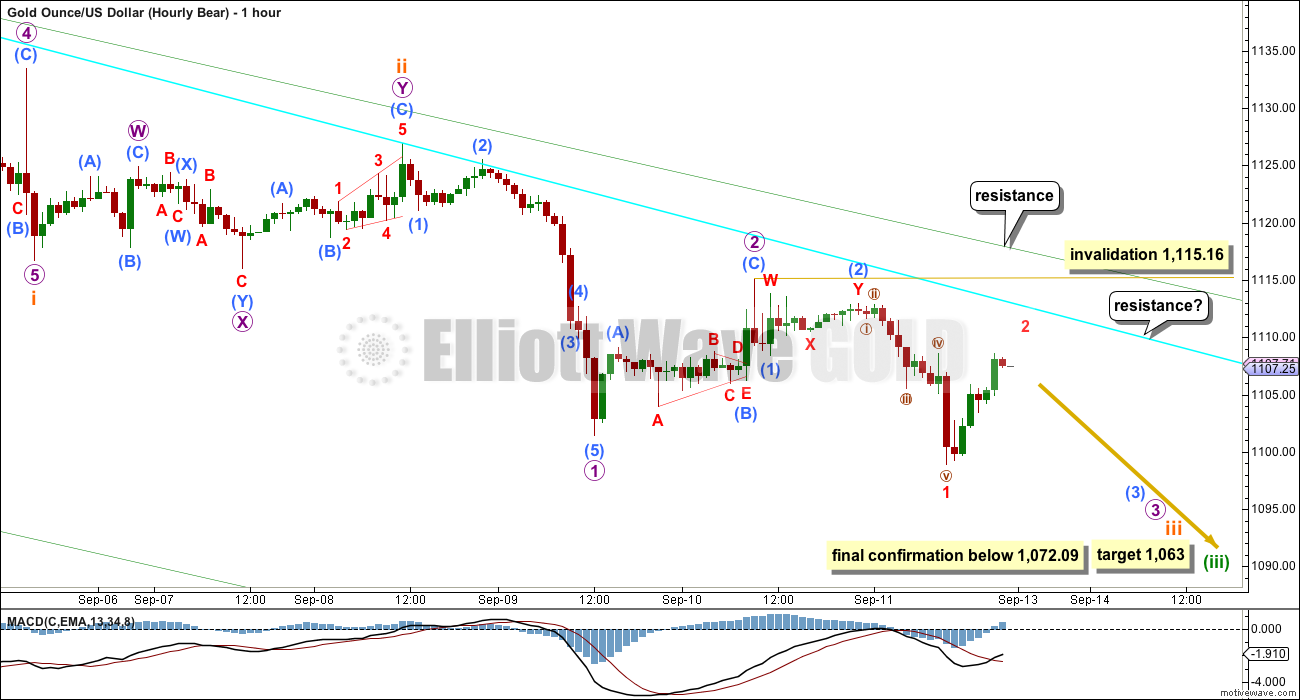
Another series of overlapping first and second waves has completed at the hourly chart level for the bear wave count.
A series of overlapping first and second waves is common for the start of an impulse when the third (or fifth) wave extends. It indicates a winding up of potential energy which is released in explosive movement when the middle of a third wave arrives. The strongest energy is very often seen in Gold’s fifth waves (typical of commodities), and Gold’s fifth waves within its third waves are commonly very swift and strong. We may see another price shock to the downside when subminuette wave v arrives.
At 1,063 minuette wave (iii) would reach 1.618 the length of minuette wave (i). If this target is wrong, then it may not be low enough. Expect any surprises over the next two weeks to be to the downside.
Minuscule wave 2 may not move beyond the start of minuscule wave 1 above 1,115.16.
Price movement above the green channel copied over from the daily chart would substantially reduce the probability of this bear wave count in favour of the bull. That trend line will be critical next week.
BULL ELLIOTT WAVE COUNT
WEEKLY – TRIANGLE
Click chart to enlarge.
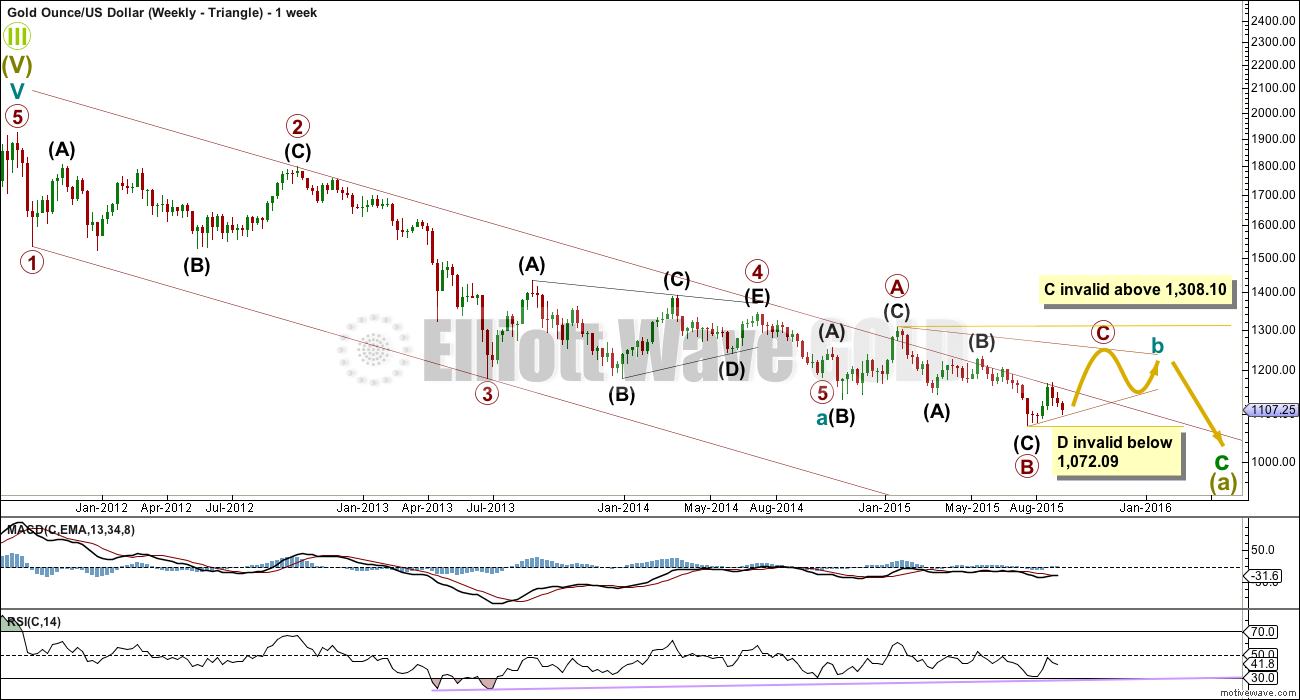
Both bull and bear wave counts are identical to the end of primary wave 4. Thereafter, the bear sees primary 5 incomplete, but the bull sees primary 5 as over, so the bull wave count sees cycle wave a as a complete five wave impulse.
Gold often exhibits surprisingly short fifth waves to follow its fourth wave triangles. Here primary wave 5 is 13.85 longer than 0.382 the length of primary wave 1. Primary wave 5 is slightly truncated by 2.66. The truncation is the biggest problem for this bull wave count (apart from a lack of technical confirmation of a cycle degree trend change), but because it follows a fourth wave triangle for a short fifth wave it is entirely possible.
I would not see cycle wave a complete at the next low labelled intermediate wave (B) for two reasons: it would be difficult to see primary wave 5 as a five wave impulse, and the wave up labelled intermediate wave (C) will not subdivide as a three and meet all Elliott wave rules. I know other Elliotticians have wave counts which do this, but I cannot see how the violation of the rules has been managed there. To see why intermediate wave (C) will not subdivide as a three, see the explanation in the video of 20th August at 10:28.
If cycle wave a ends with a slightly truncated fifth wave, then cycle wave b begins there. There are 23 possible corrective structures a b wave may unfold as (if all the different kinds of triangles and combinations are counted).
Within cycle wave b, primary wave A subdivides perfectly as an expanded flat, which is a very common structure. Primary wave B subdivides as a zigzag, also a common structure. Primary wave B is 1.89 the length of primary wave A. This is longer than the normal maximum of 1.38, but within allowable convention of 2.
When an A wave subdivides as a three the correction may not be a zigzag. It may be a flat, combination or triangle. This first chart looks at what a triangle would look like. The triangle would be a running contracting or barrier triangle. Within the triangle, primary wave C up must be a single or multiple zigzag. Primary wave C may not move beyond the end of primary wave A above 1,308.10.
Primary wave D may not move below the end of primary wave B at 1,072.09. But primary wave D has not yet begun, and so within primary wave C no second wave nor B wave may move below 1,072.09.
There is strong and persistent divergence between price and RSI at the weekly chart level going back to April 2013. This is a bullish indicator, but it does not tell us exactly where price will find a low.
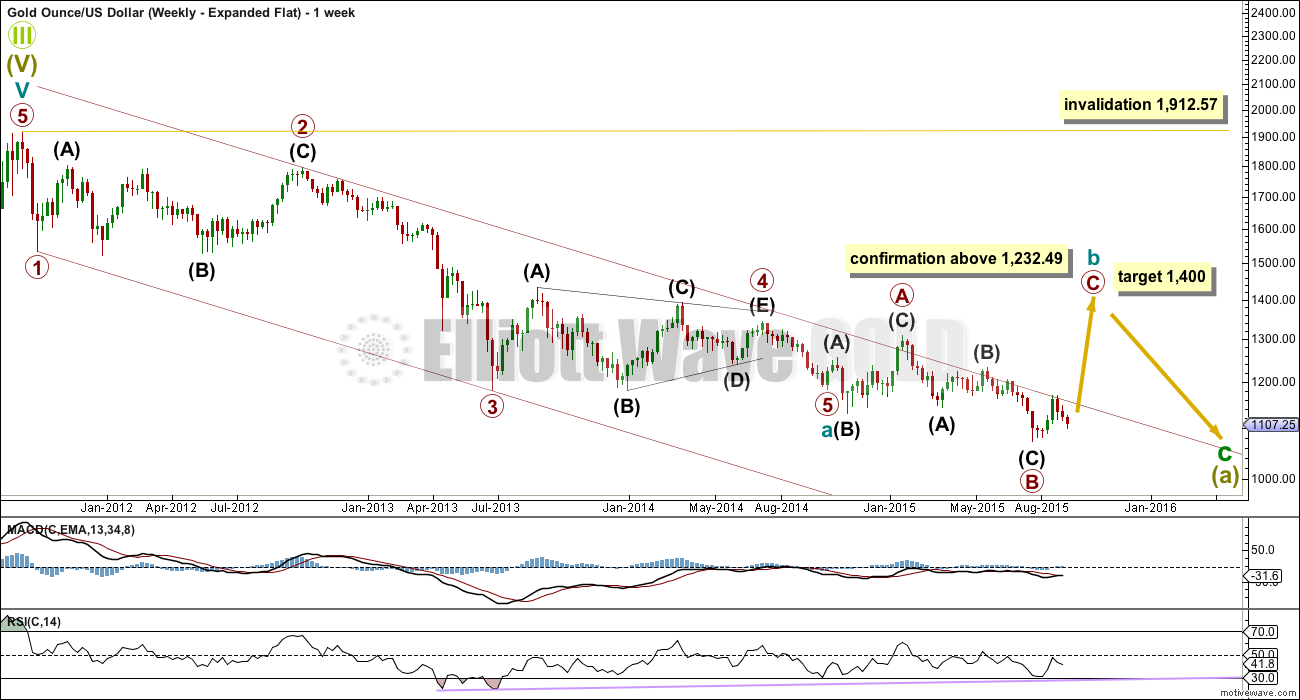
WEEKLY – EXPANDED FLAT
Click chart to enlarge.
Cycle wave b may also be a flat. Because primary wave B is over 110% the length of primary wave A, this would be an expanded flat, which are very common structures.
At 1,400 primary wave C would reach 2.618 the length of primary wave A. Primary wave C may only be a five wave structure, either an impulse (much more likely) or an ending diagonal.
Cycle wave b may not move beyond its start above 1,912.57 because cycle wave a was a five wave structure.
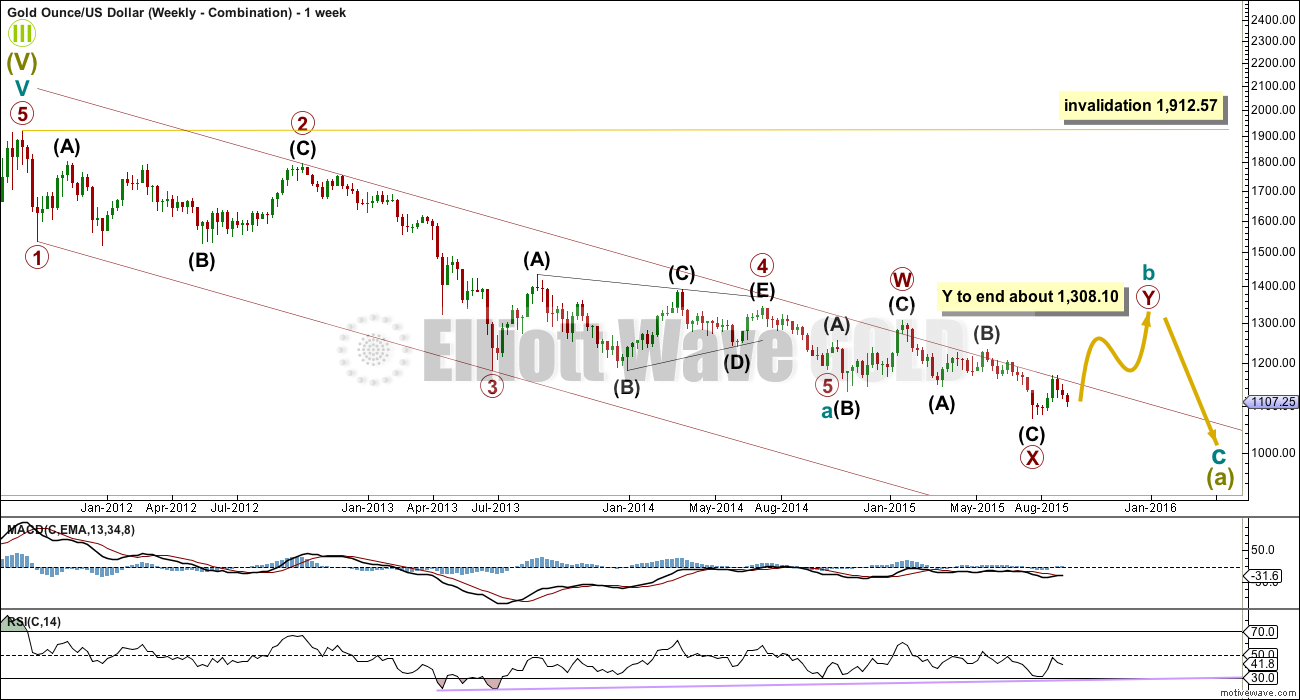
WEEKLY – COMBINATION
Click chart to enlarge.
Combinations are also common structures. In this weekly chart, the first structure in the double was an expanded flat labelled primary wave W. The double is joined by a three, a zigzag in the opposite direction, labelled primary wave X. X waves are most often zigzags and within combinations they may make new price extremes beyond the start of the first structure in the double.
Primary wave Y may be another flat for a double flat (they have the same purpose as double combinations), it may be a zigzag, or it may be a triangle for a double combination.
The purpose of combinations (and multiple flats) is the same as triangles. They take up time, move price sideways, and test our patience. The second structure in the double normally ends close to the same level as the first to achieve the sideways purpose. Primary wave Y would be expected to end about 1,308.10.
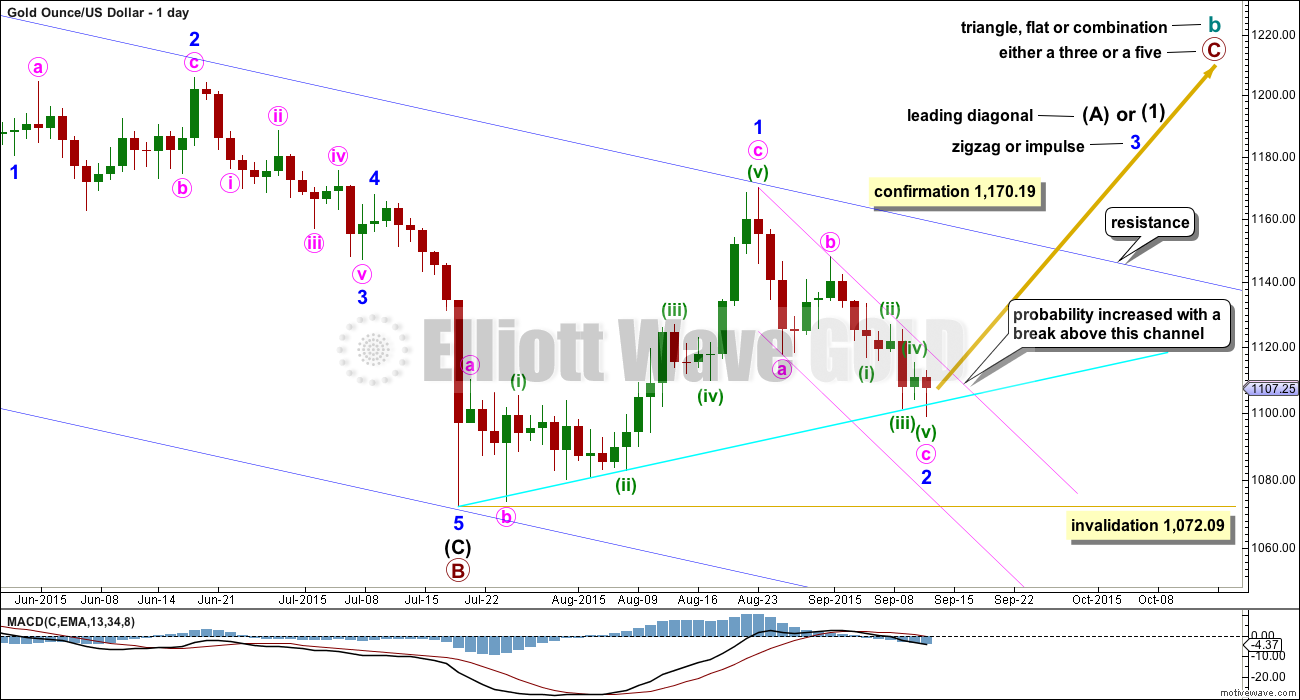
DAILY BULL ELLIOTT WAVE COUNT
Click chart to enlarge.
This daily chart works for all three ideas at the weekly chart level.
For all three ideas, a five up should unfold at the daily chart level for a movement at primary degree. This is so far incomplete. With the first wave up being a complete zigzag the only structure left now for intermediate wave (1) or (A) would be a leading diagonal. While leading diagonals are not rare they are not very common either. This reduces the probability of this bull wave count.
A leading diagonal requires the second and fourth waves to subdivide as zigzags. The first, third and fifth waves are most commonly zigzags, the but sometimes may appear to be impulses. So far minor wave 1 fits well as a zigzag.
Minor wave 2 may not move beyond the start of minor wave 1 below 1,072.09. If this invalidation point is breached, then it would be very difficult to see how primary wave B could continue yet lower. It would still be technically possible that primary wave B could be continuing as a double zigzag, but it is already 1.88 times the length of primary wave A (longer than the maximum common length of 1.38 times), so if it were to continue to be even deeper, then that idea has a very low probability. If 1,072.09 is breached, then I may cease to publish any bullish wave count because it would be fairly clear that Gold would be in a bear market for cycle wave a to complete.
To the upside, a new high above 1,170.19 would invalidate the bear wave count and provide strong confirmation for this bull wave count.
Upwards movement is finding resistance at the upper edge of the blue channel and may continue to do so. Use that trend line for resistance, and if it is breached, then expect a throwback to find support there.
In the short term, use the smaller pink channel drawn about the zigzag of minor wave 2 using Elliott’s technique for a correction as shown. Copy this channel over to the hourly chart. This channel is also drawn in the same way for the bear wave count, and there it is correctly termed a base channel. Both wave counts should expect upwards corrections for the short term to find resistance at the upper edge of this smaller channel.
I added a bright aqua blue trend line to this chart. Price has found support there and is bouncing up.
Today minor wave 2 can now be seen as a complete zigzag. It is 0.73 the depth of minor wave 1, nicely within the normal range of between 0.66 to 0.81 for a second wave within a diagonal. Downwards movement really should be over for this bull wave count. Minor wave 2 can technically continue lower next week, but further downwards movement will reduce the probability of this bull wave count.
A breach of the pink channel would provide trend channel confirmation that the zigzag of minor wave 2 is over and the next wave up for minor wave 3 should be underway. Third waves within leading diagonals are most commonly zigzags, but sometimes they may be impulses. Minor wave 3 should show some increase in upwards momentum beyond that seen for minor wave 1. Minor wave 3 must move above the end of minor wave 1 above 1,170.19. That would provide price confirmation of the bull wave count and invalidation of the bear.
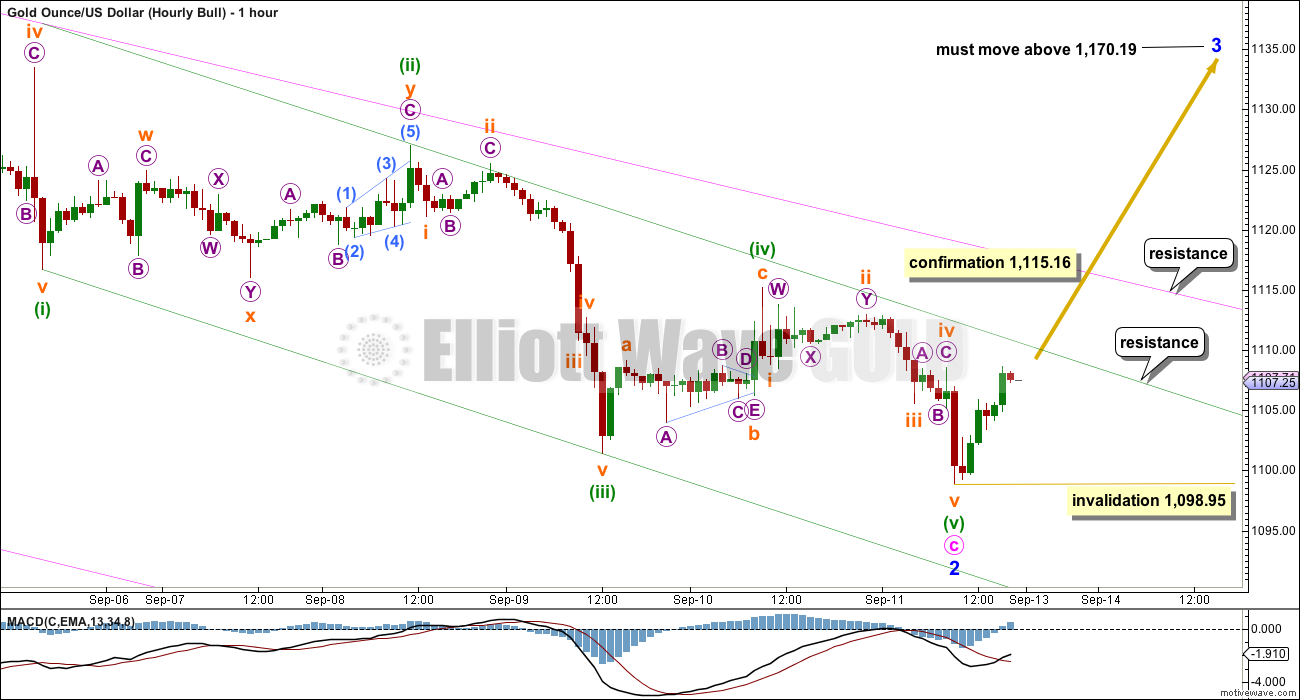
HOURLY BULL ELLIOTT WAVE COUNT
Click chart to enlarge.
Minute wave c is now a complete five wave impulse. There is no Fibonacci ratio between minuette waves (i) and (iii), and minuette wave (v) is 0.53 longer than 0.618 the length of minuette wave (iii). There is perfect alternation between the shallow 0.328 combination of minuette wave (ii) and the deeper 0.54 zigzag of minuette wave (iv). Minuette wave (iii) has the strongest momentum. This impulse looks complete and looks right.
Within minor wave 3, no second wave nor B wave may move beyond its start below 1,098.95. A new low below this point could be minor wave 2 extending lower, but this has a low probability.
Along the way up, price may first find resistance at the upper edge of the green channel. This is drawn about minute wave c using Elliott’s technique.
A new high above 1,115.16 would provide first price confirmation for this wave count. But, before I would have reasonable confidence in it, this wave count absolutely requires a breach of the pink channel on the daily chart with a full daily candlestick above it and not touching it.
TECHNICAL ANALYSIS
Click chart to enlarge. Chart courtesy of StockCharts.com.
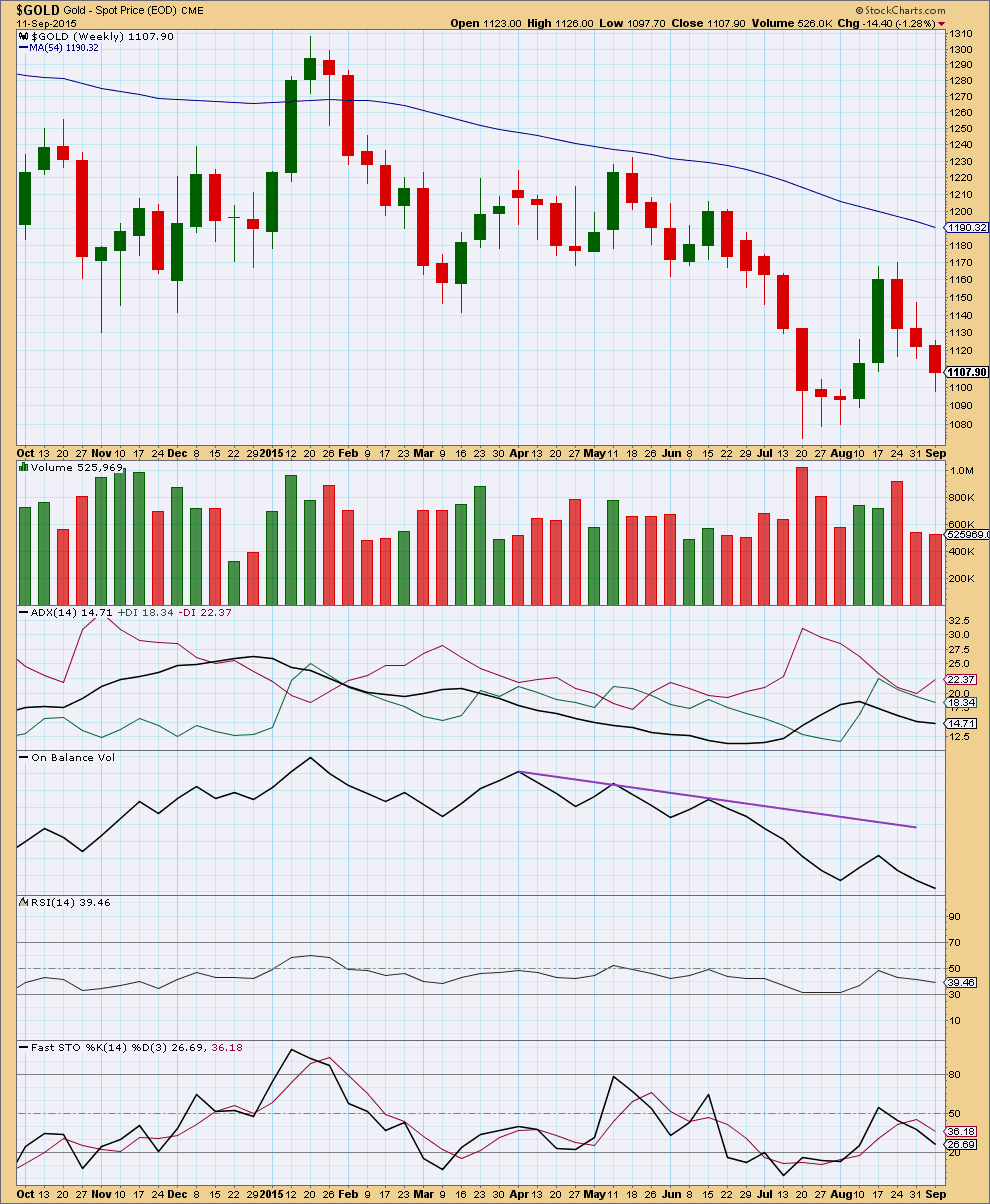
Weekly: This week ends with slightly lower volume than last week. Price has fallen on decreasing volume for three weeks now. The fall in price is not supported by volume and is suspicious. However, the market can fall of its own weight because it does not require an increase in sellers but only an absence of buyers to drive price lower. This has happened recently for Gold from the end of January to early February. During that time, price fell strongly for three weeks on declining volume and only in the fourth week of the downwards trend did volume begin to rise. The decline in volume here is some cause for concern, but it is not definitive.
On Balance Volume agrees with price, both are moving lower. This is some support for the fall in price.
However, there is hidden bullish divergence between price and OBV at the weekly chart level. While price has so far made a higher low OBV has made a slightly lower low. This indicates underlying strength for price.
RSI indicates there is room for the market to either rise or fall, as does Stochastics.
Overall and on balance, at the weekly chart level the regular technical analysis picture is somewhat more bullish than bearish.
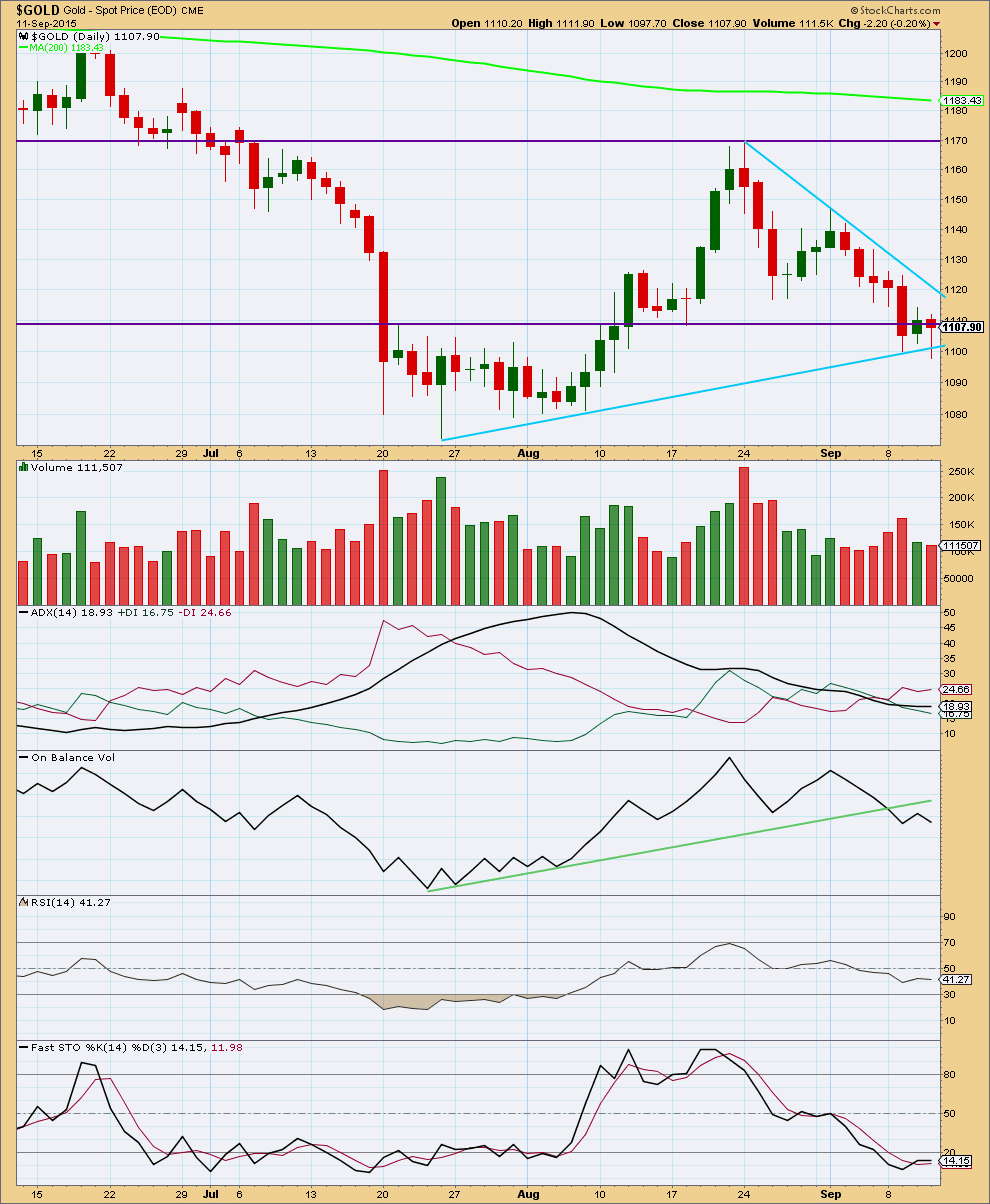
Click chart to enlarge. Chart courtesy of StockCharts.com.
Daily: Volume is light for Friday’s red candlestick, and with a small red body and long lower wick Friday looks corrective. This may be a correction within a downwards trend or it may favour the bull wave count.
As price falls there is some support with some rising volume since the last swing high at about 1,170. The strongest volume days in this fall are for down days. Overall the volume profile looks more bearish than bullish, but it is not as clear as it could be.
I have two sloping blue trend lines to show support and resistance. These are coming to cross, and price is being squeezed. This indicates a strong movement to come shortly, either up or down. The test and overshoot of the lower trend line may be the earliest indication the break will be more likely down than up.
ADX is flat indicating there is no clear trend and the market is range bound. If a range bound system is used here, then it would expect an upwards swing because price has reached to the lower horizontal line of support and Stochastics has reached oversold. However, trading a range bound market is more risky than trading a clearly trending market. The final swing never comes; that is when price breaks out of the range and begins a trend. The bear Elliott wave count has serious implications, because it expects a strong downwards move from here, so any expectation of an upwards swing must be approached with caution and good risk management.
While On Balance Volume remains below its trend line it is bearish.
RSI at the daily chart level is neither overbought or oversold. There is room for the market to rise or fall.
Overall the regular technical analysis picture is unclear. We may have more clarity next week.
This analysis is published about 09:10 p.m. EST.
DUST is firing going up and JNUG is firing going down signal 3:58
So appears gold is moving down.
Lara ,
do you think this upward correction is done for the bearcount?
I’m not sure, still working on it.
What I have so far is I’m changing the bear count a little to see the 5-3-5 down which is a zigzag for the bull labelled minute a-b-c as a 1-2-1 down for the bear which will be labelled minuette (i), (ii) and subminuette i.
So this correction will now be labelled at a higher degree for the bear, subminuette ii. It can’t move beyond the start of subminuette i at 1,141.55. But the point it should end is the upper edge of the base channel.
That pink / green channel on the daily and hourly charts is still critical. For the bear price should stop before or at the upper edge of that channel.
A break above that channel will switch the outlook from bear to bull.
This change may necessitate a quick video to outline it. That may make some happy 🙂
I hope you all had a wonderful weekend and are ready for this week!
thank you Lara,
i hope you had a wonderful weekend too
I’m just hanging out waiting to see what happens. Meandering today with a small favor to the Bulls. No new positions planned yet.
Tham:
Are you waiting the FOMC meeting to be completed before jumping into NUGT/DUST?
Thanks
Yes. That is the safest ploy.
Prices tend to whipsaw a day or two before, and it is difficult to get a clear trade.
1:45 pm looks like DUST went up and JNUG went down they switched directions
Gold And The Miners May Be About To Rally Sep. 14, 2015 8:32 AM ET
http://seekingalpha.com/article/3508036-gold-and-the-miners-may-be-about-to-rally
by an Elliott Wave analyst
Gold at 11:58 looks like some type of change in direction and DUST looks like it maybe double bottomed there and moving back up?
Before buying DUST.
Any Gold wave counts?
Retrace possible target from this morning drop may be 1107.42 then gold drops?
1109.79 – 1103.58= 6.21 x .618= 3.84
1103.58 + 3.84 = 1107.42
Any comments?
Gold just fired bullish last 15 minutes
Let us know DUST buy pt.
Looks like gold may have already hit the little increase to 1110 area that Lara had in her charts for a move up Monday then down if the bear wave count occurred.
So DUST is already up pre-market
Hi Richard,
sorry about my uneducated question, is DUST an inverse ETF on Gold miners?
So if gold and gold miners go down it would go up?
Yes DUST is a 3X Bear inverse of GDX miners ETF.
thanks
Ursula
Dust is 3xetf for short miners. Risky leverage etf.
One can trade 2xetf short miners using GDXS. If miners go down this goes up.
Papurdi, Have you traded GDXS?
I like the idea of 2x instead of 3x however,
the volume concerns me as much less liquidity.
DUST volume today now 2,869,143
GDXS volume today now only 13,298
So depending on the volume one trades it may be ok if low volume or difficult if higher volume.
If one traded 300 GDXS would there be a problem to exit fast within seconds without dropping your ask price? or if you hit market would they be sold at same price or at different prices?
Rambus post from late Friday. I added my own comments to his monthly gold chart with 2 possible paths to his price objective. These two possible paths also could line up with Lara’s Bull and Bear counts. The Blue path, which lines up with Lara’s Bull count, might actually have a better look because it would be another back test of the neckline. Something to think about….
http://rambus1.com/?p=44502
Commercials backed off on shorts a small amount last week.
Crazy Guy OMNI trader on Gold for Monday trading.
https://www.youtube.com/watch?list=UUez8uA1o_fDYsrSf4auWSjg&t=209&v=xkbOtHFp18c
I will wait for Lara’s EW count confirmation before making the trade.
Stockcharts summary of
Elliott Wave Basics
http://stockcharts.com/school/doku.php?id=chart_school:market_analysis:elliott_wave_theory
Just a View: After the drop to 1098-97 on Friday, Gold price made a small overshoot above 1108 on the rise…. Price weakness is seen at current levels and is probably good to short from here or anything above 1109 (a Fibo level) with strong overhead resistance seen between 1111-1116; notwithstanding a break above here would likely look to seek 1119-21-22 (a Fibo level, 10dma/50dma). A break above 1109 gives bullish bias…. Looks like a drop may likely only reach 1093-92 subject to a break below 1105.50, the COMEX close 1103.50, a Fibo level at 1096-95 and the lower band to contend with… It appears Gold price hammered in support at 1099-98 on Friday on the way up from the drop. I wouldn’t be surprised if Gold price does not break below here in a hurry…. Strong support is seen further down at 1087-86…. Dang, the bulls are still in it as long as the August monthly low 1080 and multi-year low 1073-72 is not taken out…. Currently a build up for a snap rally to occur is concerning….
Most important line in the report: :a series of seven overlapping first and second waves”.
Seven 3rd of 3rd waves are upon gold in coming week. ONLY NANO WAVES 1 AND 2 ARE LEFT???? If they do happen.
Great report Lara.
Gold bull wave count may have low probability brecause gold does not bottom l this. There is no sign of bottom pattern.
4 year bear market needs to resolve itself at the bottom. Gold’s crash in 2008 put in the bottom in 2009. Look at the bottom head and shoulder formed in March April.
There is no such bottom here yet. Gold is still trading inside the flag near bottom rail.
Next year March 7 years later gold may have bottom again????
Lara: Is it possible for cycle wave a wave 5 to complete before 89 weeks?
It is.
Sometimes when impulses start off slowly for Gold, once they pass the middle of the third wave they accelerate into a swift strong fifth wave.
For the bear that may be how it looks for primary 5.
And this comes with the caveat that it’s not confirmed yet by price.
Lara,
At what price would confirmation occur?
Lara wrote, “Full and final confirmation of this wave count would come with a new low below 1,072.09.”
MTLSD
I want to congratulate you on a high percentage profit day in multiple trades Friday. Smart, wise, strategic feel good trades that keep you safe and your profits safe. I’d say that is as good as it gets to end the weekend.
Frequent conservative, wise, intelligent trades add up like you did today and this month. That is what Lara suggests. That is what many traders want to be doing. Thanks for sharing.
Thanks Richard! Time for that wave 3 up in my trading account…
Lara: Good report. I hope it turns out to be bear next week.
Stockcharts provides option to add extra bars so that last candle is not against the right axis.
Under chart attributes in Extra bars block you can add 10, 20, 30 to have more space.
Chart Attributes
Period
Range
Bar
Gap
Extra Bars