
Price still has not confirmed or invalidated either the bear wave count or the bull wave count.
Summary: The bear wave count is close to even in probability with the bull wave count today. To the upside, a new high above 1,148.04 would see the bull wave count more likely than the bear. To the downside, a new low below 1,108.62 now would see the bear wave count more likely than the bull. Price may tell us this week which wave count is correct.
Changes to last analysis are bold.
To see the bigger picture on weekly charts click here.
To see a video explanation of the daily chart click here.
BEAR ELLIOTT WAVE COUNT
Click chart to enlarge.
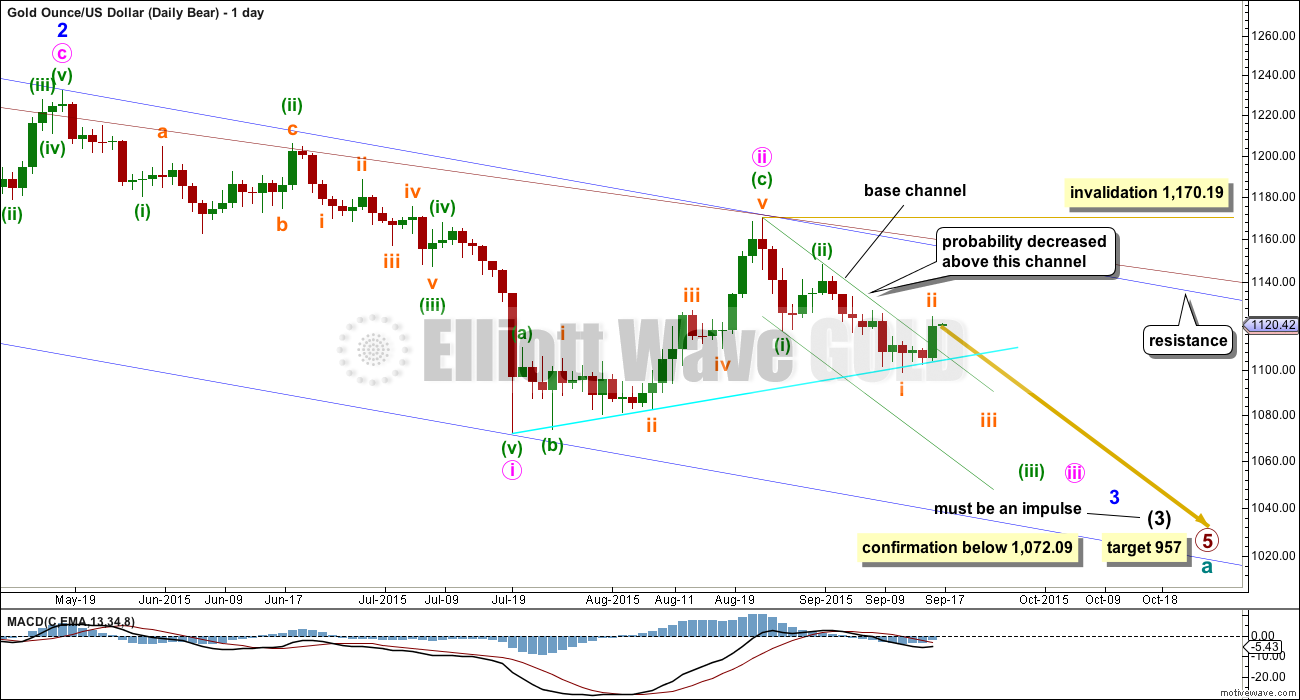
Gold has been in a bear market since September 2011. There has not yet been confirmation of a change from bear to bull, and so at this stage any bull wave count would be trying to pick a low which is not advised. Price remains below the 200 day moving average and below the blue trend line (copied over from the weekly chart). The bear market should be expected to be intact until we have technical confirmation of a big trend change.
This wave count now sees a series of five overlapping first and second waves: intermediate waves (1) and (2), minor waves 1 and 2, minute waves i and ii, minuette waves (i) and (ii), and now subminuette waves i and ii. Minute wave iii should show a strong increase in downwards momentum beyond that seen for minute wave i. If price moves higher, then it should find very strong resistance at the blue trend line. If that line is breached, then a bear wave count should be discarded.
The blue channel is drawn in the same way on both wave counts. The upper edge will be critical. Here the blue channel is a base channel drawn about minor waves 1 and 2. A lower degree second wave correction should not breach a base channel drawn about a first and second wave one or more degrees higher. If this blue line is breached by one full daily candlestick above it and not touching it, then this wave count will substantially reduce in probability.
Minuette wave (ii), if it were to continue, may not move beyond the start of minuette wave (i) above 1,170.19. A breach of that price point should see this wave count discarded as it would also now necessitate a clear breach of the blue channel and the maroon channel from the weekly chart.
An earlier indication of which wave count is correct would come from the green base channel drawn about minuette waves (i) and (ii). This channel too is drawn in the same way on both daily charts for bull and bear. Today this channel is overshot, and it is concerning that upwards movement came on increased volume. Today this decreases the probability of the bear wave count to about even with the bull. If this channel is breached by a full daily candlestick above the upper line and not touching it, then the bear wave count would further reduce in probability.
Full and final confirmation of this wave count would come with a new low below 1,072.09.
If primary wave 5 reaches equality with primary wave 1, then it would end at 957. With three big overlapping first and second waves, now this target may not be low enough.
Downwards movement from the high labelled minute wave ii subdivides 5-3-5. For the bear wave count, this is minuette waves (i) and (ii) then subminuette wave i, and for the bull wave count, this is minute a-b-c. The whole of a zigzag and the start of an impulse have exactly the same subdivisions.
Click chart to enlarge.
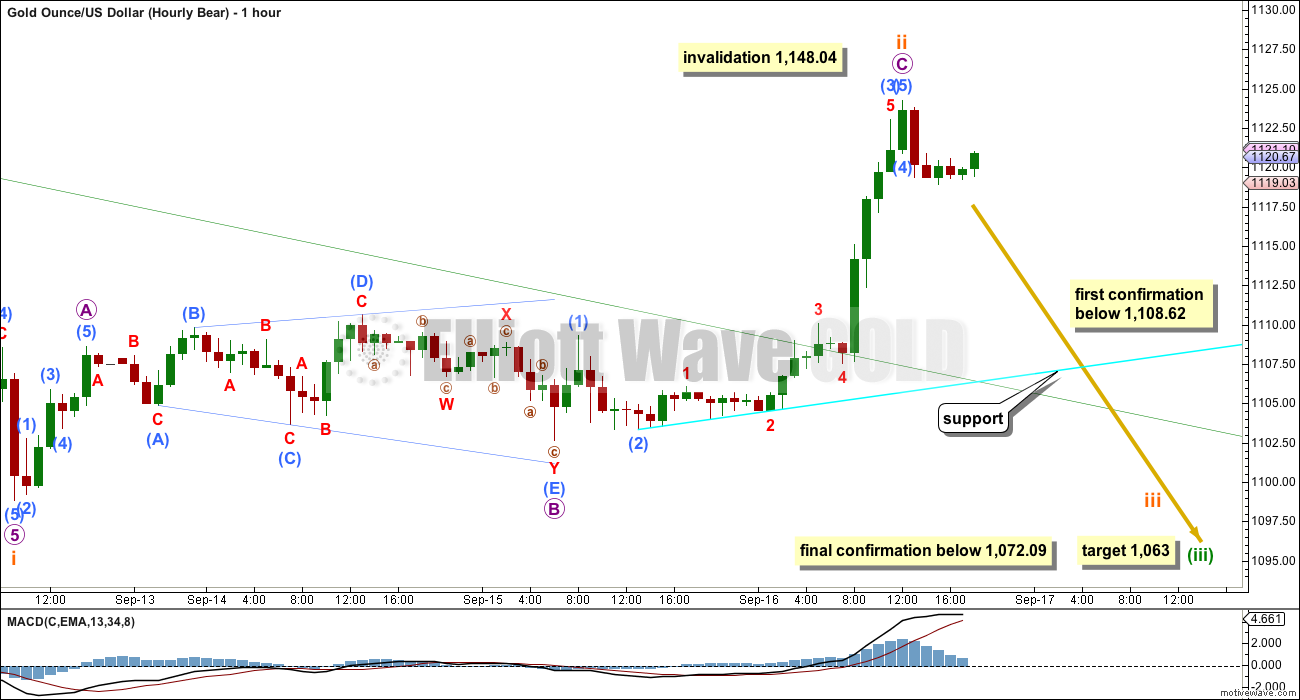
Subminuette wave ii may have continued higher as a zigzag. There is no Fibonacci ratio between micro waves A and C.
Micro wave C is a complete five wave impulse on the five minute chart, and within it there is an extended fifth wave to end sub micro wave (3).
Subminuette wave ii has breached the green base channel which is drawn about minuette waves (i) and (ii) on the daily chart and copied over here. Lower degree second waves should not breach base channels drawn about first and second waves one or more degrees higher. This is almost always the case, but almost always is not the same as always. Occasionally lower degree second waves do breach base channels; these channels just do not always work. The probability of this wave count is today reduced, but it remains valid. I have seen base channels not work before.
A new low below 1,108.62 would invalidate the bull wave count at the hourly chart level, and would provide some confidence in this bear wave count.
Price, on the way down, may find support at the bright aqua blue trend line. If this line provides support before it is breached, then price may throwback to the line to find resistance. When price behaves like that it can offer a good entry point for a trade in the direction of a trend.
The target for minuette wave (iii) remains the same at 1,063 where it would reach 1.618 the length of minuette wave (i).
The sideways movement labelled micro wave B may be seen as an expanding triangle for this bear wave count. This has the best fit in terms of subdivisions; the bear fits much better than the bull for this piece of movement.
BULL ELLIOTT WAVE COUNT
Click chart to enlarge.
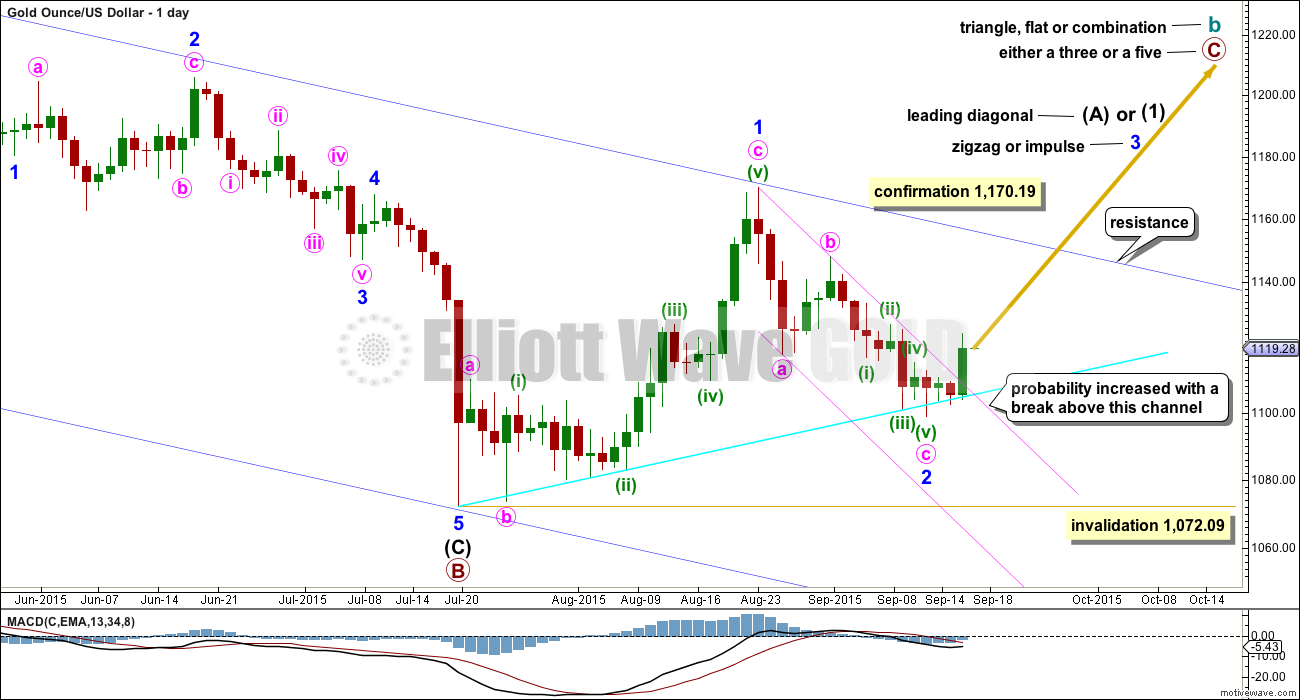
The bull wave count sees cycle wave a complete and cycle wave b underway as either an expanded flat, running triangle or combination. This daily chart works for all three ideas at the weekly chart level.
For all three ideas, a five up should unfold at the daily chart level for a movement at primary degree. This is so far incomplete. With the first wave up being a complete zigzag the only structure left now for intermediate wave (1) or (A) would be a leading diagonal. While leading diagonals are not rare they are not very common either. This reduces the probability of this bull wave count.
A leading diagonal requires the second and fourth waves to subdivide as zigzags. The first, third and fifth waves are most commonly zigzags, the but sometimes may appear to be impulses. So far minor wave 1 fits well as a zigzag.
Minor wave 2 may not move beyond the start of minor wave 1 below 1,072.09. If this invalidation point is breached, then it would be very difficult to see how primary wave B could continue yet lower. It would still be technically possible that primary wave B could be continuing as a double zigzag, but it is already 1.88 times the length of primary wave A (longer than the maximum common length of 1.38 times), so if it were to continue to be even deeper, then that idea has a very low probability. If 1,072.09 is breached, then I may cease to publish any bullish wave count because it would be fairly clear that Gold would be in a bear market for cycle wave a to complete.
To the upside, a new high above 1,170.19 would invalidate the bear wave count and provide strong confirmation for this bull wave count.
Upwards movement is finding resistance at the upper edge of the blue channel and may continue to do so. Use that trend line for resistance, and if it is breached, then expect a throwback to find support there.
In the short term, use the smaller pink channel drawn about the zigzag of minor wave 2 using Elliott’s technique for a correction as shown. Copy this channel over to the hourly chart. This channel is also drawn in the same way for the bear wave count, and there it is correctly termed a base channel.
This channel is not yet clearly breached. A breach would be a full daily candlestick above the upper pink line and not touching it. So far the channel is overshot. How price behaves in the next 24 hours will provide further indication of which wave count is correct.
I added a bright aqua blue trend line to this chart. Price has found support there and is bouncing up.
Minor wave 2 can now be seen as a complete zigzag. It is 0.73 the depth of minor wave 1, nicely within the normal range of between 0.66 to 0.81 for a second wave within a diagonal. Downwards movement really should be over for this bull wave count. Minor wave 2 can technically continue lower this week, but further downwards movement will reduce the probability of this bull wave count.
A breach of the pink channel would provide trend channel confirmation that the zigzag of minor wave 2 is over and the next wave up for minor wave 3 should be underway. Third waves within leading diagonals are most commonly zigzags, but sometimes they may be impulses. Minor wave 3 should show some increase in upwards momentum beyond that seen for minor wave 1. Minor wave 3 must move above the end of minor wave 1 above 1,170.19. That would provide price confirmation of the bull wave count and invalidation of the bear.
Click chart to enlarge.
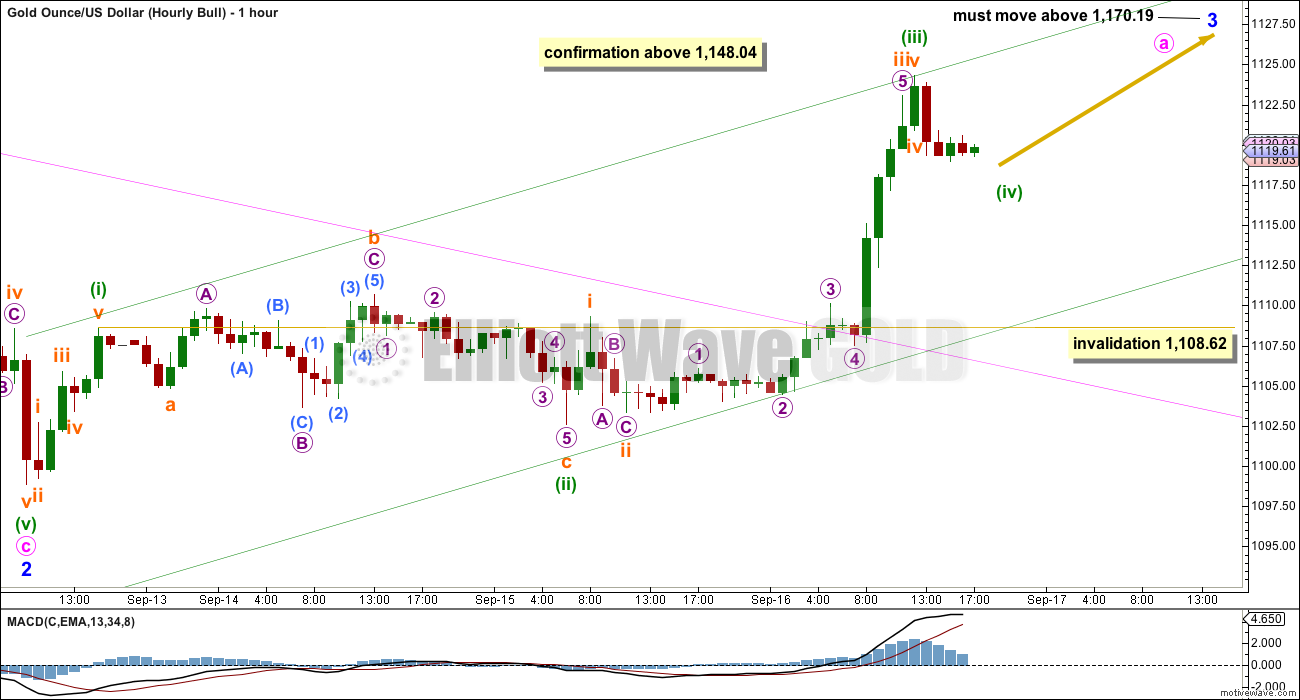
The bull wave count sees the subdivisions of minor wave 2 down as 5-3-5 for a complete zigzag.
Because the bull wave count sees a leading diagonal unfolding upwards, with the third wave of the diagonal just beginning, a zigzag up is most likely. Third waves (as well as first and fifth) within leading diagonals are most commonly zigzags, but sometimes they may also be impulses.
Minuette wave (ii) cannot be seen as an expanding triangle for this bull wave count because a second wave correction may not have its sole corrective structure as a triangle. Minuette wave (ii) is seen as an expanded flat, but within it subminuette wave c does not look like a clear five wave structure. This problem remains with the bull wave count.
Minuette wave (iii) may now be over. Draw a channel about this upwards movement: draw the first trend line from the highs labelled minuette waves (i) to (iii), then place a parallel copy lower down to contain the whole movement. Minuette wave (iv) may find support at the lower edge of the channel.
Minuette wave (iv) may not move into minuette wave (i) price territory below 1,108.62. This price point is critical today for both wave counts. A new low below that point would confirm that the prior wave up was most likely a three, not a five. That would be another three up, while downwards waves are subdividing as fives. The probability that the trend is up at that stage would be very low indeed.
Upwards movement to a new high above 1,148.04 would provide reasonable confidence in this bull wave count.
TECHNICAL ANALYSIS
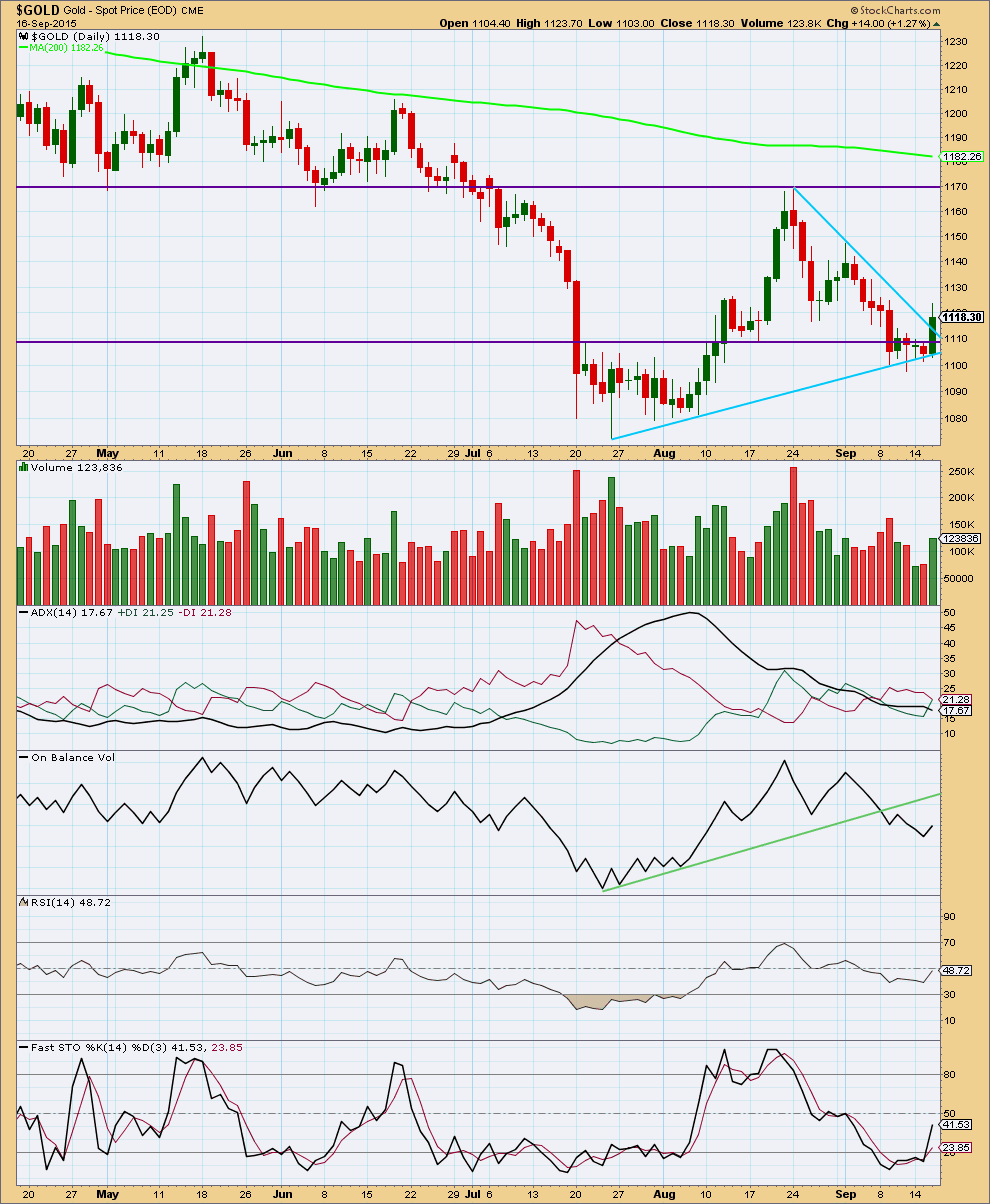
Click chart to enlarge. Chart courtesy of StockCharts.com.
Daily: Upwards movement for Wednesday comes on increased volume indicating a potential upwards breakout, which favours the bull wave count. However, volume is lower than a prior recent downwards day of 9th September, so this is not definitive. This volume spike may also be a spike at the end of a movement, a false breakout. This happened last on 18th June for a strong upwards day, right before a sustained fall in price.
Overall, from the last swing high at 1,170 on 24th August, as price falls it comes on declining volume. There is some small support for the fall in price: each wave down has increasing volume, but the whole movement from its start has overall declining volume. The picture remains unclear.
The strongest volume days in this fall are for down days. Overall the volume profile looks more bearish than bullish, but it is not as clear as it could be.
ADX is flat indicating there is no clear trend and the market is range bound. If a range bound system is used here, then it would expect an upwards swing because price has reached to the lower horizontal line of support and Stochastics has reached oversold. However, trading a range bound market is more risky than trading a clearly trending market. The final swing never comes; that is when price breaks out of the range and begins a trend. An upwards swing may possibly be developing at this stage. While the Elliott wave bear count remains valid the risk that a bear market may still be intact must be acknowledged. Good money management on any bullish trades is essential.
While On Balance Volume remains below its trend line it is bearish.
RSI at the daily chart level is neither overbought or oversold. There is room for the market to rise or fall.
Overall the regular technical analysis picture remains unclear. We may have more clarity this week.
This analysis is published about 08:07 p.m. EST.
9-17-15
Thank you Lara. Your prep for this FOMC was fantastic. I’ve been appreciating your commenting at end of day before your new post. Your descriptions of price activity have become more concise and clear I think.
Also, I really like the added callouts and notations you are doing: like the ones on 9-16 daily bull chart– showing that a wave must be a particular type of structure, and on the hourly bull stating on the chart that minor 3 must move above 1170.19. Having a first confirmation (as on the bear) added to a final confirmation is good too. This is GREAT stuff for visual people.
Oh, and I liked watching your motive wave exercise on September 11. I do hope you will do a video on how to pick waves. I know that sounds ridiculous to someone who does it naturally….but try and explain it. (I bet you’d do a good job of it.)
Really appreciate that you are committed to continually improving. It’s a mark of excellence. Best wishes on your CMT prep.
As always, dsprospering
Lara
Is there any way we could of gotten advanced warning of this “correction rally”?
I understand that Avi Gilburt has numerous Elliott Wave errors in his charts.
However he did made a timely call at last Friday’s lows to Buy miners for a correction rally. Silver confirmed above 14.75 on Wednesday that forecast for the correction rally.
Is there any way that your EW analysis can also provide more Buy signal opportunities like that as I don’t know how high gold will go and to wait for above 1,148.04 confirmation to buy some miners makes a huge price difference between their price at 1148.04 and Fridays gold low of 1,097.70.
Avi stated that Friday was not expected to be the final low as that would be months from now. However a correction rally sounds good to trade, not sure how long $50 more or less?
I understand lately EW has been tricky and giving any ‘Buy’ signal even trickier.
I blame my impatience on the choppiness.
Any comment would be appreciated. Thank you.
Gold Price, Silver Price And Miners Are “Bottoming”
September 15 – Avi Gilburt
http://www.gold-eagle.com/article/gold-price-silver-price-and-miners-are-%E2%80%9Cbottoming
Richard
If I remember rightly he said to buy buy buy for a long term view when it gets into the blue box, that blue box was pretty big and it had only just entered it. I maybe wrong but that’s what I remember of it.
k2ashley yes Avi did mention buy in the blue box.
Richard, I have to chuckle. Lara has had a bull wavecount for a while, the COT has been very bullish for a while, seasonals are bullish, GDX daily stochastics have been pregnant with bullishness for a week or more and made the bullish crossover this week, and several members of this discussion board have let it be known they were bullish.
Nothing was certain, but it should have been clear that a rally was possible.
Will the rally stall at 1147 or run up over 1400? Will it be a blistering short-covering rally that gets to 1400 in 10 days? Or will it chop us all to pieces as it takes months to get there? I wish I knew the answers.
I think if you keep doing what you do well you will do fine.
fencepost, I should of paid more attention to the many bullish signs. Thanks for the encouragement.
Richard, maybe you missed it, but I posted the same link and Avi’s GDX chart in the comments for the 15th, so you had an extra day to review Avi’s work. There was plenty of time to go long if you wanted to. Things could have turned out different if the Fed made a different decision, so hard to call in advance.
Yes you posted it 2 days ago. Fed week many do sit out due to many reasons including FOMC direction unknown.
Both wave counts remain valid.
With a full daily candlestick above the trend line of the base channel now for the bear it’s probability has been reduced.
The bull has increased, it had trend channel confirmation.
The bear no longer really makes sense with the very short term structure, I am going to spend some time looking at subdivisions of the last wave down which I have labelled minuette (i), (ii) and subminuette i, to see if that could be one complete five wave impulse. At this point I don’t think that will work. If it does work then it would explain the breach of the channel for the bear.
The final determinator for the bull is that blue trend line. It’s long held and repeatedly tested, it’s highly technically significant. We need that trend line to be breached properly on the daily chart to have confidence that the market has switched from bear to bull.
I’m still going to be cautions with a bull count while price is below that line. That would be picking a big change (primary degree) and picking a multi year bottom to call a bull market right now. I would rather have confirmation.
A less than $15pog increase on today’s fed news is not very convincing of a gold bottom.
Good call on maintaining the bear
With options expiration tomorrow and overwhelming high open interest in OTM calls I would expect the market makers to keep miners prices muted at this level. Hard to see GDX close above $15-$16 tomorrow….my bet would be a close below $14.50 tomorrow. May prove to be one of those days that leaves you scratching your head when gold rises and miners are flat…thanks to market makers/manipulators of course!
I’d be grateful if you would give a URL for where the open interest by strike price info can be found.
here you go my friend…
http://www.nasdaq.com/options/
simply enter in the symbol and hit get option chain
Any wave counts?
Was high at 1,133.60 at 2:58 pm the top of the 5th wave?
That’s what i think, both counts still alive, long DUST now
May be extended 5tth on bear wave count?
I like to know if this is the end of subwave ii.
Like to buy DUST here at cheaper price.
Bears lost today with a break above 1131 likely setting up 1099-98 as interim bottom… Hard to see Gold price back below 1115 in a hurry…
No raise is bearish for Gold. Signals Fed is not concerned about inflation. I don’t think gold goes much higher before reversal down.
Interest rates remain as is not increased at this time, will be later this year
Text of FOMC decision
Sept 17, 2015 2:03 p.m. ET
http://www.marketwatch.com/story/text-of-fomc-decision-2015-09-17
Richard
Thanks for info.
If gold drops below 1108.62 bear wave count chances will improve.
“A new low below 1,108.62 would invalidate the bull wave count at the hourly chart level, and would provide some confidence in this bear wave count.”
anyone taking any kind of stand prior to the news? Or just wait and see approach. I’d like to be long, but am flat right now and may stay that way and just watch. Still considering.
I’ve been long since gold went below 1100.
nice. I’m bullish myself midterm, but i trade very short term and charts are not speaking to me about what will happen today. Typical for fed day. I tend to lose money betting pre-fed announcement so I’m leaning towards just watching for once
The news event is a distraction and a hazard.
I can make the case that, in currency markets (and I include gold there) you always have a position. Given that, and the realization that this hazard can cut two ways, I am positioned on the fence.
Volatility is starting to increase. I think we might look back at the current rates, after the Fed’s announcement, in a nostalgic way.
Yes volatility increases for quite a while after rate increases.
Oscar take on daily market. Gold is covered at after 5:30 minute.
https://www.youtube.com/watch?t=569&v=ln3vBFIUjXg
BUY, BUY, BUY – Elliott Wave expert – AVI Gilburt told his subscribers at last Friday bottom. Wednesday Silver confirmed his price target of $14.75 as the start of a corrective rally.
According to this article by Avi. Last Friday may have been the bottom for awhile and today Silver broke out above $14.75 in a corrective rally but he expects the market final bottom in couple of months or in 2016.
A break out through the 14.75 level Silver would suggest that a bottom to the b-wave has already been struck.
Gold Price, Silver Price And Miners Are “Bottoming”
September 15 – Avi Gilburt
http://www.gold-eagle.com/article/gold-price-silver-price-and-miners-are-%E2%80%9Cbottoming
I clicked through to his charts and had a look.
For his GDX chart (looks at long term from the all time high) the A wave subdivides as a three, but the B wave is less than 90% of the A wave.
It’s not a double either because the C wave is labelled as a five.
That’s not a valid wave count. It does not meet the rules of a flat, zigzag nor a double zigzag.
EW chart for GDX – Claims Wednesday September 16th is long term bottom for GDX.
https://www.dropbox.com/s/ew8cwat7c67iz2a/GDXtrend.png?dl=0
Chart done by cfetrader
Is that elliot wave? The conclusion may be correct but I don’t think Lara would approve of this labeling 🙂
You’re right.
It violates the rules as set out in Frost and Prechter.
It’s not Elliott wave. Or at least, it’s not a valid Elliott wave count.
I suspect with the term “pitchfork” in there it’s not actually trying to be Elliott wave… it’s something else?
THURSDAY, SEPT. 17
2 pm FOMC statement
2:30 pm Janet Yellen press conference
This site also has the fastest news at 2:00 pm news.
http://www.marketwatch.com/newsviewer
While these trend lines may not show the exact point, they do make you wonder if Silver is due for a bounce.
90% of Traders are Always Wrong at Major Turns – 16 September 2015 – By Gary Savage
http://news.goldseek.com/GoldSeek/1442434675.php
what is the target for bleu 3??
The target for minor wave blue 3 in the bear daily chart is unknown until gold gets further down. My wild guess might be around 1020.
In the bull hourly chart, minor wave 3 must move above the end of minor wave 1 above 1,170.19.
For bear minor 3, my target us 1042-1045.