
Both Elliott wave counts remain valid today.
Summary: Upwards movement favours the bull Elliott wave count, but it is not enough to invalidate the bear Elliott wave count. I am changing the bear wave count slightly to see this upwards movement as minuette wave (ii), one degree higher. The bear wave count expects a little more upwards movement to 1,143. The bull wave count expects overall upwards movement and would be confirmed with a new high above 1,170.19. Short term both wave counts expect some sideways movement for a correction. If price remains above 1,124.28, we will not have clarity; if this correction dips below 1,124.28, the bull wave count would be favoured. At this stage, I favour neither bull nor bear wave count and expect that clarity will come this week and will let price tell us which one is correct.
Changes to last analysis are bold.
To see the bigger picture on weekly charts click here.
To see a video explanation of the daily chart click here.
BEAR ELLIOTT WAVE COUNT
Click chart to enlarge.
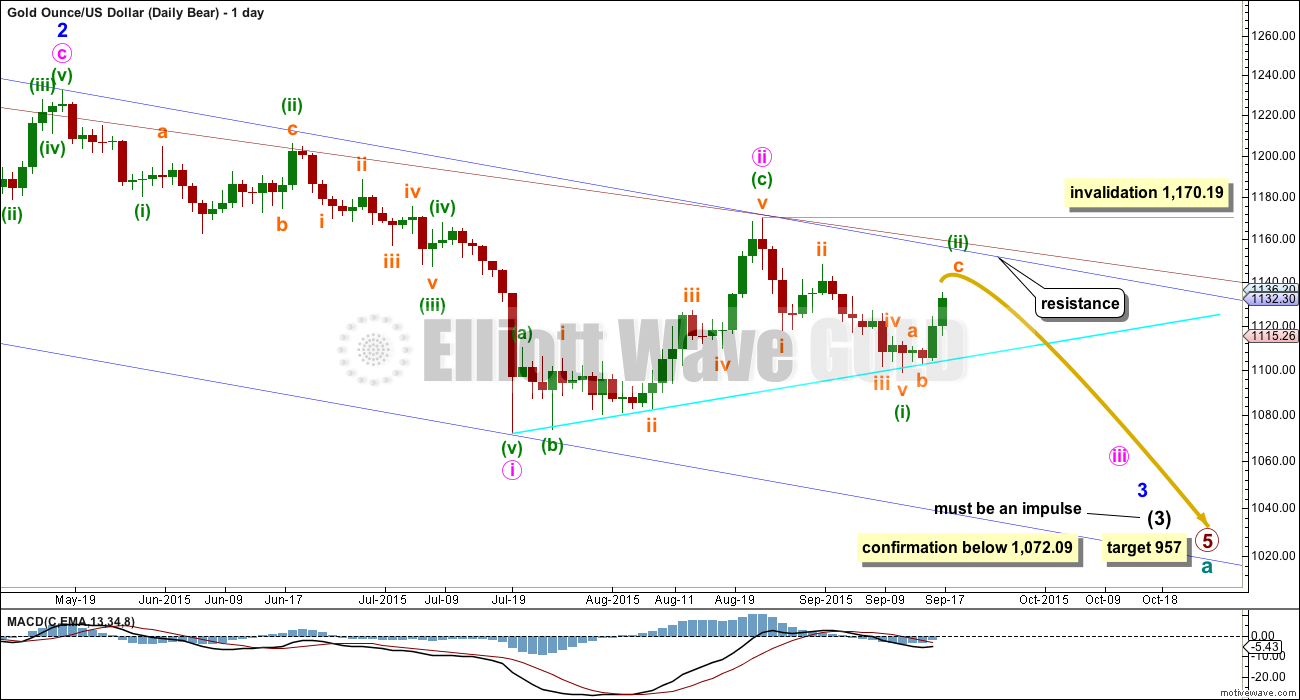
Gold has been in a bear market since September 2011. There has not yet been confirmation of a change from bear to bull, and so at this stage any bull wave count would be trying to pick a low which is not advised. Price remains below the 200 day moving average and below the blue trend line (copied over from the weekly chart). The bear market should be expected to be intact until we have technical confirmation of a big trend change.
This wave count now sees a series of four overlapping first and second waves: intermediate waves (1) and (2), minor waves 1 and 2, minute waves i and ii, and now minuette waves (i) and (ii). Minute wave iii should show a strong increase in downwards momentum beyond that seen for minute wave i. If price moves higher, then it should find very strong resistance at the blue trend line. If that line is breached, then a bear wave count should be discarded.
The blue channel is drawn in the same way on both wave counts. The upper edge will be critical. Here the blue channel is a base channel drawn about minor waves 1 and 2. A lower degree second wave correction should not breach a base channel drawn about a first and second wave one or more degrees higher. If this blue line is breached by one full daily candlestick above it and not touching it, then this wave count will substantially reduce in probability.
Minuette wave (ii) may not move beyond the start of minuette wave (i) above 1,170.19. A breach of that price point should see this wave count discarded as it would also now necessitate a clear breach of the blue channel and the maroon channel from the weekly chart.
Today the bear wave count is changed for the last wave down. Instead of seeing this as two first and second waves for minuette waves (i) and (ii) followed by subminuette waves i and ii, I am seeing the downwards wave as only minuette wave (i). This will fit on the hourly chart as a five wave impulse, but on the daily chart it does not have as good a look. Subminuette wave iii has a three wave look to it on this time frame. However, the size of upwards movement over the last two days is too large to be a correction at subminuette degree.
Full and final confirmation of this wave count would come with a new low below 1,072.09.
If primary wave 5 reaches equality with primary wave 1, then it would end at 957. With three big overlapping first and second waves, now this target may not be low enough.
Click chart to enlarge.
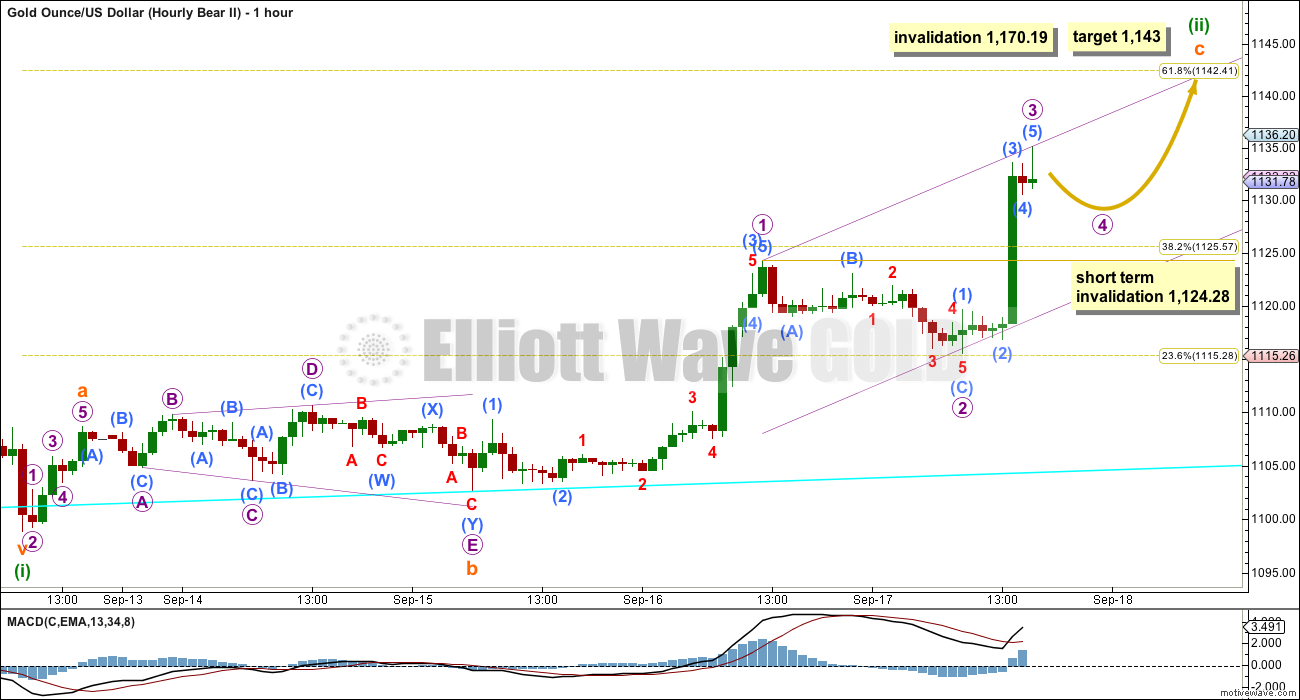
The structure of this upwards movement is mostly the same today for the bear wave count, but it is moved up one degree.
The correction was not over at the high labelled micro wave 1. That may have only been the first wave within subminuette wave c.
Minuette wave (ii) is subdividing as a zigzag. Within minuette wave (ii), subminuette wave a is relatively short. At 1,143 subminuette wave c would reach 4.236 the length of subminuette wave a and minuette wave (ii) would correct to the 0.618 Fibonacci ratio of minuette wave (i). This seems a reasonable target for a correction to end.
The key difference today between wave counts at the hourly chart level is how the movement here labelled subminuette wave b is seen. For this bear wave count, a B wave may subdivide as a triangle. For the bull wave count, a second wave correction may not have the sole structure as a triangle. This movement will subdivide perfectly and has the best fit as an expanding triangle. Although these are the rarest of all Elliott wave structures (I have only ever seen two or three over the years), all the subdivisions are perfect, all rules for an expanding triangle are met, the triangle has the right look, and is also supported by MACD hovering about the zero line while it came to an end.
If that movement was as I suspect an expanding triangle, then the only wave count which could be correct would be the bear wave count. While this bear wave count still remains viable (while price is below the blue trend line on the daily chart) it should still be considered.
Within the zigzag of minuette wave (ii), subminuette wave c must subdivide as a five wave structure. At this stage, subminuette wave c is an incomplete impulse.
Within subminuette wave c, micro wave 3 has no Fibonacci ratio to micro wave 1 and is in fact slightly shorter than micro wave 1 by $2. If micro wave 3 is over here and does not move any higher, then micro wave 5 will be limited to no longer than equality with micro wave 3 because a third wave may never be the shortest. Micro wave 5 may not be longer than 19.67.
Micro wave 4 should unfold sideways and should exhibit alternation with micro wave 2. Micro wave 2 was a shallow 0.41 zigzag. Micro wave 4 may be either very shallow or deep, and is most likely to be a flat, combination or triangle. It may not move into micro wave 1 price territory below 1,124.28.
If micro wave 4 subdivides as an expanded flat, running triangle or combination, then it may include a new price extreme beyond its start above 1,135.15.
This may seem counterintuitive today (and may be confusing), but the bear wave count now expects one more wave up (after micro wave 4 is done) while the bull wave count now expects more downwards movement. I will produce a short video to outline these differences. For members who prefer text and charts, maybe looking at these two hourly charts side by side will help to clarify the short term differences.
BULL ELLIOTT WAVE COUNT
Click chart to enlarge.
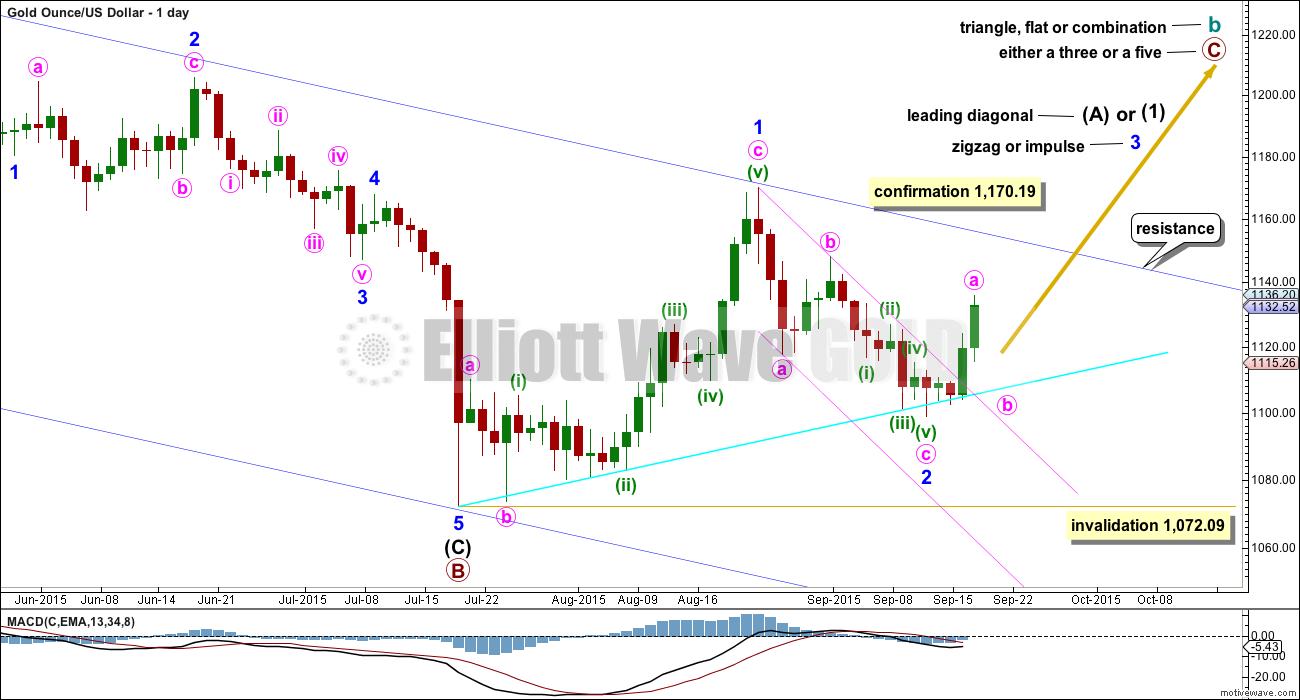
The bull wave count sees cycle wave a complete and cycle wave b underway as either an expanded flat, running triangle or combination. This daily chart works for all three ideas at the weekly chart level.
For all three ideas, a five up should unfold at the daily chart level for a movement at primary degree. This is so far incomplete. With the first wave up being a complete zigzag the only structure left now for intermediate wave (1) or (A) would be a leading diagonal. While leading diagonals are not rare they are not very common either. This reduces the probability of this bull wave count.
A leading diagonal requires the second and fourth waves to subdivide as zigzags. The first, third and fifth waves are most commonly zigzags, the but sometimes may appear to be impulses. So far minor wave 1 fits well as a zigzag.
Minor wave 2 may not move beyond the start of minor wave 1 below 1,072.09. If this invalidation point is breached, then it would be very difficult to see how primary wave B could continue yet lower. It would still be technically possible that primary wave B could be continuing as a double zigzag, but it is already 1.88 times the length of primary wave A (longer than the maximum common length of 1.38 times), so if it were to continue to be even deeper, then that idea has a very low probability. If 1,072.09 is breached, then I may cease to publish any bullish wave count because it would be fairly clear that Gold would be in a bear market for cycle wave a to complete.
To the upside, a new high above 1,170.19 would invalidate the bear wave count and provide strong confirmation for this bull wave count.
Upwards movement is finding resistance at the upper edge of the blue channel and may continue to do so. Use that trend line for resistance, and if it is breached, then expect a throwback to find support there.
In the short term, use the smaller pink channel drawn about the zigzag of minor wave 2 using Elliott’s technique for a correction as shown. Copy this channel over to the hourly chart. This channel is also drawn in the same way for the bear wave count, and there it is correctly termed a base channel.
This channel is now clearly breached. This breach confirms that the wave down labelled minor wave 2 is over and the next wave is underway. The breach favours the bull wave count.
I added a bright aqua blue trend line to this chart. Price has found support there and is bouncing up.
Minor wave 2 can now be seen as a complete zigzag. It is 0.73 the depth of minor wave 1, nicely within the normal range of between 0.66 to 0.81 for a second wave within a diagonal.
Third waves within leading diagonals are most commonly zigzags, but sometimes they may be impulses. Minor wave 3 should show some increase in upwards momentum beyond that seen for minor wave 1. Minor wave 3 must move above the end of minor wave 1 above 1,170.19. That would provide price confirmation of the bull wave count and invalidation of the bear.
Click chart to enlarge.
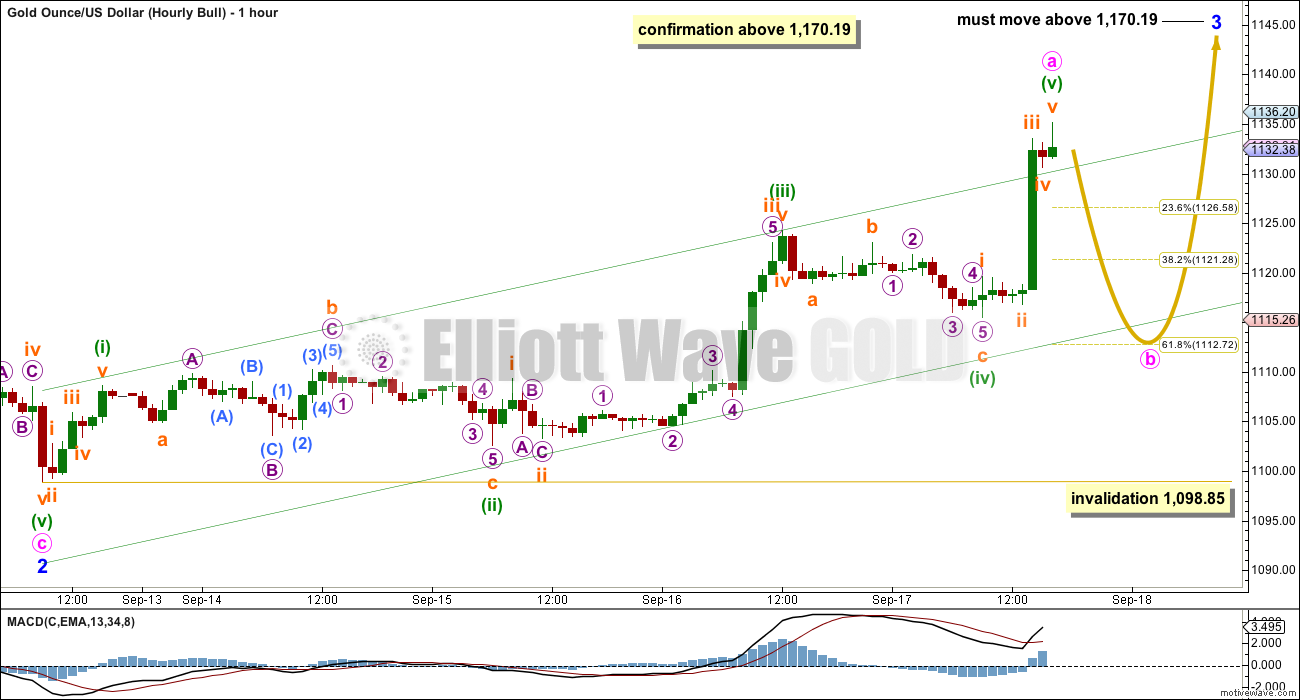
Minor wave 3 is most likely to subdivide as a zigzag. Within a zigzag, minute wave a must subdivide as a five wave structure.
Although it would be technically possible to see minute wave a over as a very short quick five at the high labelled minuette wave (i), that would be far too short for minute wave a. That would look very wrong on the daily chart.
It is possible to see a five wave impulse up complete from the low at 1,098.85. This may be minute wave a.
The key difference again is the structure here labelled minuette wave (ii). It may not be a triangle, and so it is seen here as an expanded flat. Within the expanded flat, subminuette wave c must be a five wave structure and that does not have a good fit on the hourly chart. It will fit as a five on the five minute chart, and sometimes Gold’s impulses have a three wave curved look due to disproportion between time consuming second wave corrections and quick fourth wave corrections (this happens because of the power of its fifth waves, typical of commodities). This wave count is acceptable, but it does not have as neat a fit as the bear for this portion.
Because minute wave a may be a complete five wave structure, the bull wave count may now require minute wave b to unfold, which should show up on the daily chart and most likely to be very choppy and overlapping. There are 23 possible structures minute wave b may be (if all the different kinds of combinations and triangles are counted), so it is impossible to tell exactly what pathway it will take. Minute wave b may end about either the 0.382 or 0.618 Fibonacci ratios of minute wave a at 1,121 or 1,113.
Minute wave b may not move beyond the start of minute wave a below 1,098.85.
A new low below 1,098.85 would substantially reduce the probability of the bull wave count. At that stage, it would be possible that minor wave 2 could be extending lower, but the probability of that is low. The final invalidation point for the bull wave count will remain at 1,072.09 though for this reason. A new low below 1,072.09 would eliminate all possibilities for a bull wave count that I have been able to see so far and so would provide full and final confirmation for the bear wave count.
TECHNICAL ANALYSIS
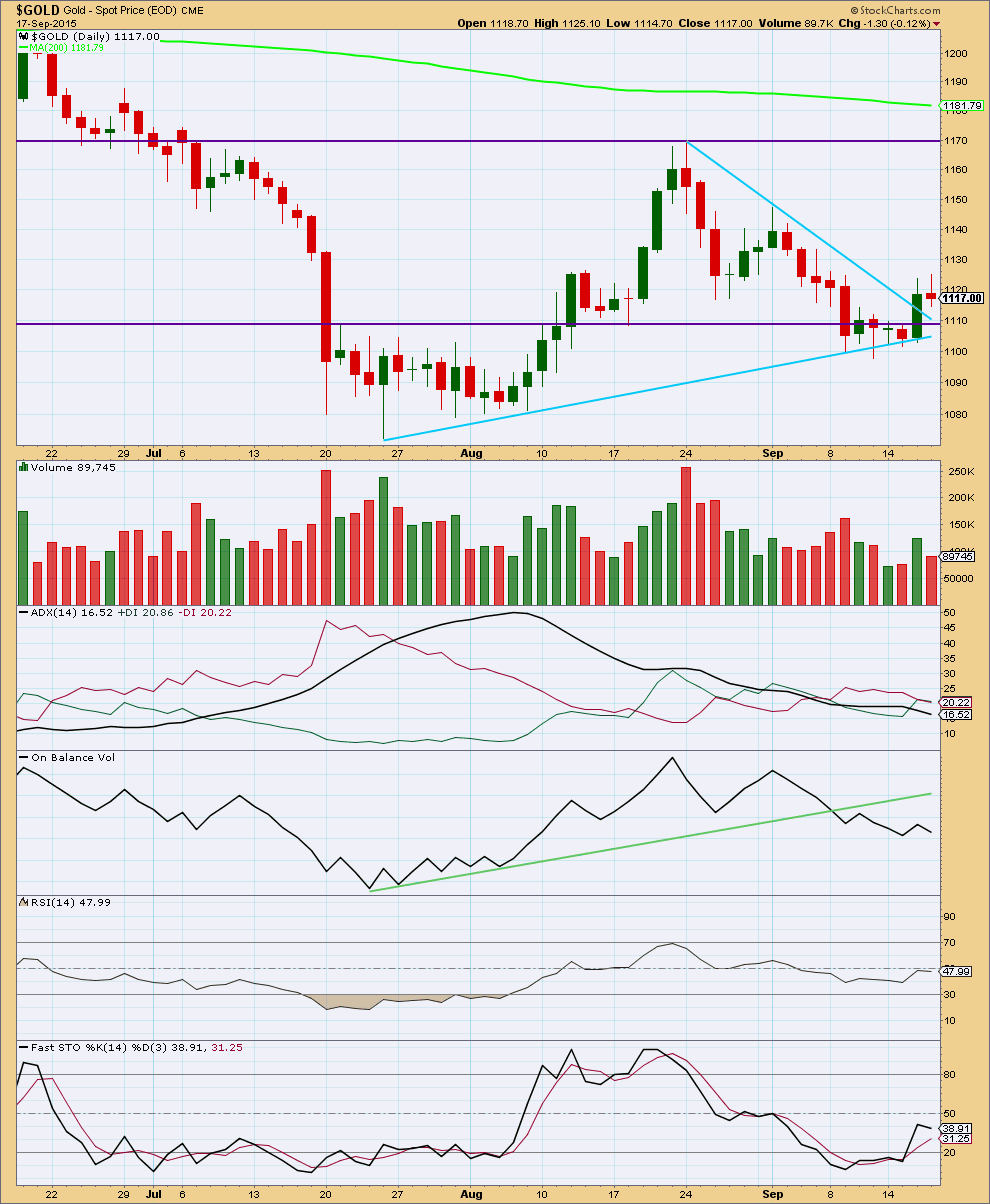
Click chart to enlarge. Chart courtesy of StockCharts.com.
Daily: A decrease in volume at the end of this short upwards movement may be an indication that upwards movement was a correction and it is either over here or over very soon.
StockCharts data has today’s candlestick as red with a small body and long upper wick. This is bearish. FXCM data has a strong green candlestick with a large green body, which is bullish. Different data feeds have different price points (because different sections of global trade in the Gold spot price are included or excluded). While I am not producing separate wave counts for the different data feeds, I will note the differences when they are this significant. It is my opinion today that the big difference here is not supportive of a bull market, short or mid term.
Overall, from the last swing high at 1,170 on 24th August, as price falls it comes on declining volume. There is some small support for the fall in price: each wave down has increasing volume, but the whole movement from its start has overall declining volume. The picture remains unclear.
The strongest volume days in this fall are for down days. Overall the volume profile looks more bearish than bullish, but it is not as clear as it could be.
ADX is flat indicating there is no clear trend and the market is range bound. If a range bound system is used here, then it would expect an upwards swing because price has reached to the lower horizontal line of support and Stochastics has reached oversold. However, trading a range bound market is more risky than trading a clearly trending market. The final swing never comes; that is when price breaks out of the range and begins a trend. An upwards swing may still possibly be developing at this stage. While the Elliott wave bear count remains valid the risk that a bear market may still be intact must be acknowledged. Good money management on any bullish trades is essential. An upwards swing using this system may be expected to continue until price reaches the horizontal line of resistance and Stochastics indicates overbought.
While On Balance Volume remains below its trend line it is bearish.
RSI at the daily chart level is neither overbought or oversold. There is room for the market to rise or fall.
Overall the regular technical analysis picture remains unclear. We may have more clarity this week.
This analysis is published about 05:52 p.m. EST.
A warning: I cannot yet see a clear five down on the five minute chart.
The risk that there will be more upwards movement most certainly remains.
The invalidation point for the bear must remain up at 1,170.19 while there is zero confirmation that this upwards movement is done.
If price does move higher look for it to find very strong resistance and stop at the upper blue trend line on the daily charts. What it does if it gets there may tell us which wave count is correct, bull or bear.
For the bull count at the hourly chart level:
Minuette wave (iii) may have just ended as a long extension.
Minuette wave (iv) now needs to unfold sideways. Minuette wave (ii) lasted two days and shows up on the daily chart, so to have the “right look” minuette wave (iv) now needs to also show up on the daily chart.
So now the bear expects a big third wave down from here (with the caveat that it needs confirmation, two points required in first comment below) and the bull expects a fourth wave correction down.
Which means the expected direction for Monday and Tuesday is down.
Thank you Lara.
No sooner had you posted that I watched DUST go running downhill. ( more upward movement coming, a bull correction coming? — we’ll see) I’m waiting on this thing to say for sure its done bullishness.
The structure for the 5-3-5 zigzag upwards for the bear now looks complete. It looks perfect actually.
BUT
There is not enough downwards movement yet to confirm that it is over. The fifth wave could still extend and move higher.
We need two things:
1. A breach of the small channel containing subminuette wave c, that would be earliest indication that subminuette wave c should be over.
2. a new low below 1,127.70 could not be a second wave correction within the final fifth wave up, so at that stage the fifth wave would have to be over and so the probability of the whole correction for minuette wave (ii) being over would be high.
Now I’m going to look at the count for the bull and see if I can make sense of that. Comment to come shortly there.
Lara, regarding this past upward movement to 1141+, does it appear finished ? (bull’s minute a completed, and bear’s subminuette ii).
Hi. Notwithstanding Lara’s comments above and analysis to follow, looks to me Gold price is determined to base off 1136 for one small leg up for a break above 1139-41 to target 1146-47 and be the moth to fly in to the candle to crash and burn lol….
Started a dust position yesterday and added today. Looking for the fed’s lack of inflation statements to deflate gold.
Ditto. GDX looking very shortable
For the bears to get anywhere would need to put in a sustained break through 1135-25 range with Gold price likely to stall at 1131-30… I guess we will only know on Monday. Have a fine weekend all….
Looks like the Bear hourly chart so far.
It’s target was 1142.41 and looked to have peaked at 1141.83 at 10:00
Getting Buy signals on DUST on many time frames in my opinion.
I think 4th wave ended at 1127.60 at 11:58 pm EST and 5th wave up ended at 1141.83 at 10:00 am EST
Any comments?
DUST time?
Would you post when time is up?
15 minutes ago I already bought DUST at 22.34 and sold 22.78 fast in 10 minutes will do it again very soon this morning. Looking to scalp fast.
Gold pushing to 1142??? The bear hourly wave count target???
If it does and reverse course than bear count is in play?????
Gdx
Thanks for sharing
Coming up on the bear target 1943. Seems risky with this momentum though…
Must watch special video from Oscar before Midday yesterday FED Day. He predicted rates will not be changed. Plus he again talks about liquidity.
Interesting with gold trades as well. Enjoy!!!
https://www.youtube.com/watch?list=UUez8uA1o_fDYsrSf4auWSjg&t=17&v=T3I6nWc9EiE
My comments about volume for today in the analysis above are wrong.
Now that StockCharts have their data finalised for the day it’s the same as FXCM data.
Today had a strong green candlestick on increased volume.
That’s two days in a row price has risen on increased volume, that’s quite bullish.
I’ll sit on the fence and wait for price to tell us which wave count is correct; bull or bear. They both remain viable and the situation remains unclear. Volume is starting to indicate a bull trend at this time.
Hi Lara..Thanks for the excellent analysis.
Are you familiar with Jeffrey Kennedy’s EW CHANNELS?
Yes. I use his base channel a lot.
From my experience, stockcharts will release partial data of $GOLD around 4:15 pm eastern time and then release the complete data for the day around 6:00 pm eastern time.
Hope this helps clear up any confusion that Lara or any subs may be having with the $GOLD chart from stockcharts.
Thank you Reid, that makes sense.
I’m trying to get the analysis published as close to the NY close as I can. This means I’ll have to take what Stockcharts have at that time, and will have to come with the caveat that it may change when their data is complete.
Suggestion Lara, May be you publish the report as schedule w/o the tech analysis and later just edit/update the same report.
Main focus is to know the changes in wave counts
Thanks..
That’s exactly what I’ll be doing.
Dreamer
you like Rambus charts. Their site was hacked and has problem.
Currently all the posts are open to public.
Check it out
http://rambus1.com/
Yes I do. Thanks. I usually look at his site daily. He will post public up to twice a week.
Looks like Rambus site is down for the count. Serious hack. Ouch!
Rambus Chartology closed for site maintence. ETA September 21st
Lara, I hope EWG has great security!!!!!!!!!!!!!!!!!!
That’s Cesar’s domain. I think he’s onto it.
Correct. I just checked it. Huge take down of his site. For a week the site had problems.
Lara
How are you getting these strange stockchart candles? Price didn’t close red at 1117… & Volume was higher than previous day …
My stockchart is fine?
John, I see the same thing on stockcharts as you. Lara’s looks like a chart from midday before the Fed announcement.
If you short than you mean gold price to go down to 1125 not 1225?? Typo???
Yeah that’s interesting, because there is no volume midday on $GOLD in stockcharts. Either way Lara’s chart is incorrect
I was too early 🙁
John, how much more upside do you see for GDX. Do you have an updated chart you can post? Many thanks.
I’m away from my computer right now but I’m pretty much aligned with what Lara has with gold . Will try to update my Gdx tomorrow… Are you bull or bear
Leaning bear, but not 100% confident. Fed not raising should be bearish for gold as it is a sign that they are not fearing inflation. In fact, the Fed lowered their inflation targets for the next 3 years today. I’m thinking this is just a corrective bounce, just not sure how high it goes.
Yes either way it should be bearish. A fed hike would have had an immediate drop but taking no action is bearish as well. It’s just pricing in. 1140 may be a good shorting oppty.
I think the Bears will prevail… I see no reason why we should be bullish on gold when the USA is the only country that’s entertaining a rate raise. That very fact underlines a strengthening US economy, and a strengthening economy is supportive of the USD. Having said that, Gold should find difficulty outperforming the US currency . As a Canadian, I would much rather transfer my funds into an “appreciating” US bank account PLUS INTEREST (possibly higher by year end) than to buy the risky metal and hope for a capital gain.
You mentioned Americans are afraid of inflation?Unless I am misunderstanding you, the only thing they are worried about is that there is not ENOUGH inflation. This lack of inflation is one of the main reasons why they did not raise interest rates today. Their target is 2%, no more, no less. Maybe you are referring to the fact that they have reduced their inflation “expectations” because of the slump in commodities oil etc.??(but the target is still 2%) for example Goldman Sachs announced today that they see lower oil prices for the next 15 years…
Dear Lara, do you think there would be any retracement i have a short position and need the price to go to 1225 just to break even.. please guide
If you short than you mean gold price to go down to 1125 not 1225?? Typo???
yes typo!! 1125*
There’s just no way I’m giving anyone investment advice. I am not able to legally do this, I am not a registered investment advisor.
This site offers analysis only. It is my opinion, based on technical analysis, on where the market will go.
Sometimes I am wrong.
The only advice I will offer is to always manage risk carefully, do not risk more then 2% (or at a maximum 5%) of your equity on any one trade. When you enter a trade always have an exit strategy.
Risk management is the one key thing which differentiates professional traders, those who manage to make a living from trading, and everyone else.
My analysis for both wave counts expects some more downwards movement short term.
Excellent advice.
thank you dear