
Yesterday’s analysis expected a little more downwards movement to 1,116 for both Elliott wave counts, but this is not what happened. Price moved higher.
Summary: Short term both wave counts expect a little upwards movement to 1,137. Thereafter, both wave counts expect another five wave structure downwards. The bear wave count still expects a strong third wave is beginning. The bull wave count expects a correction is unfolding for a fourth wave zigzag. The price point which differentiates the wave counts to the downside is 1,108.62; a new low below this point would strongly favour the bear wave count.
Changes to last analysis are bold.
To see the bigger picture on weekly charts click here.
BEAR ELLIOTT WAVE COUNT
Click chart to enlarge.
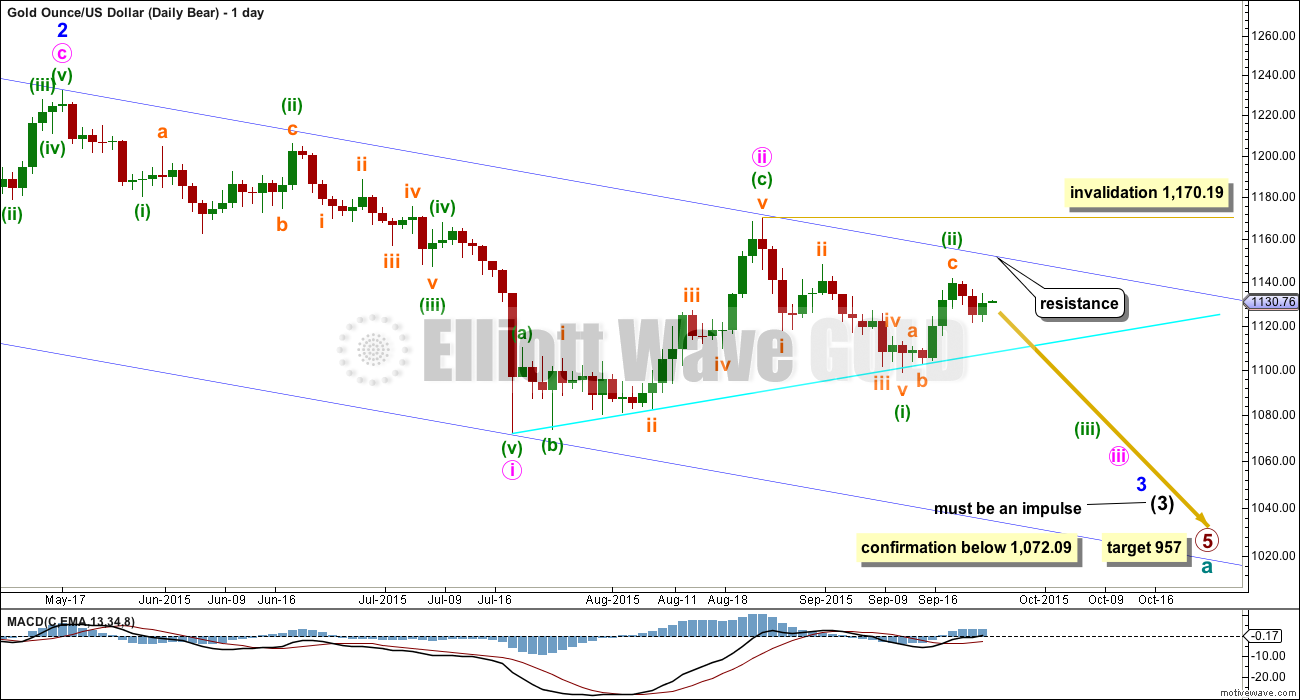
Gold has been in a bear market since September 2011. There has not yet been confirmation of a change from bear to bull, and so at this stage any bull wave count would be trying to pick a low which is not advised. Price remains below the 200 day moving average and below the blue trend line (copied over from the weekly chart). The bear market should be expected to be intact until we have technical confirmation of a big trend change.
This wave count now sees a series of four overlapping first and second waves: intermediate waves (1) and (2), minor waves 1 and 2, minute waves i and ii, and now minuette waves (i) and (ii). Minute wave iii should show a strong increase in downwards momentum beyond that seen for minute wave i. If price moves higher, then it should find very strong resistance at the blue trend line. If that line is breached, then a bear wave count should be discarded.
The blue channel is drawn in the same way on both wave counts. The upper edge will be critical. Here the blue channel is a base channel drawn about minor waves 1 and 2. A lower degree second wave correction should not breach a base channel drawn about a first and second wave one or more degrees higher. If this blue line is breached by one full daily candlestick above it and not touching it, then this wave count will substantially reduce in probability.
Minuette wave (ii) may not move beyond the start of minuette wave (i) above 1,170.19. A breach of that price point should see this wave count discarded as it would also now necessitate a clear breach of the blue channel and the maroon channel from the weekly chart.
Downwards movement from 1,170.19 will subdivide as a complete five wave impulse on the hourly chart, but on the daily chart it does not have a clear five wave look. Subminuette wave iii has disproportionate second and fourth waves within it giving this movement a three wave look on the daily chart.
Sometimes Gold’s impulse waves start out slowly. There is a good example on this daily chart for minute wave i. When the fifth wave approaches that is when momentum sharply increases, and it often ends on a price shock with a volume spike. This is an even more common tendency for Gold’s third wave impulses. The strongest downwards movement is ahead, and it should be expected to arrive when subminuette wave v within minuette wave (iii) begins.
Full and final confirmation of this wave count would come with a new low below 1,072.09.
If primary wave 5 reaches equality with primary wave 1, then it would end at 957. With three big overlapping first and second waves, now this target may not be low enough.
Click chart to enlarge.
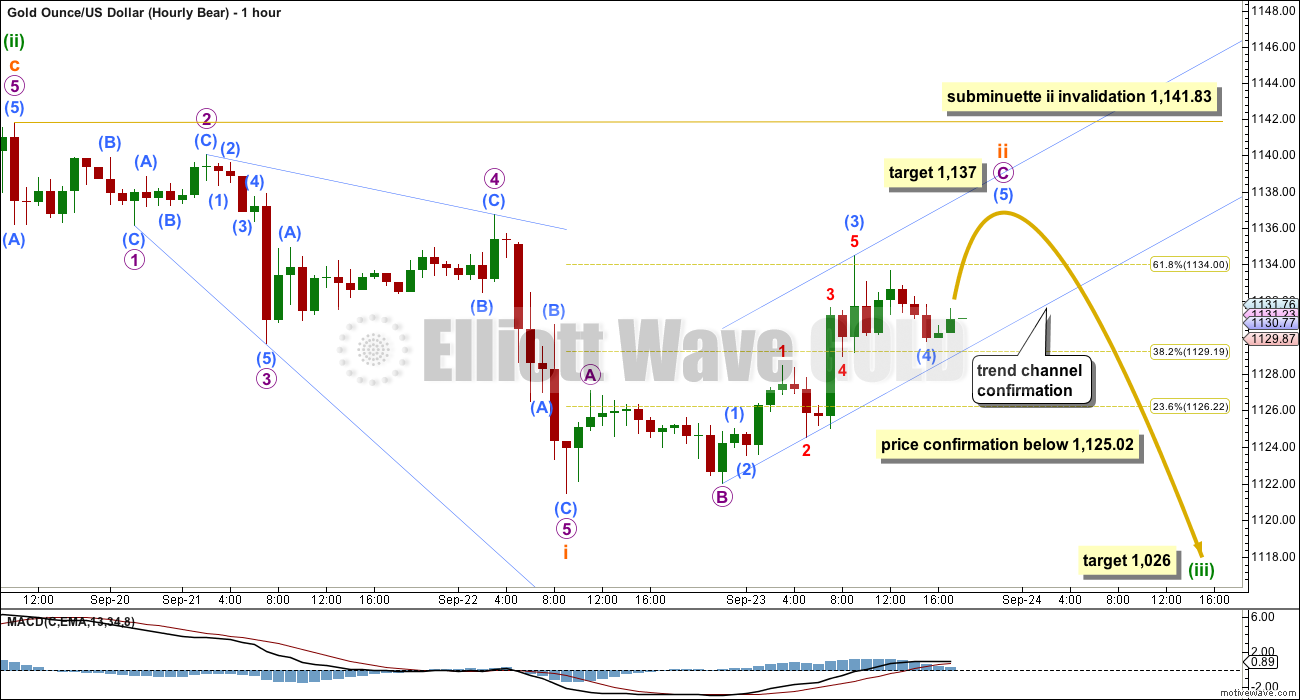
The first wave down was not an impulse, but a less common leading expanding diagonal. Leading diagonals aren’t as common as impulses for a first wave, and the expanding variety is less common than the contracting variety. But that is what this one is. All rules are met for a leading diagonal.
Leading diagonals in first wave positions are usually followed by very deep second wave corrections. At this stage, I have concluded that subminuette wave ii is incomplete and needs a final fifth wave up.
At 1,137 micro wave C would reach 4.236 the length of micro wave A. At 1,137 submicro wave (5) would reach 0.618 the length of submicro wave (3). This target would see subminuette wave ii very deep.
When subminuette wave ii is complete then Gold may be ready to move into a third wave at five wave degrees. This should see an increase in downwards momentum.
Subminuette wave ii may not move beyond the start of subminuette wave i above 1,141.83.
If the bear wave count is invalidated at the hourly chart level, then it would be changed to see minuette wave (ii) continuing higher as a more time consuming and deeper zigzag. To the upside, the final differentiation between bull and bear wave counts is the upper edge of the blue channel on the daily chart in the first instance. If that trend line is breached at the daily chart level, then the probability of a bear wave count would be substantially reduced.
BULL ELLIOTT WAVE COUNT
Click chart to enlarge.
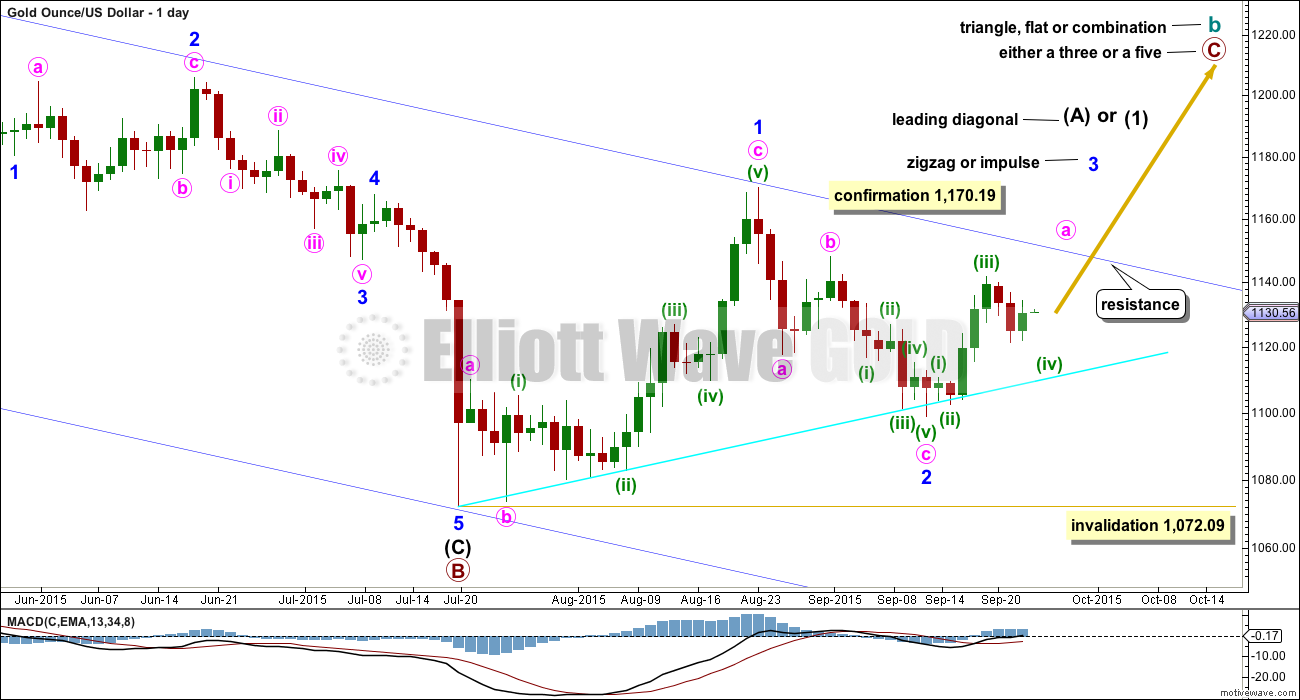
The bull wave count sees cycle wave a complete and cycle wave b underway as either an expanded flat, running triangle or combination. This daily chart works for all three ideas at the weekly chart level.
For all three ideas, a five up should unfold at the daily chart level for a movement at primary degree. This is so far incomplete. With the first wave up being a complete zigzag the only structure left now for intermediate wave (1) or (A) would be a leading diagonal. While leading diagonals are not rare they are not very common either. This reduces the probability of this bull wave count.
A leading diagonal requires the second and fourth waves to subdivide as zigzags. The first, third and fifth waves are most commonly zigzags, the but sometimes may appear to be impulses. So far minor wave 1 fits well as a zigzag.
Minor wave 2 may not move beyond the start of minor wave 1 below 1,072.09. If this invalidation point is breached, then it would be very difficult to see how primary wave B could continue yet lower. It would still be technically possible that primary wave B could be continuing as a double zigzag, but it is already 1.88 times the length of primary wave A (longer than the maximum common length of 1.38 times), so if it were to continue to be even deeper, then that idea has a very low probability. If 1,072.09 is breached, then I may cease to publish any bullish wave count because it would be fairly clear that Gold would be in a bear market for cycle wave a to complete.
To the upside, a new high above 1,170.19 would invalidate the bear wave count and provide strong confirmation for this bull wave count.
Upwards movement is finding resistance at the upper edge of the blue channel and may continue to do so. Use that trend line for resistance, and if it is breached, then expect a throwback to find support there.
I added a bright aqua blue trend line to this chart. Price has found support there and is bouncing up.
Minor wave 2 can now be seen as a complete zigzag. It is 0.73 the depth of minor wave 1, nicely within the normal range of between 0.66 to 0.81 for a second wave within a diagonal.
Third waves within leading diagonals are most commonly zigzags, but sometimes they may be impulses. Minor wave 3 should show some increase in upwards momentum beyond that seen for minor wave 1. Minor wave 3 must move above the end of minor wave 1 above 1,170.19. That would provide price confirmation of the bull wave count and invalidation of the bear.
Click chart to enlarge.
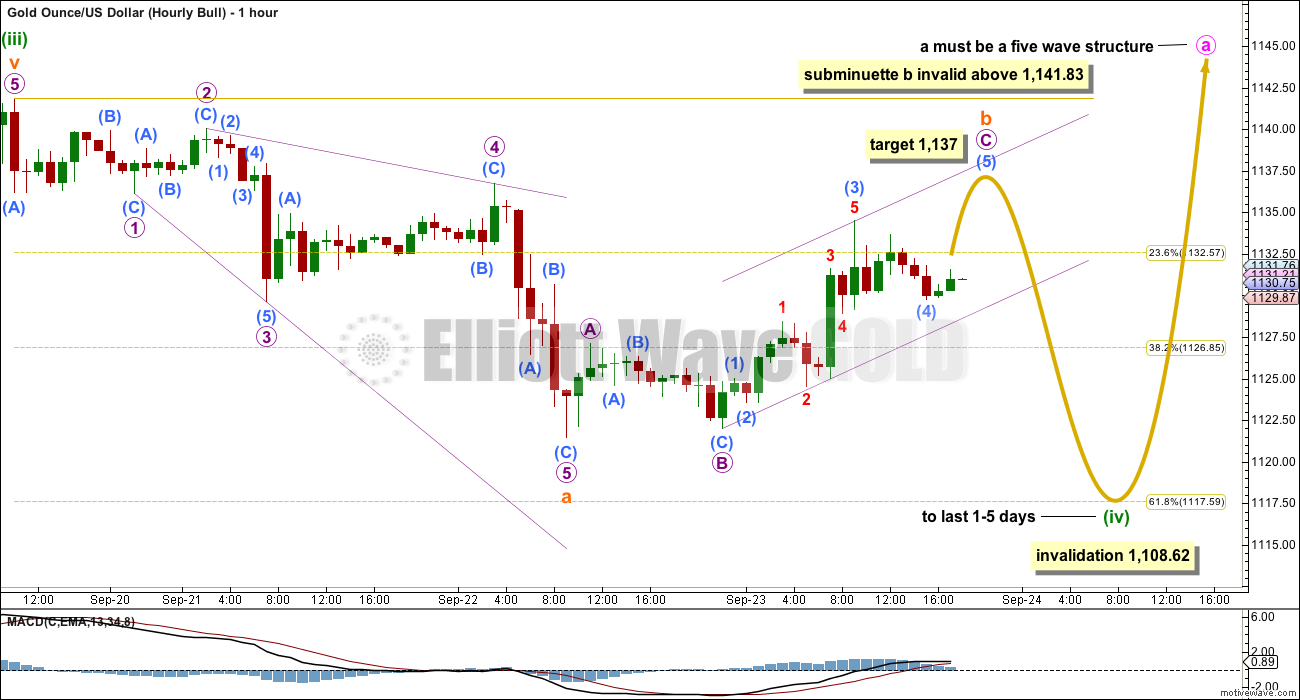
Minor wave 3 is most likely to subdivide as a zigzag. Within a zigzag, minute wave a must subdivide as a five wave structure.
Minute wave a would be an incomplete five wave impulse at this stage.
Minuette wave (ii) shows up on the daily chart and lasted two days. Minuette wave (iv) is most likely to also show up on the daily chart, for the five wave impulse of minute wave a to have the right look on the daily chart, and it may last 1-5 days.
Minuette wave (ii) is seen as an expanded flat for this bull wave count.
Minuette wave (iv) is still unfolding as a zigzag which provides structural alternation with the flat of minuette wave (ii). So far the structure of this zigzag is incomplete.
Minuette wave (iv) zigzag subdivides 5-3-5, exactly the same as 1-2-3 for the beginning of an impulse. This is why there is no divergence between expectations today for bull and bear wave counts for the short term. The subdivisions are all the same.
Minuette wave (iv) may not move into minuettte wave (i) price territory below 1,108.62.
TECHNICAL ANALYSIS
Click chart to enlarge. Chart courtesy of StockCharts.com.
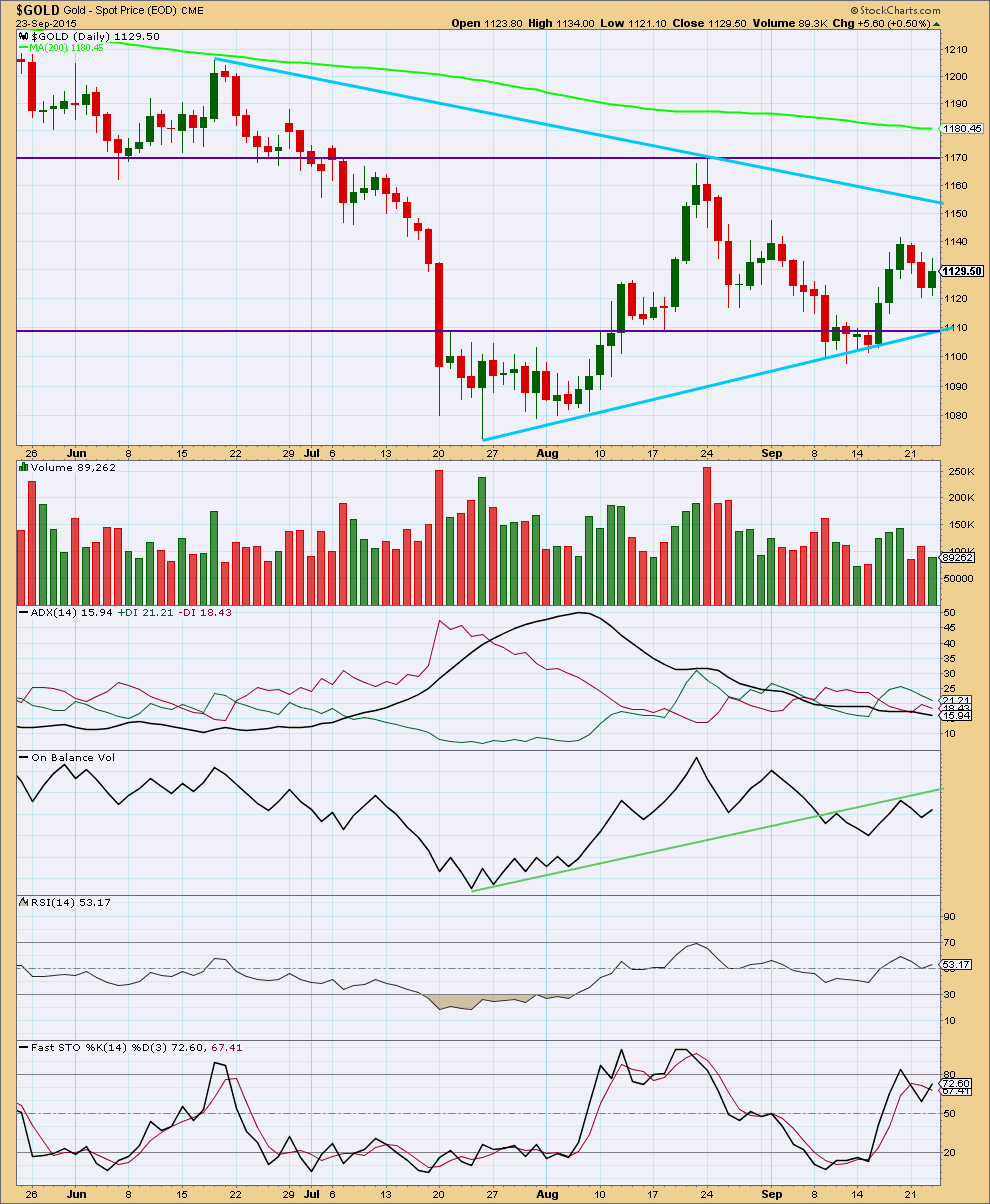
Daily: An inside day for a green candlestick comes on lighter volume. The rise in price was not supported by volume and so is suspicious. This fits both wave counts short term because they both see this upwards day as a correction within a downwards movement, the bear wave count for a second wave and the bull wave count for a B wave.
The two blue sloping lines of resistance and support are converging, squeezing price. From the last high at 1,170 price has been essentially moving sideways within a consolidation. There will be a breakout from this sideways consolidation, of that we may be sure. To see what direction the breakout is most likely volume can be a good guide. Here the strongest volume comes on downwards days, four of them. This strongly indicates a downwards breakout is more likely.
ADX is flat indicating there is no clear trend and the market is range bound. If a range bound system is used here, then it would expect an upwards swing to continue because price has reached to the lower horizontal line of support and Stochastics has reached oversold. However, trading a range bound market is more risky than trading a clearly trending market. The final swing never comes; that is when price breaks out of the range and begins a trend. An upwards swing may still possibly be continuing at this stage and would be expected to only end when price reaches resistance and Stochastics is overbought at the same time. While the Elliott wave bear count remains valid the risk that a bear market may still be intact must be acknowledged. Good money management on any bullish trades is essential.
On Balance Volume has found resistance at the green trend line and moved lower from there. The strength of that line is reinforced. OBV may yet move up again to touch the line; this would allow for more upwards movement which the bull wave count expects. Equally as likely OBV may continue lower from here as the bear wave count expects.
RSI at the daily chart level is neither overbought or oversold. There is room for the market to rise or fall.
Overall the regular technical analysis picture remains unclear.
This analysis is published about 07:57 p.m. EST.
Does it get interesting now with a hawkish speech from Janet after hours – guess we will see.
That last downwards movement which is labelled minuette (iv) for the bull count has proved a nightmare to analyse. With a new high above its start it can’t be a five, it now only fits and makes sense as a double zigzag.
We now have a five up on the daily chart.
If that’s correct we should now be seeing a three down.
For the bear wave count it’s in trouble. I have an overshoot of the upper blue trend line. But only a full daily candlestick above that line and not touching it would see the probability of the bear substantially reduced.
I need to spend some time figuring out what may be happening for a bear scenario. This is the first time in a long time we have had what looks like a five up on the daily chart, that’s bullish.
Short term resistance should see a correction down from here at least.
If the Primary Expanding Diagonal idea is for real, that five up could have been Minor (1) of (c) in an Intermediate Zigzag to complete Primary (4)
I’ll wait for tomorrow to buy and keep DUST.
I did get a sell signal for it last night.
DUST hasn’t got a BUY yet for DUST like it did last Friday and a SELL for it the Friday before that, which were both perfect calls.
After the last DUST peak it took 5 days to bottom.
Today is the first day after last peak which was yesterday.
GDX peak was 14.16 at 2:17 pm and GDX has already bounced back up to 14.14 at 3:30
If gold stays at this price tomorrow then more money will move into GDX and DUST would go down.
For me it is risky to hold DUST overnight tonight.
I’ll look to buy at Friday’s low after momentum adjusts and DUST may drop even more.
Stockchart does not have 195 min indicator (???). Only 120 min is available.
Which indicator are you using?
Papurdi, as I mentioned to you earlier this week.
LBR_ThreeTenOscillator
and I use a custom time frame for 195 minute instead of 4 hours.
thanks.
Gold has room to run as price has yet to tell whether it is sustainable or a sell opportunity. This might be a case of buying the rumour (about the insolvency of Deutsche Bank) and selling then news.
IMO one thing that you need to be cautious about in trading gold is that gold is a thing which is viewed by traders around the world in terms of their local currency. For example, in terms of CNH, the summer low in gold held at the low it made years ago when China wanted to buy the IMF gold. Charting gold in terms of other major currencies (EUR, CNH) can provide trading insight that’s unavailable on a dollar-gold chart. Because europeans care about gold priced in euros, not dollars, Asians care about the gold price in terms of their Asian FX, etc.
The loonie price reached up near a critical juncture this morning and backed-off from 1.346: which is the 61.8% retracement of the all-time low at 0.9056 and the all-time of @1.6184. FX and sometimes gold makes a habit of often eventually extending to near the .786 retracement pt, so I’m watching the current price action closely – for either a close above the 618 fib pt or a close below last week’s spike low at 1.301, which would indicate a temporary change at least. I favour a 4th wave consolidation period here, to be followed by a 5th wave up to the 78.6 retracement area later.
But when playing usd/cad, remember to watch US Oil (which looks bearish against resistance along a PF median line). Loonie continues to also nicely respect the lower and median lines within a pitchfork: (chart courtesy of dailyfx – j.saettele)
Well, I’ve got a small position in JNUG that is doing well. Looking forward to Lara’s update.
Tham-is there any clarity in your DUST count?
DUST corrected today from its run-up from 21.55 to 21.98. At the moment, it has made a retrace to 23.07 which exceeds the normal 0.618.
I would like to wait for clarity as to whether the correction could become longer or if it has ended, before making a decision.
Thanks Tham.
Apologies for the typo. Should be 29.18 instead of 21.98.
Anyway, DUST dropped to the low of 22.49.
This is just a whisker away from its nearest support of 22.30.
I would expect a rebound to occur from this point onwards. If this is the gold bull (bearish DUST), then I’m targeting 26.21. If it is gold bear (bullish DUST), then my target will be 29.48 moving up to 33.32. Let’s see how gold plays out before deciding on the next move.
Gold Firmer on More Short Covering; Yellen Remarks Awaited
Thursday September 24, 2015 08:19
http://www.kitco.com/news/2015-09-24/Gold-Firmer-on-More-Short-Covering-Yellen-Remarks-Awaited.html
Safe-Haven Demand Surfaces to Help Send Gold to 4-Week High
Thursday September 24, 2015 10:40 am
http://www.kitco.com/news/2015-09-24/Safe-Haven-Demand-Surfaces-to-Help-Send-Gold-to-4-Week-High.html
Just as a side note, September is typically one of the most reliable up months for gold. October, on the other hand, often (but, not always) goes the other way to work off the excessive gains of the previous month.
11:06am U.S. stocks extend losses
10:43am Dow drops triple digits as Caterpillar plans job cuts
Often gold goes the opposite direction of the market.
I know this may sound bold (or incredibly dumb), but IMHO gold will stall in this area and eventually break down. Looks on the daily chart like gold has made one big 3 wave corrective structure up to this point.
I am putting my money where my mouth is and loading up on shorts.
I’m doing the same. Lots of resistance overhead for GLD and GDX
Gold has slightly crossed the upper Bollinger band on the daily chart, which indicates to me that upward movement may fizzle out soon. RSI is in the low 60s. While technically not overbought, it is getting there.
Looks like gold is on the edge of blue channel now around 1155.
“To the upside, the final differentiation between bull and bear wave counts is the upper edge of the blue channel on the daily chart in the first instance. If that trend line is breached at the daily chart level, then the probability of a bear wave count would be substantially reduced.”
This is horrible~! With a high of 1155 already, looks like Gold price is maturing for something bigger than just a break above 1169-70 (118x-119x) with not much below 1135 in a hurry… Hoping the next line of defense at 20 week moving average (1162) to curtail this…
For dust 24.50 is 0.618 of the entire last uptrend. Let’s see if it holds!
It didn’t hold as DUST low is 23.71 at 11:18 am at this time.
Just dropping minute by minute almost.
Dust has been on a straight slopped decline since the close at 28.93.
Yup, a freefall!!! Not going to touch gold today. Going to wait a a day or two to see what unfolds.
Gold just hit 1144.06 at 9:13 am and went above invalidation point of 1141.83 for both hourly wave counts. I’m looking to buy DUST and not sure how high gold may continue and don’t want to be holding DUST the wrong way in any bull rally.
Lara, I appreciate your visuals–projecting wave form and targets on hourly charts.
Gold is already up to a high of $1,136.29 at 11:03 pm EST.
I hope that was submicro wave 3 and wasn’t the peak of subminuette wave ii and gold opens lower and still has to go all the way up to Lara’s target of $1,137 and it comes up slowly so DUST drops a lot with upward momentum for a few hours and I can buy some DUST cheap for the drop down to 1,117.50 or lower.
Anybody have a wave count?
U.S. stocks finish lower for 2nd day as oil rally runs out of gas
Sept 23, 2015 4:42 p.m. ET
http://www.marketwatch.com/story/us-stock-futures-rise-as-investors-digest-global-pmis-2015-09-23?mod=MW_story_top_stories
Fed Yellen’s speech later Thursday 5 pm
Don’t expect Yellen to offer clues on rate-hike timing Thursday
Sept 23, 2015 5:14 p.m. ET
http://www.marketwatch.com/story/dont-expect-yellen-to-offer-clues-on-rate-hike-timing-thursday-2015-09-23
“I suspect Yellen will sound more balanced tomorrow,” she said.
Yellen is delivering a speech on inflation dynamics and monetary policy at the University of Massachusetts in Amherst at 5 p.m. Eastern Time.
Saporta and Moran said Yellen’s remarks could be fairly academic.
Nice going Matt & thank you: Just a View: Basing off 1130-29/pivot, a break above 1139-40 looks imminent…. Dang~! With an inside day and ROC, momentum, MACD, DMI in bullish territory an upside move is inevitable….Stochastic is bullish too to boot…
Thanks, but wasn’t expecting another burst up as you claim. However, I am now starting to believe that gold may want to touch that blue line before dropping.
Upside movement has to stop right here and now for that not to occur.
It may be premature of me, but I have exited shorts and will wait for higher prices. Upper 1140s/low 1150s is my target zone now. Lara suggests that if the hourly gold chart is invalidated, gold may be continuing as a double zigzag.
Either way, I am confident that upward movement is just part of a consolidation and the blue line will hold.
Hi Matt, you’ve been on fire lately. Do you mean the blue line on the daily or hourly. it looks like they converge about 1147.4
Thanks
Thanks – even a broken clock is correct twice a day. 🙂
I meant the blue line on the daily chart and a minor overshoot is allowable too. 1150s is perhaps the more likely end to gold’s upward movement.
Ok, there now. Bull or bear definition
Nice work Matt