
Downwards movement was expected for Wednesday’s session for Gold.
Today’s analysis will answer the question of whether or not price has confirmed the trend.
Summary: The channel on the hourly chart is breached, but the breach is not convincing and there is no clear five down yet. The probability that downwards movement will continue is good, but we do not have enough confirmation for a high level of confidence. If price remains below the trend line and the next few hours show bigger red candlesticks below the line, then the probability that the downwards trend has resumed will increase. There are three things today which give cause for concern: volume for today’s small down day is low, there is slight hidden bullish divergence between price and Stochastics, and there is no clear five down on the hourly chart. Caution and good risk management is advised in your approach to this market today.
Changes to last analysis are bold.
To see weekly charts and the three different options for cycle wave b (main wave count) click here.
BULL WAVE COUNT – DAILY
Click chart to enlarge.
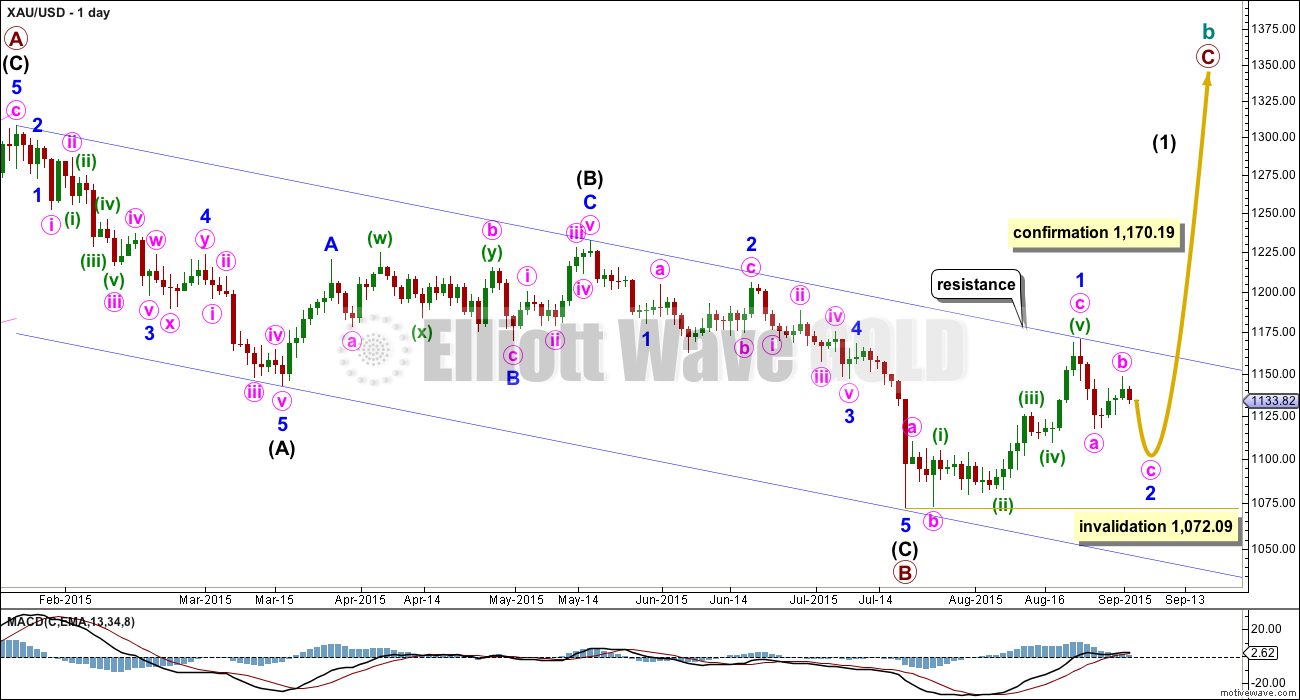
The bigger picture at super cycle degree is still bearish. A large zigzag is unfolding downwards. Along the way down, within the zigzag, cycle wave b must unfold as a corrective structure.
At this stage, there are three possible structures for cycle wave b: an expanded flat, a running triangle, or a combination.
This daily chart works for all three ideas at the weekly chart level.
For all three ideas, a five up should unfold at the daily chart level. This is so far incomplete. With the first wave up being a complete zigzag the only structure left now for intermediate wave (1) would be a leading diagonal. While leading diagonals are not rare they are not very common either. This reduces the probability of this bull wave count now to about even with the bear wave count.
A leading diagonal requires the second and fourth waves to subdivide as zigzags. The first, third and fifth waves are most commonly zigzags, the but sometimes may appear to be impulses. So far minor wave 1 fits well as a zigzag.
Minor wave 2 may not move beyond the start of minor wave 1 below 1,072.09. If this invalidation point is breached, then it would be very difficult to see how primary wave B could continue yet lower. It would still be technically possible that primary wave B could be continuing as a double zigzag, but it is already 1.88 times the length of primary wave A (longer than the maximum common length of 1.38 times), so if it were to continue to be even deeper, then that idea has a very low probability. If 1,072.09 is breached, then I may cease to publish any bullish wave count because it would be fairly clear that Gold would be in a bear market for cycle wave a to complete.
To the upside, a new high above 1,170.19 would invalidate the bear wave count below and provide strong confirmation for this bull wave count.
Upwards movement is finding resistance at the upper edge of the blue channel and may continue to do so. Use that trend line for resistance, and if it is breached, then expect a throwback to find support there.
Click chart to enlarge.
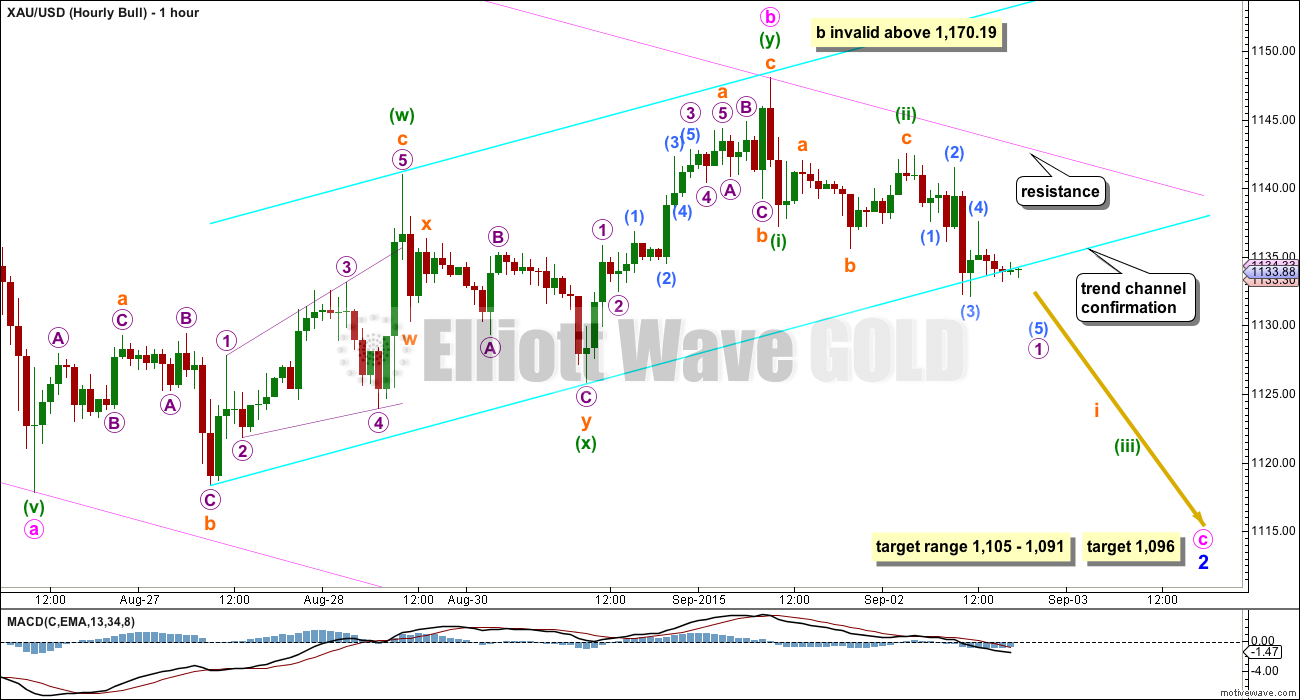
Minute wave b is very likely to be a complete double combination: flat – X – zigzag. However, there is still no confirmation that minute wave b is over. It is possible that it could continue higher. If minute wave b does continue, then it may not move beyond the start of minute wave a above 1,170.19. While there is no confirmation of a resumption of the downwards trend the risk remains that price could move higher. I will not move the invalidation point down until we have confirmation.
The bright aqua blue channel is a best fit about minute wave b. The channel has been slightly breached to the downside and price stalled at the line, but the breach is not convincing. At the time of this analysis, the only hourly candlestick below the line is incomplete and may yet see the candlestick move back above the line.
Only when there is at least one full red hourly candlestick below the lower line and not touching it would the breach be convincing. After that happens, if price shows a throwback to the line and finds resistance there, then the probability that minute wave b is over would further increase.
It is a common method to wait for a breach of support or resistance to occur, and then to enter a position on a throwback to a previous line of support or resistance. The tendency of price in all markets to behave in this way is known. When it does that provides a relatively low risk entry point because stops may be set just beyond the prior line of support or resistance, which means risk is kept low. If the particular situation offers a high potential reward, then a trade may be calculated to have a relatively low risk / high reward, and so be potentially very desirable. It must be accepted when using this method that price does not always behave as anticipated; there is always a risk of a loss.
There is not a clear five down yet at the hourly chart level. If a new low is seen below the end of submicro wave (3), then the downwards movement will still only subdivide as a three which could be a zigzag.
Minute wave c would reach equality in length with minute wave a at 1,096. This would see minor wave 2 end within the normal range for a second wave within a diagonal of between 0.66 to 0.81 the first wave, which is a range of 1,105 – 1,091.
BEAR ELLIOTT WAVE COUNT
Click chart to enlarge.
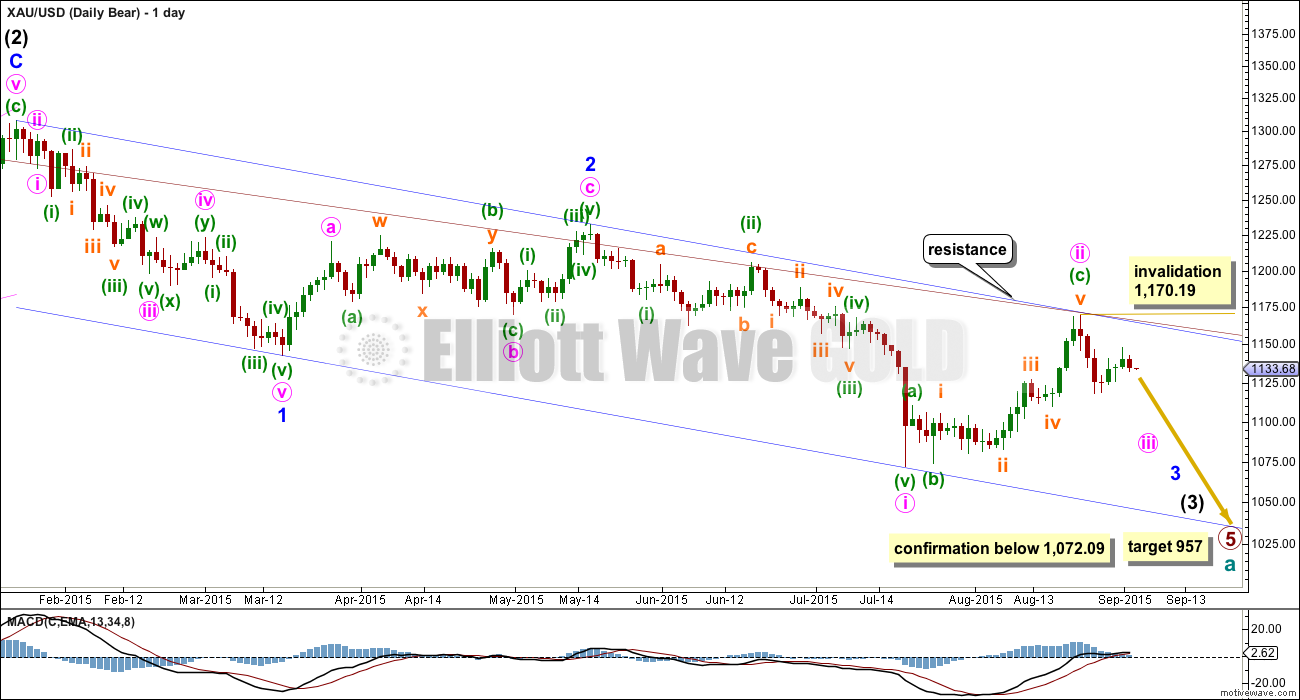
At this stage, the reduction of probability for the bull wave count sees this bear wave count about even now in probability.
This wave count now sees a series of four overlapping first and second waves: intermediate waves (1) and (2), minor waves 1 and 2, minute waves i and ii, and now minuette waves (i) and (ii). Minute wave iii should show a strong increase in downwards momentum beyond that seen for minute wave i. If price moves higher, then it should find very strong resistance at the blue trend line. If that line is breached, then a bear wave count should be discarded.
The blue channel is drawn in the same way on both wave counts. The upper edge will be critical. Here the blue channel is a base channel drawn about minor waves 1 and 2. A lower degree second wave correction for minute wave ii should not breach a base channel drawn about a first and second wave one or more degrees higher. If this blue line is breached by one full daily candlestick above it and not touching it, then this wave count will substantially reduce in probability.
Within minute wave iii, no second wave correction may move beyond the start of its first wave above 1,170.19. A breach of that price point should see this wave count discarded as it would also now necessitate a clear breach of the blue channel and the maroon channel from the weekly chart.
Full and final confirmation of this wave count would come with a new low below 1,072.09.
If primary wave 5 reaches equality with primary wave 1, then it would end at 957. With three big overlapping first and second waves, now this target may not be low enough.
Click chart to enlarge.
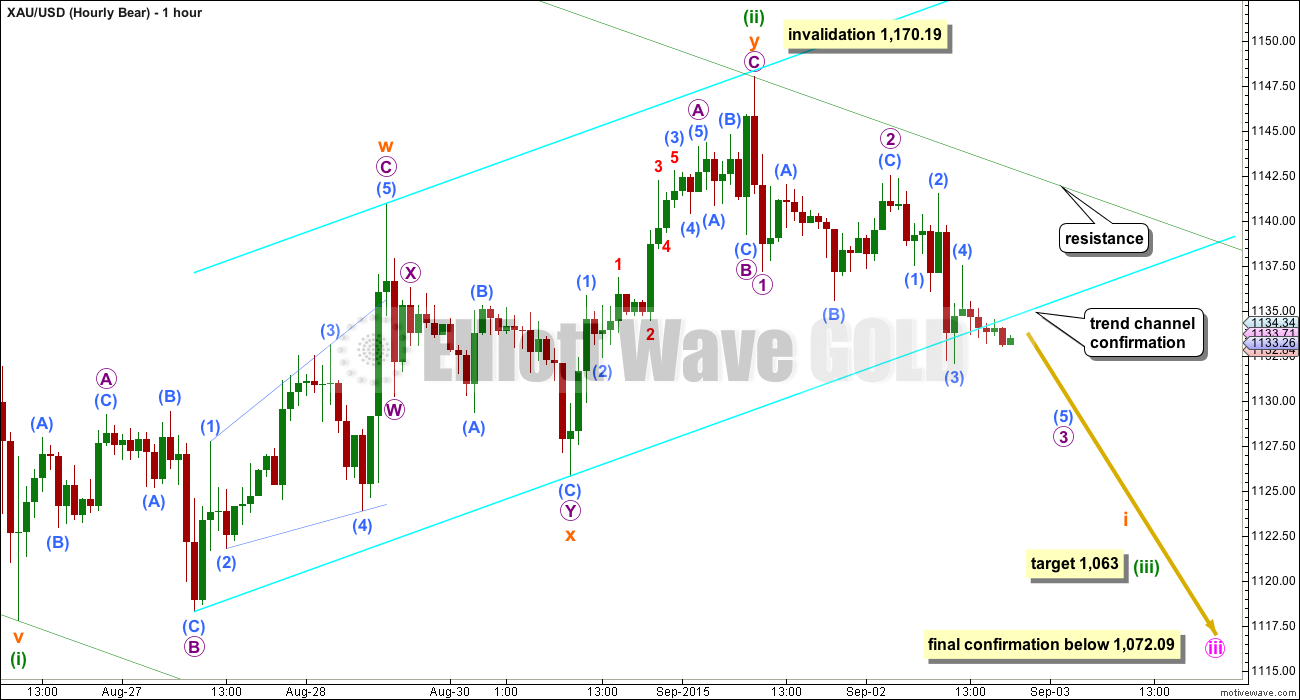
This wave count expects an impulse to be beginning downwards. An impulse subdivides 5-3-5-3-5. So far the first 5 down is complete.
The beginning of an impulse and the whole of a zigzag have exactly the same subdivisions.
Subdivisions are seen again in mostly the same way for both wave counts. Here I am looking at the possibility of instead of 1-2, 1-2 unfolding downwards it may be 1-2-3 for a new impulse. When micro wave 3 is complete, if the following upwards correction which may be micro wave 4 remains below micro wave 1 price territory at 1,137.23, then this idea may be correct. If downwards movement unfolds as described, then we may have a clear five down at the hourly chart level within the next 24 hours. That would provide full confidence that minuette wave (ii) is over (or minute wave b for the bull wave count).
Along the way down, upwards corrections for both ideas should find resistance at the upper edge of the channel, green on this bear wave count and pink on the bull. Here it is a base channel about minuette waves (i) and (ii); for the bull it is a corrective channel. They are drawn in exactly the same way.
At 1,063 minuette wave (iii) would reach 1.618 the length of minuette wave (i). This bear wave count expects to see a very strong increase in downwards momentum over the next couple of weeks, culminating in a huge movement for the fifth wave of minute wave iii (maybe another price shock).
TECHNICAL ANALYSIS
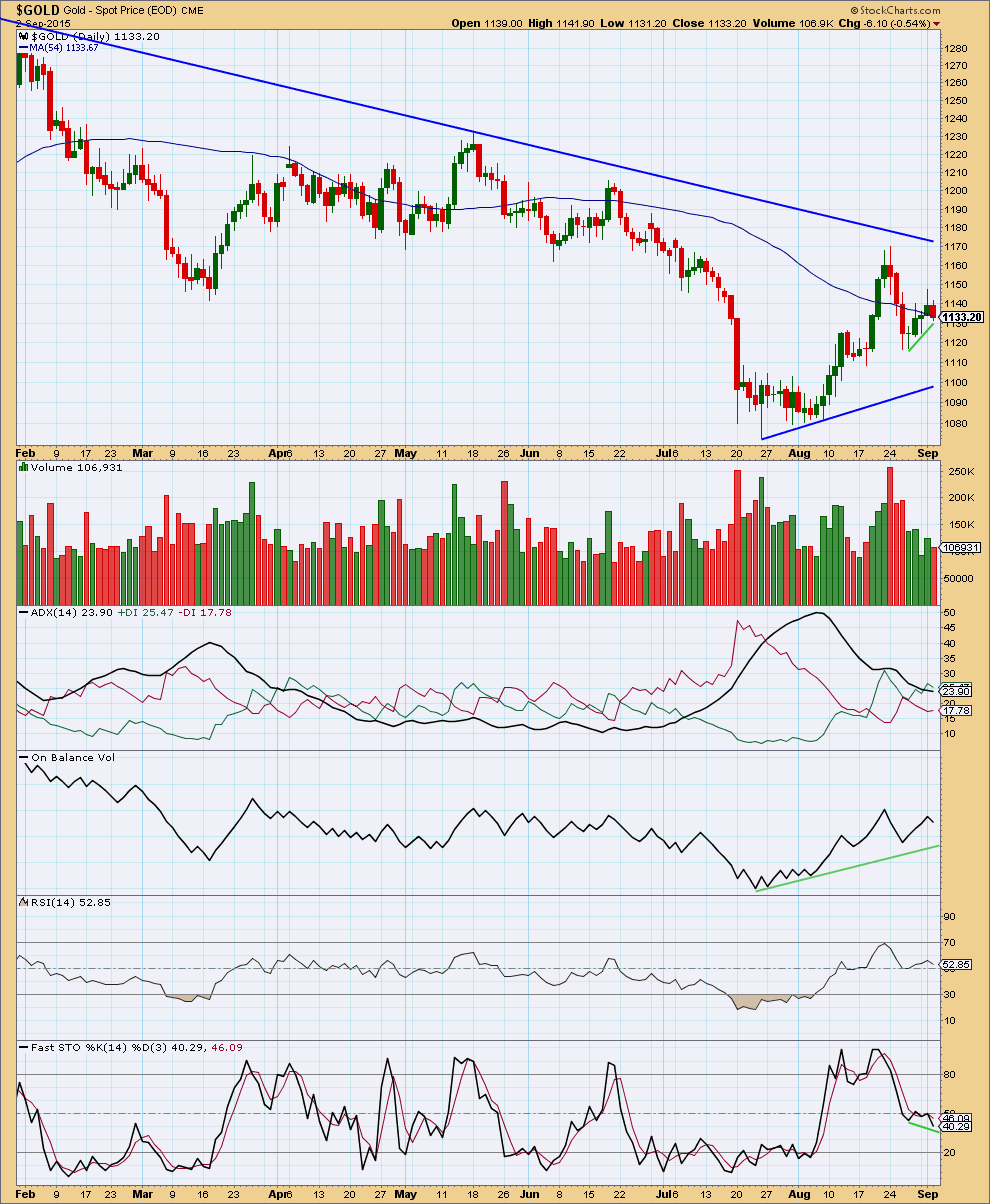
Click chart to enlarge. Chart courtesy of StockCharts.com.
Today’s red candlestick does not have increased volume. This is only a slight cause for concern; the first day of a new or resuming trend does not always show a strong increase in volume. I will be watching volume closely over the next few days. If downward movement comes on increasing volume, then it would support the Elliott wave counts; if it does not, then the Elliott wave counts would be in doubt.
The last swing high saw a rise in price accompanied by a rise in volume, and the following fall in price comes overall on a decline in volume. The volume profile of the last 12 days indicates there may be a new upwards trend developing.
ADX does not yet indicate a new trend (ADX does tend to be a lagging indicator). The black ADX line is pointing down. The market is range bound.
There is small hidden bullish divergence between Stochastics and price today: price has made a higher low while Stochastics made a lower low. This is bullish for the short term, but it is a weak signal. This weak signal in conjunction with the lack of confirmation so far on the Elliott wave counts indicates extreme caution should be used in your approach to this market today.
This analysis is published about 07:44 p.m. EST.
Lara are the targets for retrace back up different for bull and bear count from today’s full five wave down?
Is Friday expected to end higher than today?
Will next week start down and pick up downward momentum?
Richard, sorry, I’ve just finished writing up the analysis and didn’t quite manage to get it out before NY close.
I’m going to use a small best fit channel about this move and expect upwards movement to find resistance there. So the next correction may be very shallow, only about 1,128.
If that trend line is breached then the correction will be deeper for a second wave, and should find resistance at the wider base channel / corrective channel. About 1,138. That is less likely.
So to reply to your second question, yes, I expect next week to start down and pick up momentum.
Look out for a swift strong fifth wave to end a third. For the bear wave count maybe a big price shock downwards.
Dust chart looks like a flat, big c wave down next???
DUST has been going back up for hours today?
Actually looks like a leading diagonal, which means a steep second wave correction coming up?
Let’s see what lara has to say about gold.
if that is not an ending diagonal, could get messy near term
At what price is the backtest to aqua line??
I have it about 1138
THX
thank you Robert, and Papudi for asking
That is about 0.618 of current high to low as well.
That’s what I’ll be waiting for. I may miss out if it doesn’t get there, but I don’t like how miners and silver are up right now and gold only down $6.
Temporary as gold stayed low today since 10:22 am high and miners had slow drop for hours.
I may be wrong.
Bear backtest is at 1138, no doubt about it.
But if it is the bull, there will be one more drop from around 1129-1130 before the backtest. Invalidation for current rise = 1131.51.
Good morning Tham, Do you have an entry target for DUST. I’m hoping for a 4th retest of $24.35, I know hopes not a strategy.
Good morning, Robert.
It looks like a retest of 24.23 and if that fails, the correction has morphed into a combination targeting 22.30 / 21.15 or even 18.98. It is quite uncertain at this juncture.
Thanks, as always
Would that drop take us to 1090-1100ish to mirror Lara’s bull wave?
Yes.
I estimate that in the bull scenario, Minuette 3 could drop to anywhere between 1120 and 1110 (too early to tell). The fifth wave would hit Lara’s target.
Now that Gold has dropped from 1130 is it the bull scenario playing out now, in your opinion?
Hi Alister.
Both scenarios are still valid.
For the bear, subminuette 2 looks like a flat. I think it would be an expanded flat, otherwise the C wave cannot hit 1138. That means the current B wave should drop below 1121.98, the start of subminuette 2.
The bull requires a drop below 1121.98 otherwise it will have a truncated fifth.
Summarising, I am watching 1121.98.
If price does not drop below 1121.98, then the bear subminuette B will be a regular flat, and the backtest will reach lower than 1138.
If price drops below 1121.98, I’ll then consider whether the bull is still in play or if it is the expanded flat subminuette 2 of the bear. There is insufficient data now to distinguish between the two.
sry didnt read your answer above ^^
Thanks for the comprehensive answer, Tham – very helpful.
“Bear backtest is at 1138, no doubt about it.
But if it is the bull, there will be one more drop from around 1129-1130 before the backtest.”
Hi Tham,
could you explain why you think it is the bullcount in play if gold does one more drop from 1130 ;-)?
Hi Raphael. This is because 1121.98 was only the third wave and not the fifth of subminuette 1. SM 1 requires five waves, and hence a fourth and a fifth are required.
By the way, I have SM1 as 1142.57 – 1131.51 – 1134.45 – 1121.98 – 1130.77 – ?
big thanks
Has the second wave correction upward still to come? or already over?
im a bit confused
May of started at 8:44 at 1122?
Please see my comments to Papudi above.
I think it is over if it is the bear count, but not for the bull.
Sold my long for profit, went short this morning and now in profit again. Lara is doing a great job for us here.
Congratulations to all who were short Gold~! Woo Hoo what fun…. 🙂
H&S pattern may be in play
Even if you are not a fan of Dennis Gartman, his view that gold is currently being used as a “source of liquidity” seems to make sense and could be another reason why gold may fall as the S&P 500 and other world markets fall.
http://www.gold-eagle.com/article/panic-gold-store-liquidity
Zerohedge makes fun of him as a contrary indicator and claims it is more profitable to trade the opposite of his advice.
Trend channel confirmation has already occurred Wednesday after the close.
It is visible on the bear hourly count below the bright aqua blue channel with at least one full red hourly candlestick below the lower line and not touching so the breach is convincing and confirmed.
Lara did state in the video that Trend channel confirmation is confirmed.
At this time I can now see a complete five waves down (at least, it looks now like it’s in the final fifth wave as I type).
I think that’s the final confirmation I would need for confidence. The hourly channel is clearly breached too.
Good luck everybody! May the force be with you.
And it appears to be following the hourly bear count. If so, we may be close to completing subminuette 1 (orange). For Thursday’s day session, we may see sideways to up movement for subminuette 2 which could then set us up for a sharp move down after Friday mornings US jobs report.
Lara,
Is it possible we haven’t completed circle c and wave 1 yet but maybe completing that next?
I’m really sorry, I just don’t know what you mean.
Are you referring to the hourly bull chart? Are you referring to the hourly bear?
Do you mean is it possible the upwards movement is not over? I suppose it could be. But with price keeping on moving below the trend channel it looks less and less likely.
There is now a 5-3-5 down complete. It could be 1-2, 1 or it could be 1-2-3.
Sorry. I was talking about the bull. I’m wondering if (iv) finished at the 1119 area and now we are in circle c up to complete 1, instead of 1 being over at approx 1168 a few days back.
Gold just seems stalled, which doesn’t feel like explosive downward movement coming, miners the same. So I’m just looking for alternatives.
I think I recall now that we eliminated this count….
Okay.
Remember back in the end of June through to mid July, that impulse down started off a bit slow.
Sometimes Gold’s impulses do start a bit slow, with overlapping first and second waves. I recall when that last one began quite a few were very skeptical. But volume kept telling us it should break down.
I’m looking at the volume spike for the down day of 24th August, it’s the strongest volume day for months. And it’s a down day. That may again be telling us price is going to go down.
Hi Lara..
Email notification of today’s post arrived at 7:58pm…EST.
All good.
Thanks Ted. It must’ve been the server problems that affected notifications yesterday then.