
Both Elliott wave counts expected a small consolidation to begin and to last for one to three days. This is not what happened. Price moved lower.
Summary: Both Elliott wave counts still expect a consolidation to show up which should last one to three days. The consolidation should show up on the daily chart. With price today finding support at the bright aqua blue trend line on the daily chart, the consolidation may begin about here.
Changes to last analysis are bold.
To see the bigger picture on weekly charts click here.
BEAR ELLIOTT WAVE COUNT
Click chart to enlarge.
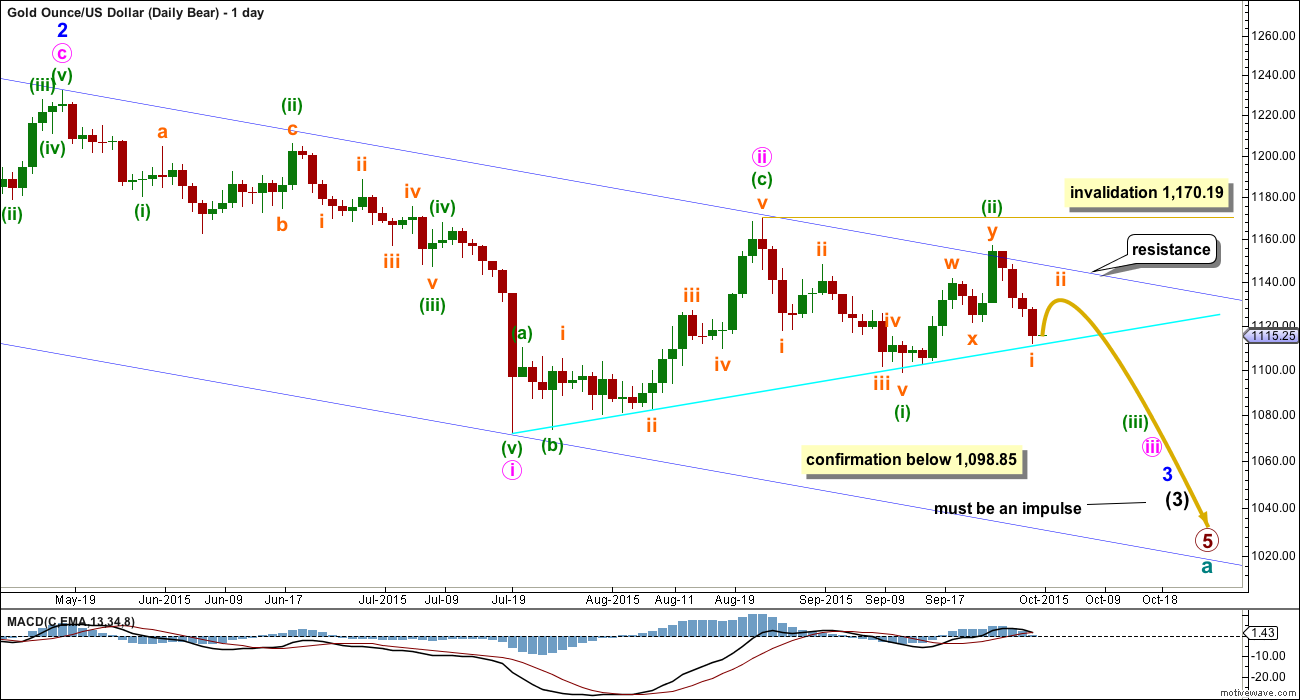
Gold has been in a bear market since September 2011. There has not yet been confirmation of a change from bear to bull, and so at this stage any bull wave count would be trying to pick a low which is not advised. Price remains below the 200 day moving average and below the blue trend line (copied over from the weekly chart). The bear market should be expected to be intact until we have technical confirmation of a big trend change.
This wave count now sees a series of four overlapping first and second waves: intermediate waves (1) and (2), minor waves 1 and 2, minute waves i and ii, and now minuette waves (i) and (ii). Minute wave iii should show a strong increase in downwards momentum beyond that seen for minute wave i. If price moves higher, then it should find very strong resistance at the blue trend line. If that line is breached, then a bear wave count should be discarded.
The blue channel is drawn in the same way on both wave counts. The upper edge will be critical. Here the blue channel is a base channel drawn about minor waves 1 and 2. A lower degree second wave correction should not breach a base channel drawn about a first and second wave one or more degrees higher. If this blue line is breached by one full daily candlestick above it and not touching it, then this wave count will substantially reduce in probability.
Minuette wave (ii) may not move beyond the start of minuette wave (i) above 1,170.19. A breach of that price point should see this wave count discarded as it would also now necessitate a clear breach of the blue channel and the maroon channel from the weekly chart.
Downwards movement from 1,170.19 will subdivide as a complete five wave impulse on the hourly chart, but on the daily chart it does not have a clear five wave look. Subminuette wave iii has disproportionate second and fourth waves within it giving this movement a three wave look on the daily chart.
Minuette wave (ii) will subdivide as a double zigzag, but it has a five wave look on the daily chart, not a three. Both the wave down labelled minuette wave (i) and the wave up labelled minuette wave (ii) have a better fit and look for the bull wave count than the bear at the daily chart level.
Gold has the most textbook looking structures and waves of all the markets I have analysed over the years, probably due to the high volume of this global market. And so I am quite concerned with the look of minuette waves (i) and (ii). Sometimes Gold has movements which don’t look perfect on the daily chart, but this is uncommon.
Sometimes Gold’s impulse waves start out slowly. There is a good example on this daily chart for minute wave i. When the fifth wave approaches that is when momentum sharply increases, and it often ends on a price shock with a volume spike. This is an even more common tendency for Gold’s third wave impulses. The strongest downwards movement is ahead, and it should be expected to arrive when subminuette wave v within minuette wave (iii) begins.
This bear wave count expects Gold is within a third wave at four wave degrees. Expect any surprises to be to the downside for this wave count.
For minuette wave (iii) to have a typical look on the daily chart, I would expect subminuette wave ii to show up as an upwards correction clearly. It would be likely to last about one to three days, with one to three green candlesticks or doji.
Full and final confirmation of this wave count would come now with a new low below 1,098.85.
I will remove the final target for primary wave 5 at this stage. If it were to reach only equality with primary wave 1 , then this wave count would end about 985. But it has begun with three big overlapping first and second waves, so the target no longer looks low enough. I will calculate a target for primary wave 5 to end at intermediate degree when intermediate waves (3) and (4) are complete. Primary wave 5 may not exhibit a Fibonacci ratio at primary degree.
Click chart to enlarge.
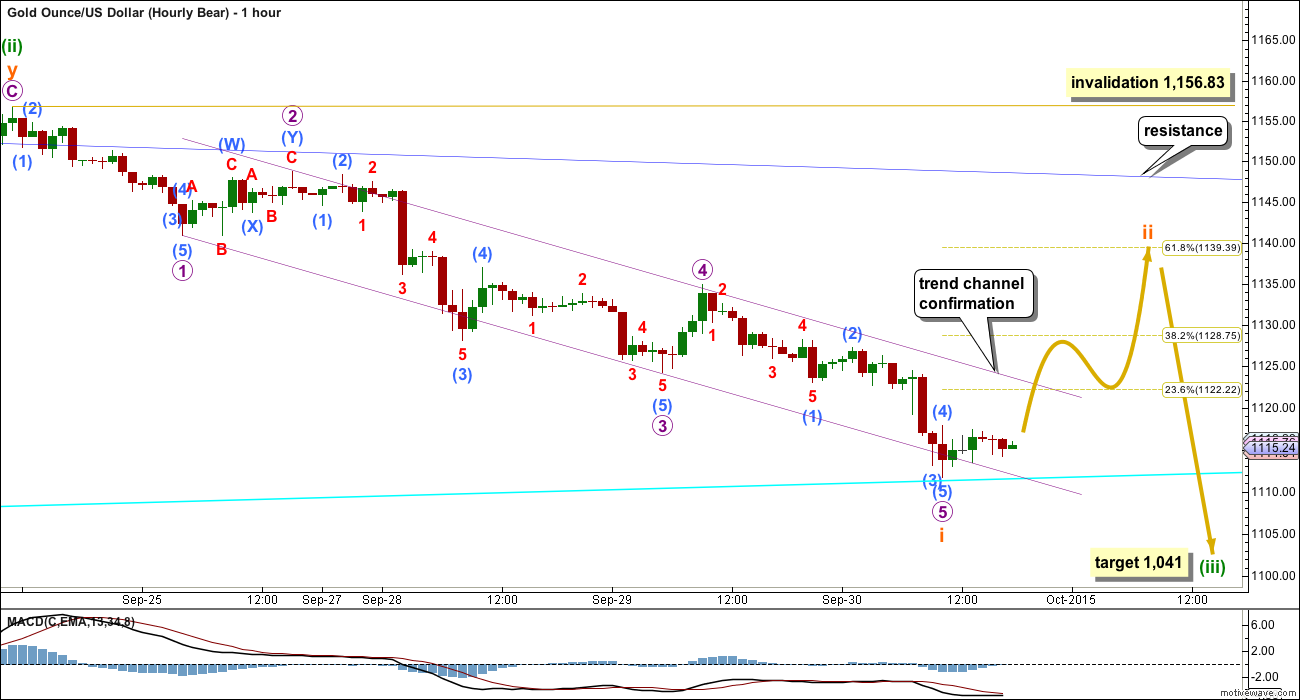
Subminuette wave i continued lower.
Ratios within subminuette wave i are: micro wave 3 is 1.37 short of 1.618 the length of micro wave 1, and micro wave 5 is 1.30 short of equality in length with micro wave 3.
When a channel is drawn about subminuette wave i using Elliott’s first technique it almost perfectly shows where micro wave 4 ended. The channel is overshot but not properly breached. Draw the first trend line from the lows of micro waves 1 to 3, then place a parallel copy on the high of micro wave 2.
When this channel is clearly breached by at least one full hourly candlestick above it and not touching it then it shall provide trend channel confirmation that subminuette wave i is over and subminuette wave ii has begun. While price remains within the channel it must be accepted that this labelling may be wrong, subminuette wave i may yet continue lower.
Because price has found support today at the bright aqua blue trend line (copied over here from the daily chart), it is more likely today that subminuette wave i is over.
Subminuette wave ii may end about the 0.618 or 0.382 Fibonacci ratios of subminuette wave i, with the 0.618 Fibonacci ratio favoured. It may not move beyond the start of submineutte wave i above 1,156.83.
If subminuette wave ii is very deep, then it may find resistance again at the upper edge of the dark blue channel copied over here from the daily chart.
BULL ELLIOTT WAVE COUNT
Click chart to enlarge.
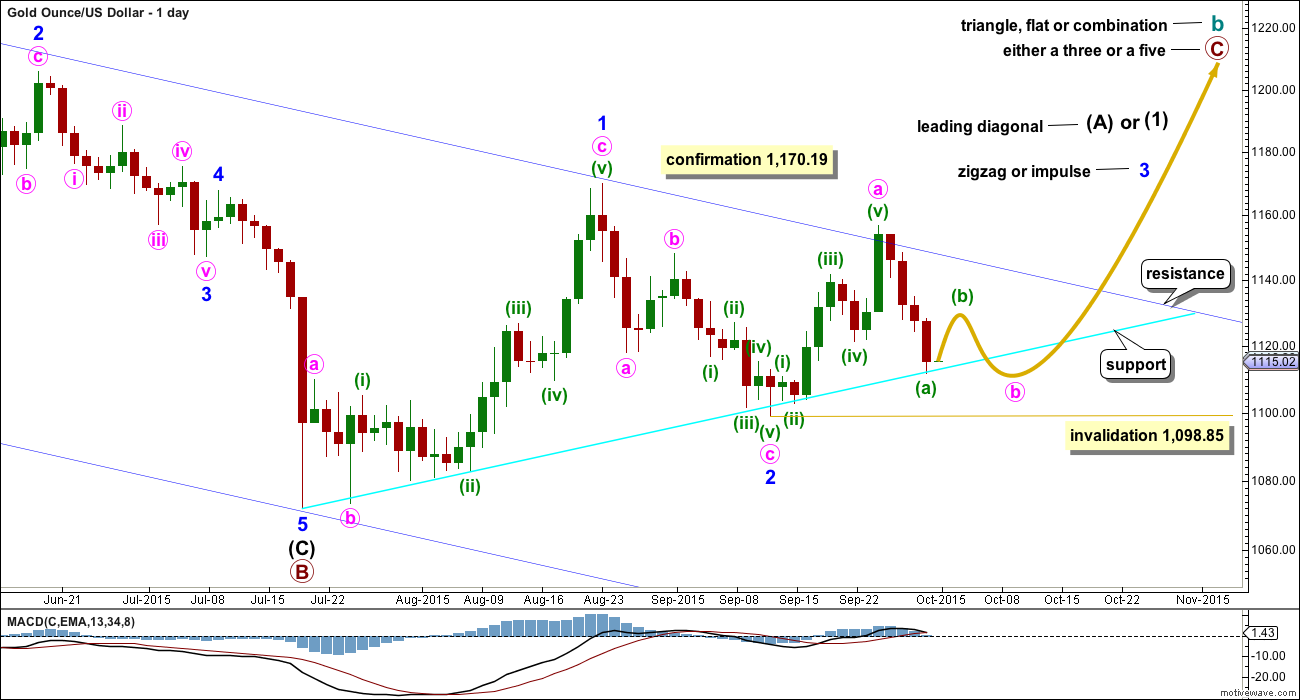
The bull wave count sees cycle wave a complete and cycle wave b underway as either an expanded flat, running triangle or combination. This daily chart works for all three ideas at the weekly chart level.
For all three ideas, a five up should unfold at the daily chart level for a movement at primary degree. This is so far incomplete. With the first wave up being a complete zigzag the only structure left now for intermediate wave (1) or (A) would be a leading diagonal. While leading diagonals are not rare they are not very common either. This reduces the probability of this bull wave count.
A leading diagonal requires the second and fourth waves to subdivide as zigzags. The first, third and fifth waves are most commonly zigzags, the but sometimes may appear to be impulses. So far minor wave 1 fits well as a zigzag.
To the upside, a new high above 1,170.19 would invalidate the bear wave count and provide strong confirmation for this bull wave count.
Upwards movement is finding resistance at the upper edge of the blue channel and may continue to do so. Use that trend line for resistance, and if it is breached, then expect a throwback to find support there.
Price has again come down to touch the bright aqua blue trend line. A bounce up from here would be highly likely.
Minor wave 2 can now be seen as a complete zigzag. It is 0.73 the depth of minor wave 1, nicely within the normal range of between 0.66 to 0.81 for a second wave within a diagonal.
Third waves within leading diagonals are most commonly zigzags, but sometimes they may be impulses. Minor wave 3 should show some increase in upwards momentum beyond that seen for minor wave 1. Minor wave 3 must move above the end of minor wave 1 above 1,170.19. That would provide price confirmation of the bull wave count and invalidation of the bear.
There now looks like a five up on the daily chart within minor wave 3. This may be minute wave a within a zigzag, or it may also be minute wave i within an impulse. The five up may be seen as complete at this stage, so a three down would be expected for this bull wave count. Minute wave b may not move beyond the start of minute wave a below 1,098.85.
Minute wave b is likely to have a clear three wave look to it on the daily chart, so minuette wave (b) is likely to show up as at least one green candlestick or doji. Because so far minute wave b is just a sheer drop and does not look like a three on the daily chart, I do not think it is over yet.
Click chart to enlarge.
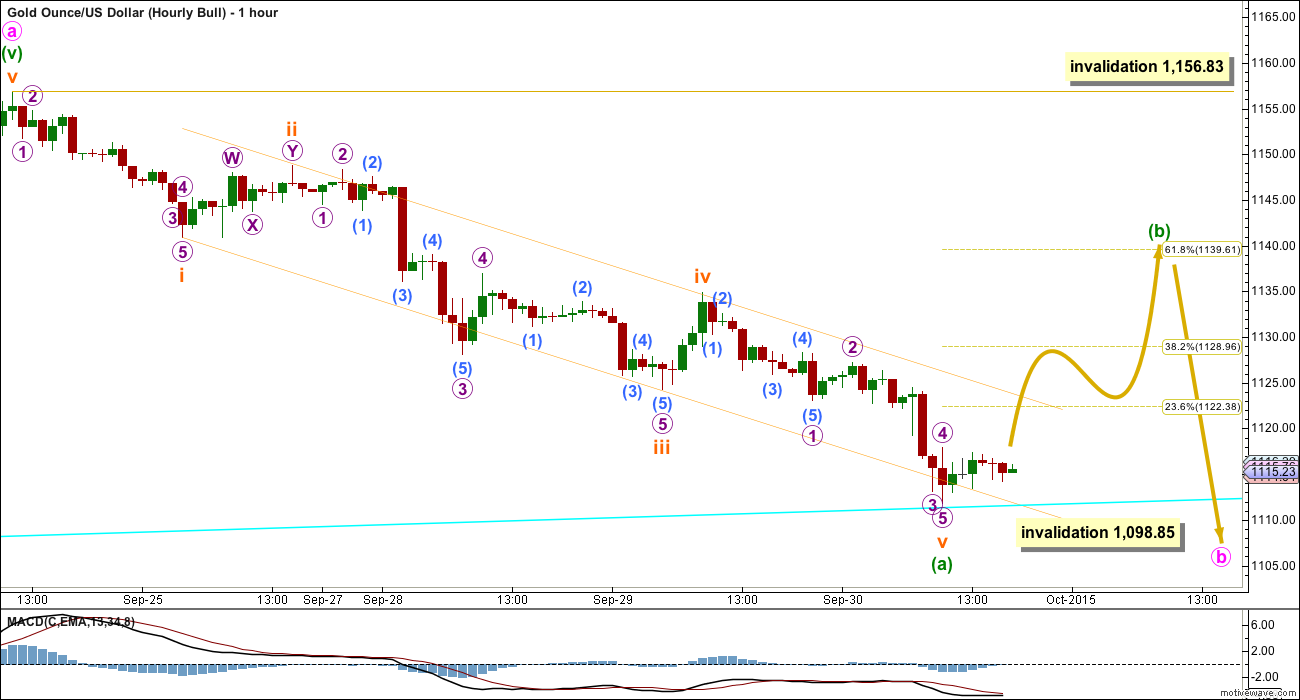
Minuette wave (a) subdivides as a five wave impulse. This now narrows the possible structures for minute wave b to a single or multiple zigzag. Within a zigzag, minuette wave (b) may not move beyond the start of minuette wave (a) above 1,156.83.
Minuette wave (b) may be any one of 23 possible structure including a triangle. If it unfolds as a running triangle, expanded flat or combination, then it may include a new low below its start at 1,124.29.
For minute wave b to have a clear three wave look at the daily chart level, minuette wave (b) within it should show up with one to three green candlesticks or doji.
There is no divergence between the two wave counts at the hourly chart level in terms of expected direction at this point, because A-B-C of a zigzag and 1-2-3 of an impulse have exactly the same subdivisions, 5-3-5. The only difference is here a triangle is allowed and it is not for the bear wave count.
When the correction for minuette wave (b) is complete the breakout should be downwards. Minute wave b may not move beyond the start of minute wave a below 1,098.85 for this bull wave count. How low the next wave goes may indicate which wave count is correct.
TECHNICAL ANALYSIS
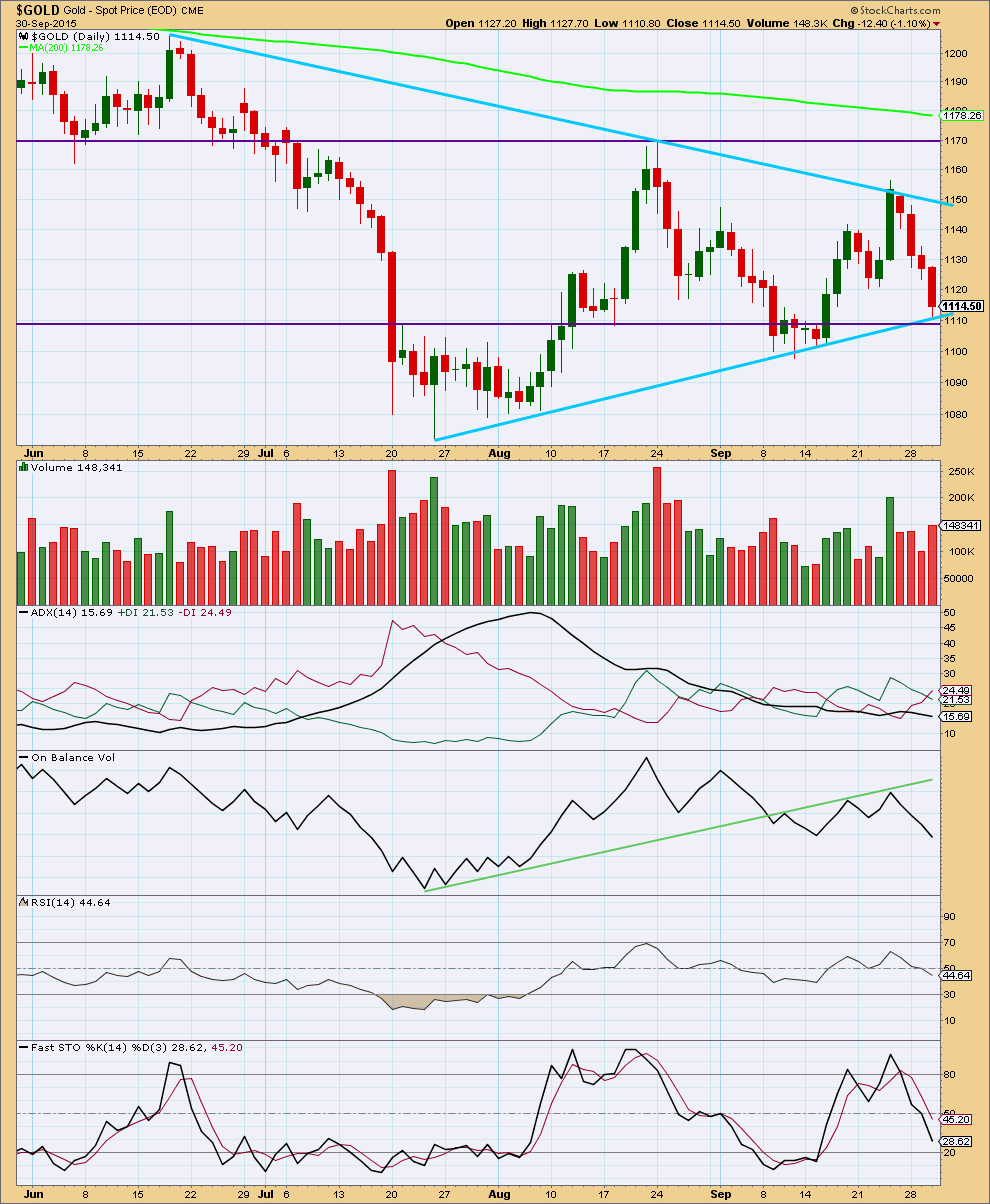
Click chart to enlarge. Chart courtesy of StockCharts.com.
Daily: Today’s stronger downwards day comes on clearly increased volume. The fall in price is again supported by volume. Overall, the volume profile looks to be more bearish than bullish and is supporting the bear wave count a little more than the bull.
The black ADX line is pointing downwards which indicates there is no clear trend to the market yet. ADX does tend to be a lagging indicator. ADX has been indicating no clear trend for almost every day since 7th August; Gold has been range bound now for some time. During this time, it is still a downwards day which shows strongest volume which indicates that a downwards breakout would be more likely than upwards.
It would be expected that during this consolidation price should find support at one or both of the upwards sloping aqua blue line or the horizontal purple line.
Overall, volume continues to decline as this consolidation continues. While price is being squashed between the sloping lines providing resistance and support and Gold’s range bound continues the consolidation comes closer to maturity. The breakout is closer.
A range bound system is outlined here using lines on price for resistance and support in conjunction with Stochastics to indicate overbought / oversold. A downwards swing is underway and should be expected to only end when price finds support at one of the lower trend lines and Stochastics is oversold at the same time. Today price may be finding support, but Stochastics is not yet oversold, so a little more downwards movement would be expected from this approach until Stochastics is oversold. During range bound markets, price does not move from resistance to support in straight lines but most often moves in a choppy and overlapping manner. Price may also overshoot resistance and support before one swing ends and the next begins. This is why trading a range bound market is very risky and best left to the most experienced traders. Stops and good money management are essential to ensure that losses are minimized because of whipsaws during a range bound market.
RSI at the daily chart level is neither overbought or oversold. There is room for the market to rise or fall.
Overall, at this stage, volume analysis indicates the bear wave count may be more likely than the bull.
This analysis is published about 07:51 p.m. EST.
I think that the impulse ended at today’s low. The hourly wave count will change very slightly to see the final fifth wave over at 1,111. This means the Fibonacci ratio for the retracement now has the 0.382 at 1,128 and the 0.618 at 1,139.
There is now some divergence at the hourly chart level at the last low. MACD fits well with the wave count, the strongest downwards move is a third wave.
If today’s session ends on lighter volume the idea of a correction continuing tomorrow would be supported. If today’s session ends on heavier volume that would be in doubt.
It looks like price is finding some support at that blue trend line.
Before I have any confidence that the correction has arrived I want to see the channel on the hourly chart breached. Currently price has again found resistance at the upper edge.
And so while price remains within that channel we should assume that the trend remains down. When the channel is breached we shall have confirmation that the correction has arrived.
Price is being squeezed between the upper edge of the small channel on the hourly chart and the lower bright aqua blue line.
Any wave counts?
How low might Gold drop to now before heading up to the next target area of 1,129?
It could keep going down, and the safest assumption to make is that it will keep going down UNTIL the channel on the hourly chart is breached.
but today with some divergence between today’s low and MACD that’s a short term bullish indicator.
the EW structure is complete, there’s divergence, it’s trying to pick a low which is not advised but the probability of a correction turning up here is pretty high.
to have confidence though the channel must be breached.
My guess on retrace bottom target this morning is at 1114.25 when gold bounces up.
So if gold hits that area and GDX is down I may buy it and hold until 1129 area
as long as indicators show GDX has bottomed in 1, 5, and 15 minutes time frames.
Today high 1119.28 at 10:01 am
today low -1111.14 at 3:07 am
= 8.14 difference
x .618= 5.03
1119.28 – 5.03 = 1114.25
Any comments.
Wednesday low 1111.76 at 10:33 am was supposedly the end of subminuette wave i.
However gold went lower today to 1111.14 at 3:04 am so I think that would be the bottom of subminuette wave i.
I wonder if that changes anything else?
And next targets are still about the 1129 then 1122 then 1139 areas?
Lara: EWP allows to redraw the channel after extended wave 3 is complete.
In daily and weekly chart can we not redraw the channel parallel to the line from PM wave 2 and PM wave 4 and copy over to end of PM wave 3 to get now target for PM wave 5 ??????
You could. But then primary 5 would breach the channel.
Take a look on the weekly chart (semi log scale) and try it using both techniques:
1. First trend line from 1 to 3, copy on 2.
2. First trend line from 2 to 4, copy on 3.
See for yourself. Which channel best contains this wave?
I would like to ask a question of Lara:
Could the price activity since the low of 1180 on June 27th 2013, be an ending diagonal?
If the price action since then is an ending diagonal then the 5th sub division now playing itself out, and will soon lead to a change in trend and a 4th wave bottom.
I would like to know your arguments against this count.
The fourth wave would not be a triangle. You’d be ignoring a rather obvious triangle to do such a wave count. The fourth wave would then have to be a really brief zigzag, and you’d also lose that almost perfect proportion between primary 2 and 4.
The diagonal couldn’t begin at the low of 1,180. That is a low, not a high. If you want me to consider an ending diagonal for primary wave 5 then you’d need to be accurate at which point it begins. A chart with your idea outline would be most useful.
In any idea you have please note that the wave up from 1,131 in November 2014 to 1,308 in January 2015 will not subdivide as a zigzag. I know other Ellioticians have this as a zigzag, but I have looked at it in detail and I cannot resolve how they manage to do that and not break any Elliott wave rules. To see what I mean look at my video of 20th August here. Go to 10:27 to see the explanation.
Lara, your wiggly arrows are lovely but wiggly or straight I think the fine folks here appreciate seeing where corrections may arrive in the trend.
Sitting on a board waiting to catch the best wave I want to count them and see them. Yoda says: “count them we do and see them we must”.
” Yes, members seem to prefer it if I leave more space on the RHS and have wiggly arrows.”
LOL
Thank you Davey. Made me smile.
Its one of my biggest goals to try and show where a correction will arrive and where it may end. And its one of the most difficult things to do.
I need to keep remembering the mantra “the trend remains the same until proven otherwise” and that it applies to all time frames. And I need to use channels to indicate the arrival of a correction and its conclusion.
And in the meantime I wish the darn Pacific ocean would send me some waves. Nothing here for weeks now. It’s having a personality crisis, it thinks its a lake.
Lara play some of The Beach Boys Surfing music.
They had lots of great surfing songs maybe their ‘Good Vibrations’
will attract wild surfing waves for you.
I’m going to meditate for some awesome ocean waves at your beach
this weekend for you to ride like the wind. Surfs Up!
Went long JNUG this morning at $7 when I saw gold slowly continuing it’s slide. Looking to hold it for this corrective bounce coming up.
Thanks for the fabulous analysis Lara, 7% gain so far, a nice cushion to have.
M
Brilliant!
Reminder: the reverse splits for NUGT, JNUG, & JDST will start Thursday.
http://www.direxioninvestments.com/press-release/reminder-direxion-to-execute-reverse-share-splits-of-six-leveraged-etfs
Outstanding shares will drop by 90% for all ETF’s so as the market cap will remain same.
Now market maker needs to create more shares going forward. How will that happen? …. I do not know???
It is all automatic and just a numeric switch.
IMHO: Gold price toppy under pivot with 1123 on the outside looking for a pullback / drop to take out 1111 for lower before an upside move / snap rally with 1140-41 still seen as restrictive….
Gold, USD and Miners all seem to be triangulating. Breakouts coming soon. Possible next moves for $USD.
Nice chart. You can move the chart on RHS away from right scale provide more room for notations. In the setting under “Extra Block” add any number 10,15,20….
I pointed out to Lara also for her TA chart also.