
Downwards movement is unfolding as expected for both Elliott wave counts.
Summary: Downwards movement should continue to 1,096 for the bull wave count or 1,063 for the bear wave count. On the way down, a new low below 1,072.09 would fully invalidate the bull wave count and provide confidence in the bear. Use the channel on the hourly chart to show where price may find support and resistance on the way down; a strong fifth wave may break below support. At this stage, I will favour neither bull nor bear wave count because both expect price to keep going down short term. Price will tell us which one is correct
Changes to last analysis are bold.
To see weekly charts and the three different options for cycle wave b (bull wave count) click here.
BULL WAVE COUNT – DAILY
Click chart to enlarge.
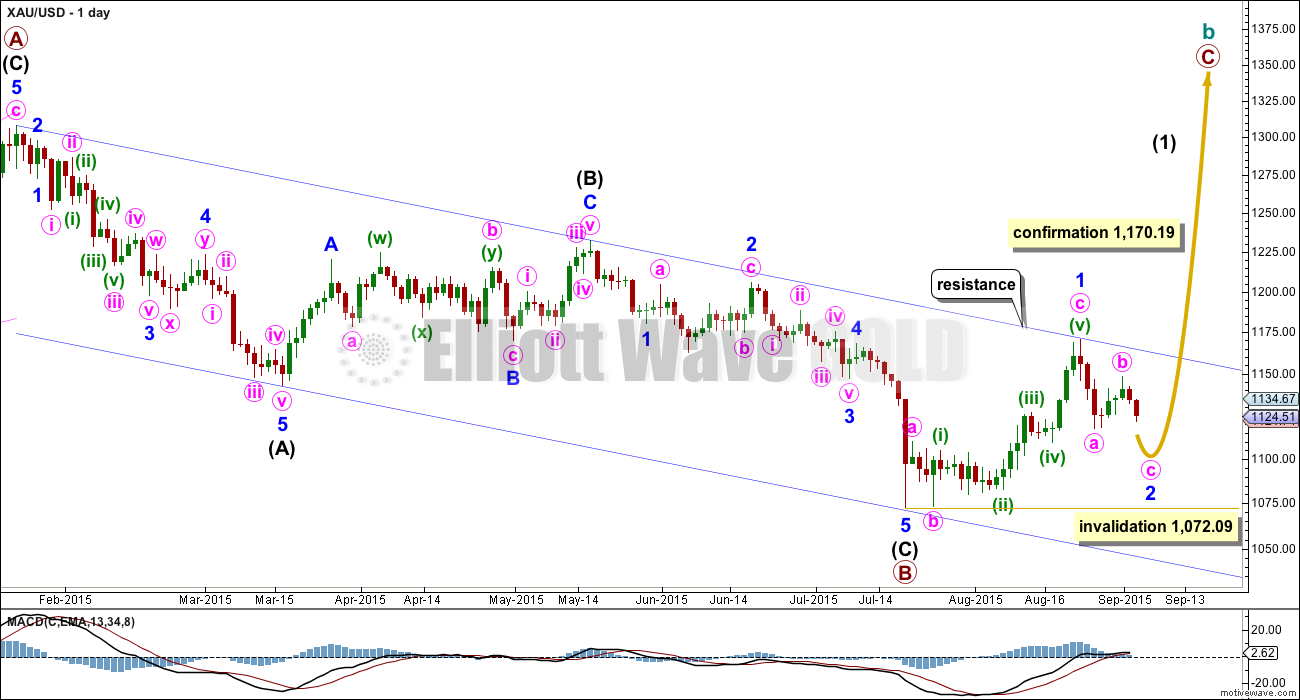
The bigger picture at super cycle degree is still bearish. A large zigzag is unfolding downwards. Along the way down, within the zigzag, cycle wave b must unfold as a corrective structure.
At this stage, there are three possible structures for cycle wave b: an expanded flat, a running triangle, or a combination.
This daily chart works for all three ideas at the weekly chart level.
For all three ideas, a five up should unfold at the daily chart level. This is so far incomplete. With the first wave up being a complete zigzag the only structure left now for intermediate wave (1) would be a leading diagonal. While leading diagonals are not rare they are not very common either. This reduces the probability of this bull wave count now to about even with the bear wave count.
A leading diagonal requires the second and fourth waves to subdivide as zigzags. The first, third and fifth waves are most commonly zigzags, the but sometimes may appear to be impulses. So far minor wave 1 fits well as a zigzag.
Minor wave 2 may not move beyond the start of minor wave 1 below 1,072.09. If this invalidation point is breached, then it would be very difficult to see how primary wave B could continue yet lower. It would still be technically possible that primary wave B could be continuing as a double zigzag, but it is already 1.88 times the length of primary wave A (longer than the maximum common length of 1.38 times), so if it were to continue to be even deeper, then that idea has a very low probability. If 1,072.09 is breached, then I may cease to publish any bullish wave count because it would be fairly clear that Gold would be in a bear market for cycle wave a to complete.
To the upside, a new high above 1,170.19 would invalidate the bear wave count below and provide strong confirmation for this bull wave count.
Upwards movement is finding resistance at the upper edge of the blue channel and may continue to do so. Use that trend line for resistance, and if it is breached, then expect a throwback to find support there.
Click chart to enlarge.
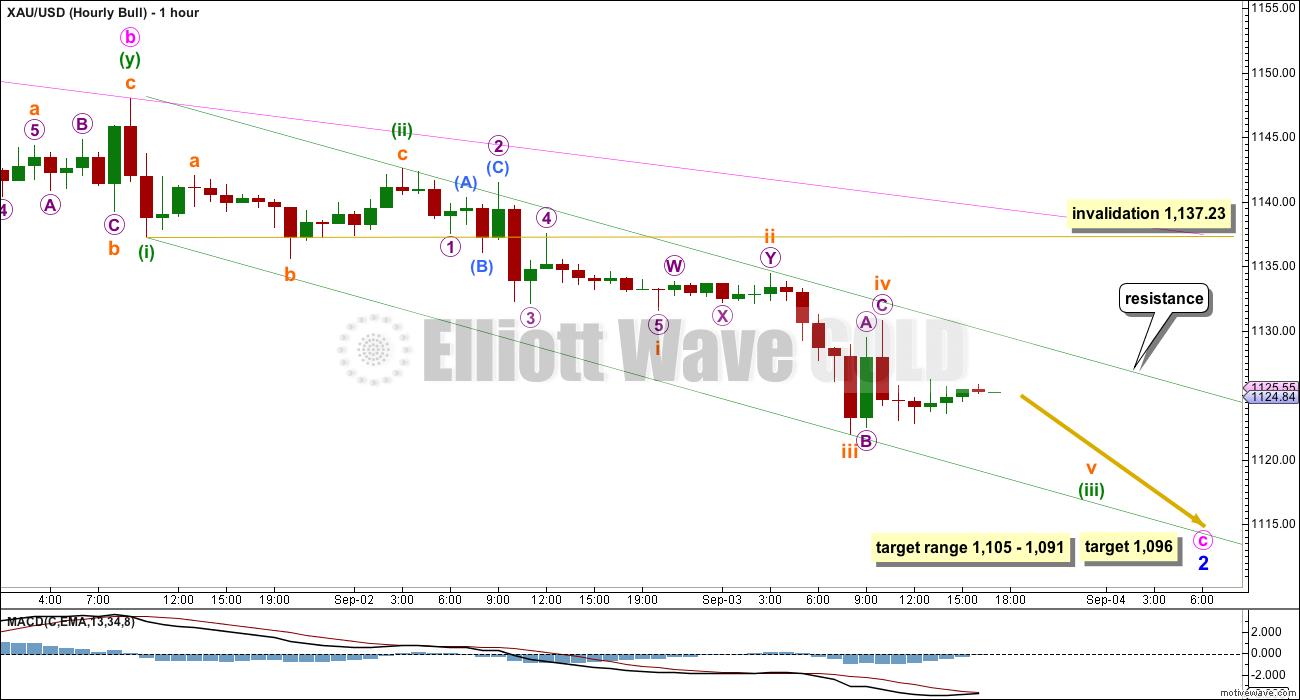
Minute wave b is over. Downwards movement clearly breached the channel drawn on yesterday’s hourly chart. That channel has performed its purpose and may now be discarded. Keep drawing a channel about this downwards zigzag of minor wave 2 (pink): draw the first trend line from the start of minor wave 2 (the high labelled minor wave 1 on the daily chart) to the high labelled minute wave b, then place a parallel copy on the low of minute wave a (now off to the left of the chart). For this bull wave count, that channel is a corrective channel; for the bear wave count, that channel is a base channel and drawn in exactly the same way. If the smaller channel I am adding today about this new downwards movement (green) is breached, then look for upwards corrections along the way down to find strong resistance at the upper edge of the pink channel.
There is more than one way to label this downwards movement so far. I will present two different ideas at the hourly chart level. I consider this first idea here to have a higher probability because it has better alternation.
Minute wave c must subdivide as a five wave structure, either an ending diagonal or an impulse. At this early stage, minute wave c looks like a simple impulse.
Within minute wave c, minuette waves (i) and (ii) are likely over as labelled. Minuette wave (iii) is incomplete.
Within minuette wave (iii), there is perfect alternation between subminuette wave ii as a shallow combination and subminuette wave iv as a deeper zigzag. Subminuette wave v looks like it may be extending. If this labelling is correct, then I would expect to see a swift strong end to minuette wave (iii). When subminuette wave v moves into its middle we may see a strong increase in downwards momentum. This may have the power to break through support at the lower edge of the green channel.
Draw an acceleration channel about this downwards movement: draw the first trend line from the lows of minuette wave (i) to the last low, then place a parallel copy on the high of minuette wave (ii). Keep redrawing the channel as price moves lower. When minuette wave (iii) is complete this channel may show where minuette wave (iv) finds resistance.
Minuette wave (iv) may not move into minuette wave (i) price territory above 1,137.23.
BEAR ELLIOTT WAVE COUNT
Click chart to enlarge.
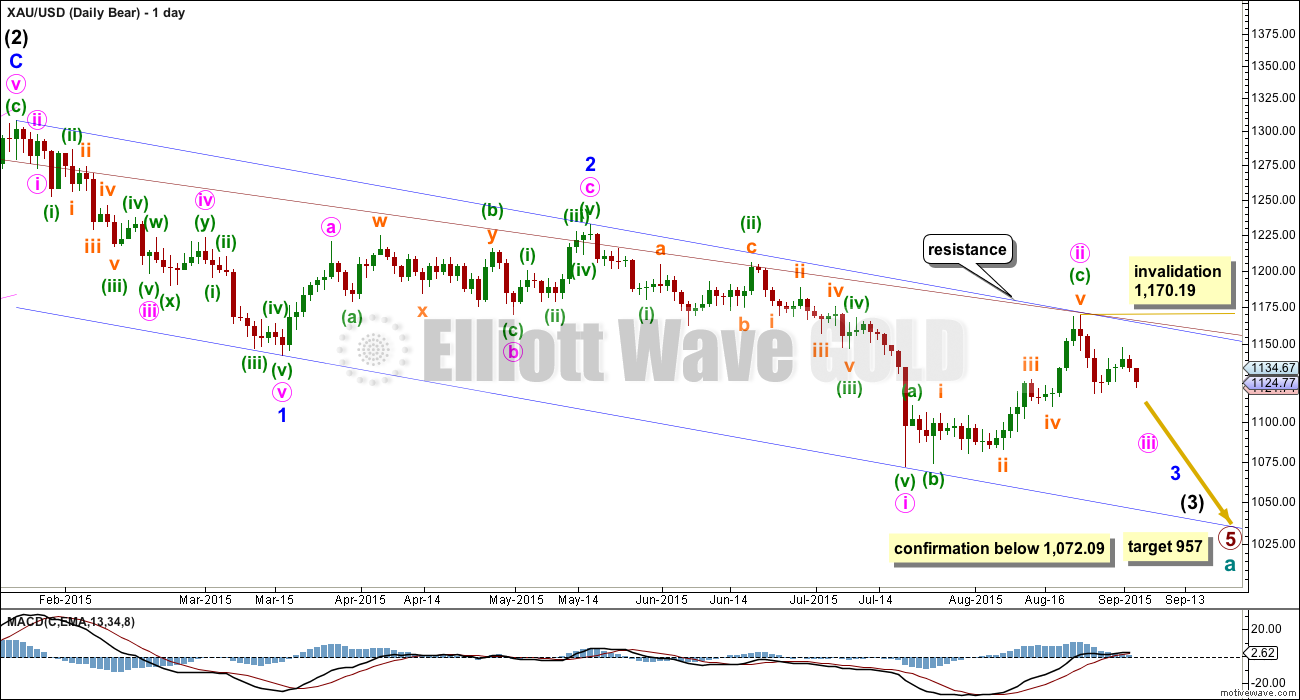
At this stage, the reduction of probability for the bull wave count sees this bear wave count about even now in probability.
This wave count now sees a series of four overlapping first and second waves: intermediate waves (1) and (2), minor waves 1 and 2, minute waves i and ii, and now minuette waves (i) and (ii). Minute wave iii should show a strong increase in downwards momentum beyond that seen for minute wave i. If price moves higher, then it should find very strong resistance at the blue trend line. If that line is breached, then a bear wave count should be discarded.
The blue channel is drawn in the same way on both wave counts. The upper edge will be critical. Here the blue channel is a base channel drawn about minor waves 1 and 2. A lower degree second wave correction for minute wave ii should not breach a base channel drawn about a first and second wave one or more degrees higher. If this blue line is breached by one full daily candlestick above it and not touching it, then this wave count will substantially reduce in probability.
Within minute wave iii, no second wave correction may move beyond the start of its first wave above 1,170.19. A breach of that price point should see this wave count discarded as it would also now necessitate a clear breach of the blue channel and the maroon channel from the weekly chart.
Full and final confirmation of this wave count would come with a new low below 1,072.09.
If primary wave 5 reaches equality with primary wave 1, then it would end at 957. With three big overlapping first and second waves, now this target may not be low enough.

Click chart to enlarge.
This wave count expects an impulse to be beginning downwards. An impulse subdivides 5-3-5-3-5. So far the first 5 down is complete.
The beginning of an impulse and the whole of a zigzag have exactly the same subdivisions.
On this hourly chart, I am looking at a different way to label this recent downwards movement which could be a complete impulse to the last low for a first wave, which may be followed by a deeper second wave correction.
Within subminuette wave i, there is inadequate alternation between micro waves 2 and 4. Micro wave 2 was a shallow 0.49 expanded flat and micro wave 4 was a more shallow 0.26 double combination. There is some alternation in depth and structure, but flats and combinations are very similar and do not exhibit sufficient alternation for confidence in this idea.
This is possible, but less likely than how I have labelled this movement for the first hourly chart. This means that it is more likely corrections should find resistance at the upper edge of the small channel (green on the hourly bull chart and violet here) than that price will breach the channel.
If price does break above the upper edge of this violet channel, then look for it to find very strong resistance and not break above the upper edge of the green channel.
Subminuette wave ii may reach up to the 0.618 Fibonacci ratio of subminuette wave i at 1,138. Subminuette wave ii may not move beyond the start of subminuette wave i above 1,148.04.
TECHNICAL ANALYSIS
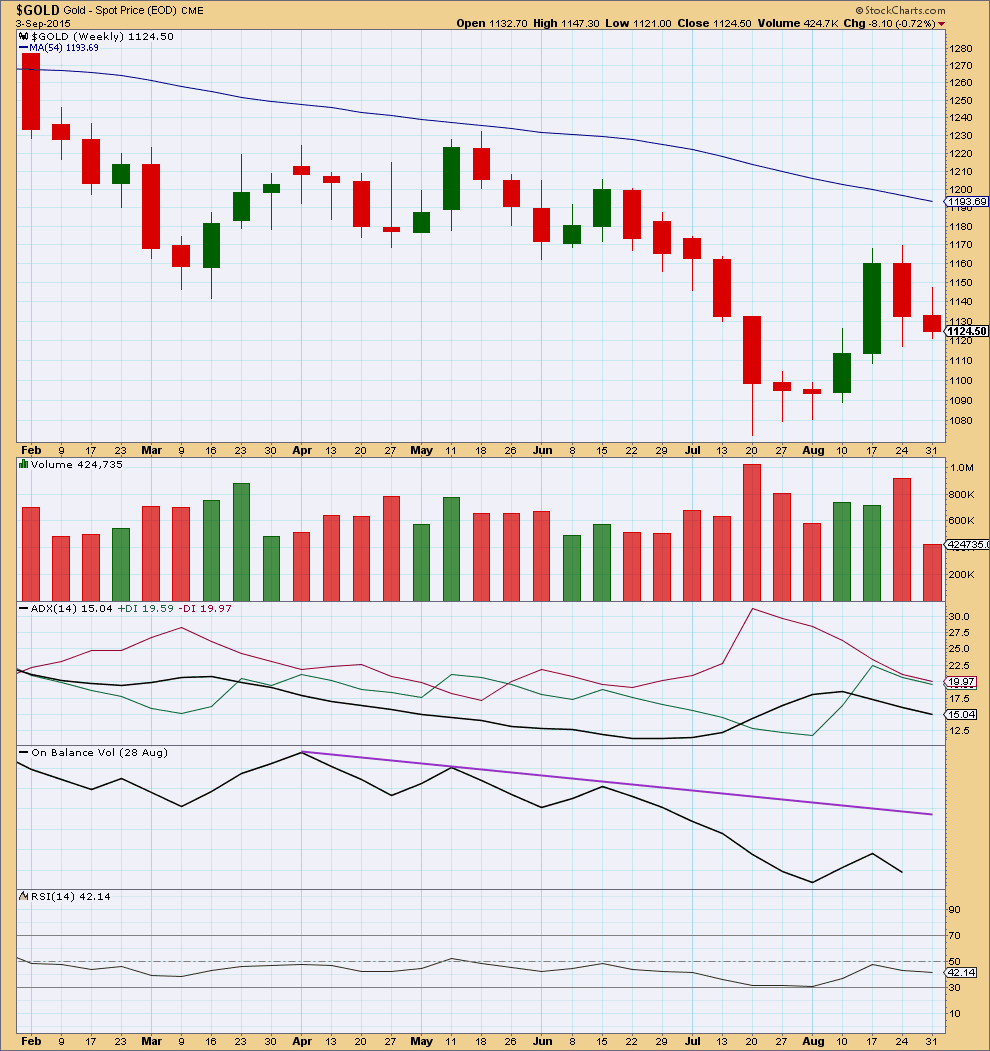
Click chart to enlarge. Chart courtesy of StockCharts.com.
With the daily chart giving conflicting information, maybe a step back to look at the weekly chart can provide a little guidance.
For recent movement, it is clear that the strongest week was a down week as price reached the last swing high at 1,169. This indicates price may break out downwards and that upwards movement was a correction against a prevailing downwards trend which favours the bear wave count.
ADX at the weekly chart level currently indicates no clear trend, so the market is consolidating. ADX is a lagging indicator, and this lack of trend indication may be due to upwards movement being a correction against a downwards trend.
On Balance Volume remains below a trend line which goes back to April, and is now substantially below it. This too is bearish.
Overall the weekly picture is more bearish than bullish.

Click chart to enlarge. Chart courtesy of StockCharts.com.
Today’s red candlestick comes with slightly decreased volume. This puts the Elliott wave counts today in slight doubt. However, looking back at the last downwards trend for gold from 18th June to 24th July, the last and strongest downwards leg began with two days of relatively light and declining volume. Thereafter, volume overall increased as price moved lower, but the increase was not seen every day; small corrective days along the way down showed small decreases in volume. The Elliott wave counts may be in some doubt, but it is very slight.
The market can fall of its own weight, but an increase in volume for a fall in price does add confidence to direction expected. Today volume is not adding confidence to the wave counts.
What is still clear from volume is the last rise in price, which began six days ago, was not supported by a rise in volume. This indicates that rise in price was a small correction against a downwards trend, at least in the short term.
The other thing that is clear from volume is the strongest day most recently was the strong downwards day of 24th August. This may be an indication that Gold should move lower.
ADX continues to indicate the market is not yet in a clear trend while the black ADX line points down.
A shorter held trend line on On Balance Volume has not yet been reached at the daily chart level. When On Balance Volume reaches that line then it may find some support. If it breaks through, then that would be strong bearish indication. OBV is pointing lower today which does provide some support to the fall in price. There is no divergence. OBV agrees with the price direction.
There is still slight hidden bullish divergence between price and Stochastics, but this is a weak signal.
Overall the picture at the daily chart level is mixed and unclear, but very slightly favours the bear wave count over the bull.
This analysis is published about 05:23 p.m. EST.
In 2008 when the stock market crashed gold also crashed.
‘Bearish divergence’ is warning investors not to buy the dip in the stock market
Sept 4, 2015 10:04 a.m. ET
The S&P 500 could fall a lot further before a ‘bullish divergence’ appears to suggest a potential bottom
http://www.marketwatch.com/story/bearish-divergence-is-warning-investors-not-to-buy-the-dip-in-the-stock-market-2015-09-04
Dow posts triple-digit drop, caps second worst week in 2015 – Sept 4, 2015 5:31 p.m.
S&P 500 post 3.4% loss over the week
http://www.marketwatch.com/story/us-stocks-futures-fall-weekly-drop-in-sight-as-jobs-report-looms-2015-09-04
Volume is very slightly higher today. The fall in price had some support. Not a lot, but a little. That’s good to see.
I’ll again have two different ideas at the hourly chart level for you today.
The first follows on from yesterdays idea on the hourly bear: subminuette waves i and ii are now complete. A third wave may be beginning. Invalidation point at 1,133.44.
The second idea sees an impulse complete at today’s low and so a second wave correction to unfold. For the bear this may turn up on the daily chart as a green candlestick for Monday. Invalidation point right back up at 1,148.04.
Both scenarios are valid. Both wave counts will expect more downwards movement next week.
The overshoot of the trend channel makes the scenario on the hourly bear wave count look right. The scenario on the hourly bull only makes sense if there was a truncated fifth wave, and that looks wrong.
I expect that there is now another 1-2 complete and Gold is beginning to move into the middle of a third wave. For the bear this slow beginning could continue into next week, and may try to convince us that a strong third wave is not going to take off, right before it does. This has happened before.
For the bull wave count next week should see minute wave c down come to an end.
I entered a small short position last night (my time) when price came up to touch the trend line on the hourly chart. I set my stop just above the invalidation point on the hourly bull chart, just above 1,137.23. It’s my technique to close my computer and leave it for several hours after setting a trade. I woke this morning to see that spike, and still a profit. Price shocks normally reverse quite quickly, if I had been watching it as it unfolded I may have panicked and exited for a loss. I prefer to trade with as little emotion as can be managed.
This morning I’ve moved my stop to just below my entry so I have zero risk. I may look at adding to that short position next week as Gold moves lower because I have a little more confidence in the bear wave count at this stage. But not enough yet for a larger position.
I will consider where to take profits next week. It will be 1,096 minimum, but if the bear is correct I want to hold a position while the middle of a big third wave unfolds.
And dammit, my short is stopped out for a tiny profit. Oh well. That’s my technique. It didn’t “stick”. No loss. Will try again.
That last big trade on NZDUSD took six attempts: one loss, five small profits, before it “stuck” and I rode it down for weeks.
Lara, did you just swear?
Very funny, I love it.
Lara, in the bullish scenario, how probable or improbable is it that minor 2 is over here. With today’s move, there would be no truncation of the zigzag.
Highly unlikely.
Miners going green….
Tham and Shahab – and of course anyone else that follows DUST.
Miners are a hybrid of gold and stock. If (of course always if) DOW and SP 500 continue down at same time gold moves down, miners would have a very strong pull down which would translate to explosion up in DUST.
Do your DUST charts see an explosion up in short term?
Hi Davey.
In the bear scenario for gold, and my bull count for DUST, I believe that DUST follows a regular flat at supercycle / cycle degree. This targets 83-84 / 103 / 111 depending on the waves in between. At this point in time, these targets seem quite far fetched, and I may have to make modifications based on price movements.
There are now four nested 1-2s, and we are currently in the process of finishing that fourth “2” and so I would expect an explosive third wave to emerge. Let’s hope this count is correct. It would mean very good gains.
Tham, thanks. I believe you also follow volatility. In the short term (say over next month) with both SP 500 and Gold trending down, which do you believe has the the best possible gain TVIX or DUST ?
It is hard to say which gives the better gain. TVIX technically follows volatility and not S&P. Volatility follows human sentiment and how investors react to the drop in S&P market is difficult to determine. Offhand I will say they are about even.
Well, where Dust is concerned I think its a drop before the pop. (right now that is)
where gold is concerned I have no idea.
So good to see all you active traders making plays. I just haven’t been trading lately and it is so hard for me to follow what you guys are talking about without seeing your chartings– very visual here. But really appreciate Alan Tham and Shahab Zaidi’s discourse.
Hope to see you all Tuesday…
My take on the gold price movement so far.
If the bear is playing out, the backtest ended at 1132.66 (subminuette 2). We are now in subminuette 3, and its micro 1 has completed at 1116.82. Micro 2 is underway, having completed its A wave at 1121.91. I’m waiting for micro 2 to complete before shorting. This will be a drop to 1090-1091 (end of subminuette 3), small correction (subminuette 4), then a drop to 1063 (end of minuette 3). This will then be followed by four 4-5s to the target of 957. Excellent setup!
If the bull is in play, then micro 3 of subminuette 3 completed at 1116.82. This will be followed by three 4-5s to reach 1096 / 1105-1091. (Currently the first “4” is underway). After the 4-5s are done, it will be up, up and away. A poor setup. Let’s root for the bear!
looks like c has started and should end between 1126-1123 (approx.)
Fully agreed, Shahab.
This abc 3-wave movement is the same for both bull and bear.
Alan – has micro 2 complete? And ready to position in DUST????
I would say price is still in submicro c of micro 2. Miniscule 3 may still be not over yet. I might be tempted to get into DUST near the close. The final stop of micro 2 is at worst 1126.
Hi Tham, So did you get into DUST for the long weekend? I don’t know if I’m gun shy or what, but I can’t seem to see an obvious entry point.
Me neither. I am still unsure what will transpire over one and a half days before US market opens. If it is the bull, then it could spell trouble. I’d rather give it a miss rather than worry over it.
Monday US market is closed for Labor Day. IMHO a drop down to 1116-1115-1101 range is a reasonable expectation with upside seen as limiting 1127-31…. Just got to wait and see how this plays out… Don’t mind leaving my Sells open over the weekend for a quick switch should upside of 1135-40 be expected….. Lets see how this closes today.
I believe the retrace expected today up to 1028 or 1032 or 1038 may have been completed today when gold moved up to 1132.66 at 8:30
Gold then dropped to 1116.82 at 9:10
Not sure if we would get a .618 retrace of that this morning?
1132.66 – 1116.82= 15.84 x .618= 9.79
1116.82 + 9.79 = 1126.61 possible retrace target?
Any comments?
Next drop will be a big one a third of a third! I am holding dust and will add more on this small move up. Will it start today?
Gold Falls Back Under 50-Day Moving Average, All Eyes on Jobs Data – Gary Wagner
Sep 04, 2015
http://www.kitco.com/news/video/show/Chart-This/1058/2015-09-04/Gold-Falls-Back-Under-50-Day-Moving-Average-All-Eyes-on-Jobs-Data—Gary-Wagner
Real time US oil price can be tracked on this site
http://www.pmbull.com/oil-price/
US Oil daily chart. Appears oil has completed back test (Throwback) of break out.
Great overview, thank you very much !
Is it normal for a backtest to have such high volume?
I beg to differ. After the current drop, there will be one more rise before the big drop. The rise will make a new high above 49.33; I think it may end at 52.63 , the 0.618 retrace.
Just A View: Gold price having an inside week so far…. Expect upside to remain curtailed within or under 1135-40 for a pullback to target a break below 1116-15….
Friday 8:30 am US Non-Farm Payroll report
Friday 8:30 am US Non-Farm Payroll report
FRIDAY, SEPT. 4
8:30 am Nonfarm payrolls Aug. 213,000 215,000
8:30 am Unemployment rate Aug. 5.2% 5.3%
8:30 am Average hourly earnings Aug. 0.2% 0.2%
What to watch in the critical August jobs report
http://www.marketwatch.com/story/what-to-watch-in-the-critical-august-jobs-report-2015-09-03
Fast News Website for when news comes out
http://www.marketwatch.com/newsviewer
EW Gold forecast today with a lower target of 1,096 – 1,079
Versus Lara’s 1,096 – 1,063
https://www.dropbox.com/s/nsd80snjf7mnue0/gold-h1-fxpro-financial-services-2.png?dl=0
The bull market is over: Louise Yamada
Amanda Diaz | @CNBCDiaz
Tuesday, 1 Sep 2015 | 2:22 PM ET
http://www.cnbc.com/2015/09/01/the-bull-market-is-over-louise-yamada.html
There is solid technical analysis which expects the stock market, not just in the USA but in China, Hong Kong and Germany at least, is now in a bear market.
And all I see in the mainstream news here in New Zealand is a complete refusal to report on it or entertain even a possibility that a bear market could begin. Let alone that it’s already begun.
And that is pretty typical of the end of a bull market I think. When mainstream pundits insist prices will keep going up and up, even in the face of falling prices, which they insist is just a correction, then that’s when it’s ready to fall.
I don’t think it’s going to be pretty. Plenty of people are going to lose a lot of money. Margin calls, bankruptcies, company failures, fraud coming to light on a massive scale….
I wouldn’t want to be an over leveraged property owner in New Zealand. I think we’ve seen the end of a classic bubble there and it’s going to burst.
Lara, I agree. Way too much leveraged/hedged/margin investing and inflated bubbles around the world.
Conserving capital and trading very carefully is in order. Diversify out of sky high markets. Keep a good portion of wealth secure from crashes.
Cash not at risk from big currency downturns may be useful to buy at future point in time at discounted prices when Cash is King. Emergency fund may be wise including a little gold. Educate oneself on your portfolio details and risk exposure and study rock solid investments and low risk investments with growth potential in a downturn. Even Canada is in a big real estate bubble been going up strong 7 years. Luxury assets and secondary properties may take a hit first. Some levels of government paper investments are not secure. Ignorance is not bliss.
Lara, can I ask, if you have an opinion (EW or otherwise) about whether the FTSE 100 is now in a bear market. Obviously, its usually fairly highly correlated with the US markets.
From a goldtent forum gold in perspective.
http://goldtadise.com/?p=350694
Thank you very much for this Lara.
Just a question to whoever can help. Any idea when the correction in
Oil is over? I strudel to place a resistance line,… grateful for any thoughts.
I have a short position started at around $15.50 on USO ETF. My stop is just above today’s high.
I’m watching US Oil closely every day. I don’t think it’s over yet.
When I do I’ll let you know.
Thanks Lara. I am also sitting on the fence to short Oil this time around.
When it (wave 2) is over let us know.
Before market open – Crazy guy in agreement with EW count expectation- Gold going down????? LOL
OMNI video:
https://www.youtube.com/watch?list=UUez8uA1o_fDYsrSf4auWSjg&v=HiDvJLTeNO0
I am flat, and have been for a while, maybe a week or more. Waiting for that subminuette ii, maybe we get it before the 8:30am reports tomorrow morning. if so, i will likely be setting up a short gold position at that time. If we are still meandering around current levels at 8:30am tomorrow morning, I will probably wait and see what the reaction is.
Have a great night,
M
Hi Lara an exciting week!
If you find time, could we have a tutorial in Diagonals this weekend, especially the *Elusive* Expanding Diagonal and why its so rare, but the trader psychology that generates any diagonal is what I’m trying to study at the moment. There are some wave counts out there that have gold in one huge diagonal since the London Gold Pool was shut down by the queen
Thanks
Diagonals have some corrective characteristics in that their sub waves are a series of threes, and the fourth wave overlaps first wave price territory.
An ending diagonal indicates that the psychology of the correction which is just around the corner is already affecting the end of the impulse. And this is why ending diagonals are often followed by very deep corrections.
Leading diagonals seem to be less common. The idea there is they contain a hangover from the prior correction, the market just can’t shake off the corrective mood. And that’s why leading diagonals in first wave positions are usually followed by deep second wave corrections.
Diagonals in A or C waves positions are a bit different in psychological terms I think because these are waves within a correction one degree higher. And this may be why they’re more common than diagonals in wave 1 or 5 of an impulse (particularly leading diagonals in A wave positions rather than 1st wave positions).
As far as the psychology of contracting vs expanding… I’m not sure. Maybe the contracting variety represents an expression of winding up, coming to a conclusion. Where the expanding variety is much looser. Apart from that I just don’t know. The expanding variety is less common that’s for sure.
Thank you Lara, that is very helpful.