
A slight new low and a small red candlestick fit both Elliott wave counts.
Regular technical analysis also expected more downwards movement for Friday.
Summary: Downwards movement should continue to 1,096 for the bull wave count or 1,063 for the bear wave count. On the way down, a new low below 1,072.09 would fully invalidate the bull wave count and provide confidence in the bear. I have two scenarios at the hourly chart level. The first scenario expects a second wave correction ended on Friday and a third wave down is underway. This will remain valid while price remains below the upper edge of a small green channel on the hourly bull wave count and below 1,133.44. The second scenario looks at the possibility a five down ended at Friday’s low and a second wave correction may unfold upwards on Monday / Tuesday to find resistance at the next upper edge of a wider channel drawn the same way on both charts. That idea would be confirmed with a new high above 1,133.44. On balance, I slightly favour the second idea, so we may see a green candlestick for Monday’s session.
Changes to last analysis are bold.
To see weekly charts and the three different options for cycle wave b (bull wave count) click here.
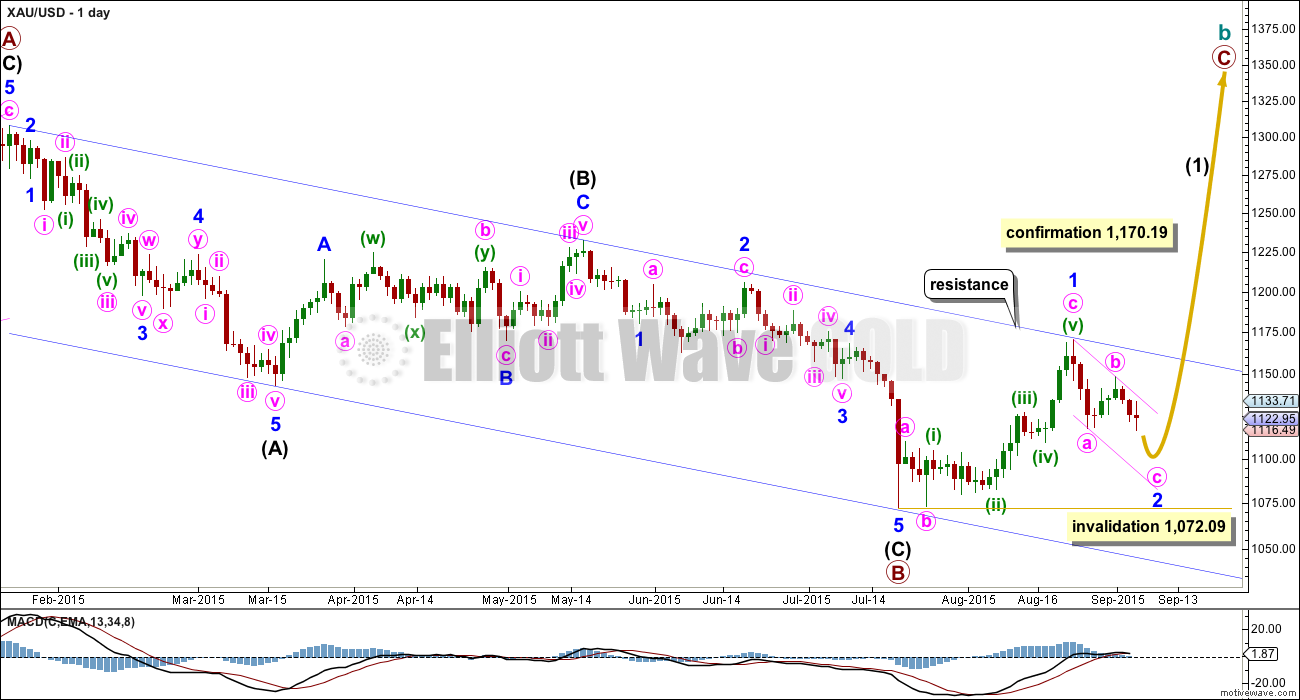
BULL WAVE COUNT – DAILY
Click chart to enlarge.
The bigger picture at super cycle degree is still bearish. A large zigzag is unfolding downwards. Along the way down, within the zigzag, cycle wave b must unfold as a corrective structure.
At this stage, there are three possible structures for cycle wave b: an expanded flat, a running triangle, or a combination.
This daily chart works for all three ideas at the weekly chart level.
For all three ideas, a five up should unfold at the daily chart level. This is so far incomplete. With the first wave up being a complete zigzag the only structure left now for intermediate wave (1) would be a leading diagonal. While leading diagonals are not rare they are not very common either. This reduces the probability of this bull wave count now to about even with the bear wave count.
A leading diagonal requires the second and fourth waves to subdivide as zigzags. The first, third and fifth waves are most commonly zigzags, the but sometimes may appear to be impulses. So far minor wave 1 fits well as a zigzag.
Minor wave 2 may not move beyond the start of minor wave 1 below 1,072.09. If this invalidation point is breached, then it would be very difficult to see how primary wave B could continue yet lower. It would still be technically possible that primary wave B could be continuing as a double zigzag, but it is already 1.88 times the length of primary wave A (longer than the maximum common length of 1.38 times), so if it were to continue to be even deeper, then that idea has a very low probability. If 1,072.09 is breached, then I may cease to publish any bullish wave count because it would be fairly clear that Gold would be in a bear market for cycle wave a to complete.
To the upside, a new high above 1,170.19 would invalidate the bear wave count below and provide strong confirmation for this bull wave count.
Upwards movement is finding resistance at the upper edge of the blue channel and may continue to do so. Use that trend line for resistance, and if it is breached, then expect a throwback to find support there.
In the short term, use the smaller pink channel drawn about the zigzag of minor wave 2 using Elliott’s technique for a correction as shown. Copy this channel over to the hourly chart. This channel is also drawn in the same way for the bear wave count, and there it is correctly termed a base channel. Both wave counts should expect upwards corrections for the short term to find resistance at the upper edge of this smaller channel.
Click chart to enlarge.
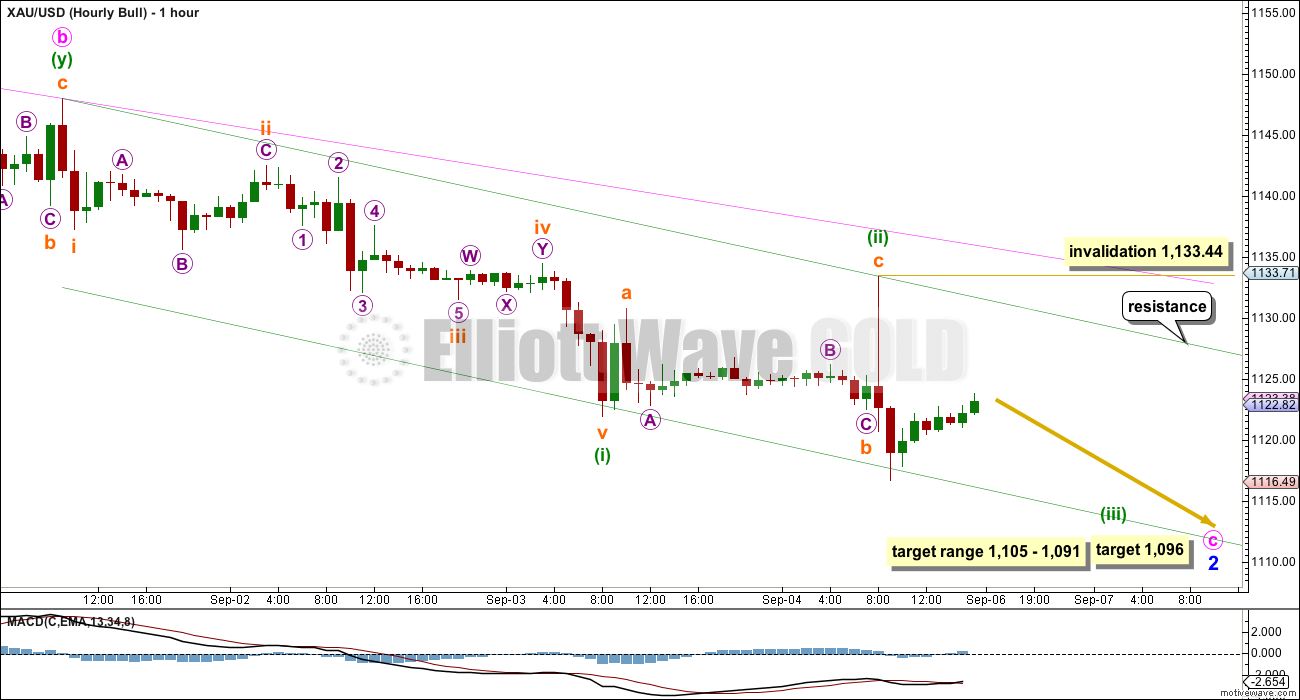
Again, there is more than one way to see this downwards movement from the end of minute wave b. The two hourly charts will look at this wave down in two different ways, and both will work exactly the same for bull and bear wave counts.
A five down and a following three up for a first and second wave may already be over. This means Gold may be ready to move into the middle of a third wave down.
Ratios within minuette wave (i) are: subminuette wave iii is 0.16 longer than equality in length with subminuette wave i, and subminuette wave v has no Fibonacci ratio to either of submineutte waves i or iii. Subminuette wave ii was a 0.49 expanded flat and subminuette wave iv a 0.26 double combination. There is some alternation in depth and a little in structure, but the alternation particularly in structure is inadequate (flats and combinations are very similar in structure and have the same purpose).
Ratios within subminuette wave iii are: there is no Fibonacci ratio between micro waves 1 and 3, and micro wave 5 is 0.18 short of 0.618 the length of micro wave 3. Micro wave 2 is a deep 0.79 expanded flat and micro wave 4 is a less deep 0.58 zigzag. There is a little alternation in depth and good alternation in structure.
Minuette wave (ii) would be most likely over in this scenario as a zigzag.
The target for minute wave c to end remains the same at 1,096 where it would reach equality in length with minute wave a. This would see minor wave 2 reach down to within the normal depth for a second wave correction within a diagonal, between 0.66 to 0.81 of minor wave 1, which is between 1,105 to 1,091.
Draw a smaller base channel about minuette waves (i) and (ii). Draw the first trend line from the start of minuette wave (i) to the end of minuette wave (ii), then place a parallel copy on the end of minuette wave (i). Along the way down, for this scenario, corrections should find resistance at the upper edge of this smaller green channel. If the upper edge is breached on Monday, then that would be the earliest indication that this first scenario may be wrong and the second scenario may be correct.
No second wave correction may move beyond its start above 1,133.44 within minuette wave (iii). If this first scenario is invalidated on Monday, then the second scenario will be expected.
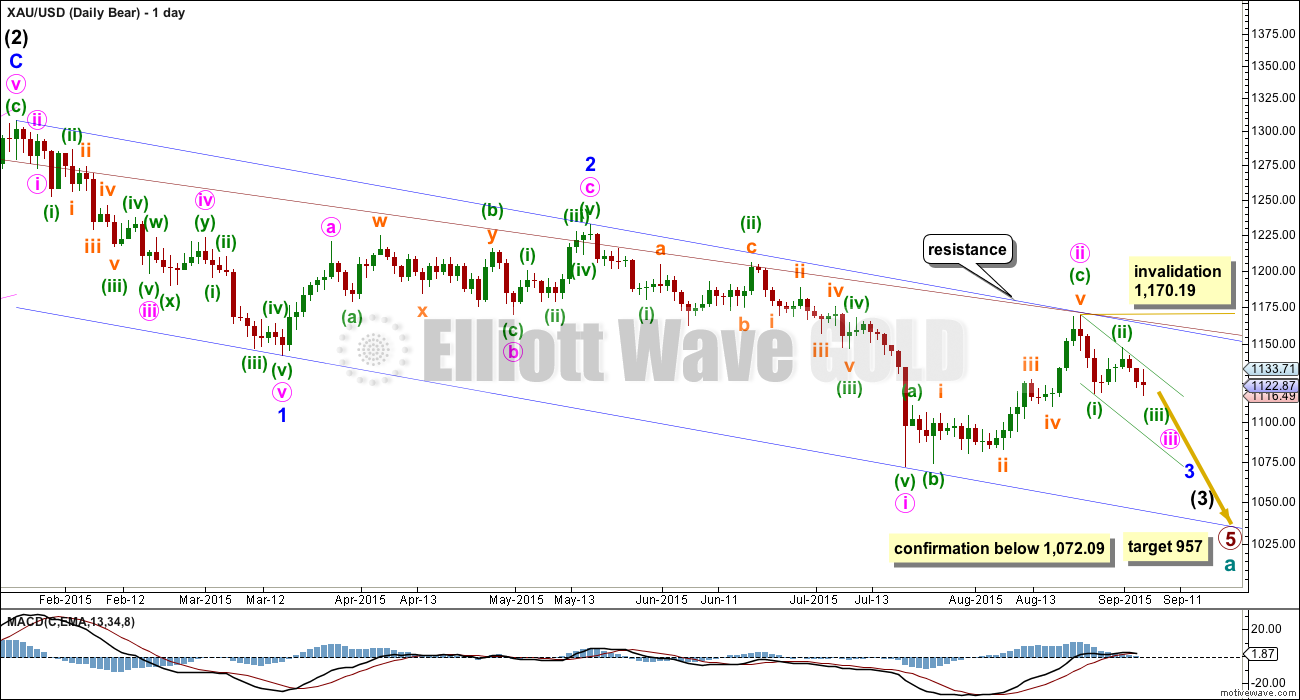
BEAR ELLIOTT WAVE COUNT
Click chart to enlarge.
At this stage, the reduction of probability for the bull wave count sees this bear wave count about even now in probability.
This wave count now sees a series of four overlapping first and second waves: intermediate waves (1) and (2), minor waves 1 and 2, minute waves i and ii, and now minuette waves (i) and (ii). Minute wave iii should show a strong increase in downwards momentum beyond that seen for minute wave i. If price moves higher, then it should find very strong resistance at the blue trend line. If that line is breached, then a bear wave count should be discarded.
The blue channel is drawn in the same way on both wave counts. The upper edge will be critical. Here the blue channel is a base channel drawn about minor waves 1 and 2. A lower degree second wave correction for minute wave ii should not breach a base channel drawn about a first and second wave one or more degrees higher. If this blue line is breached by one full daily candlestick above it and not touching it, then this wave count will substantially reduce in probability.
Minuette wave (ii), if it were to continue, may not move beyond the start of minuette wave (i) above 1,170.19. A breach of that price point should see this wave count discarded as it would also now necessitate a clear breach of the blue channel and the maroon channel from the weekly chart.
Full and final confirmation of this wave count would come with a new low below 1,072.09.
If primary wave 5 reaches equality with primary wave 1, then it would end at 957. With three big overlapping first and second waves, now this target may not be low enough.
Click chart to enlarge.
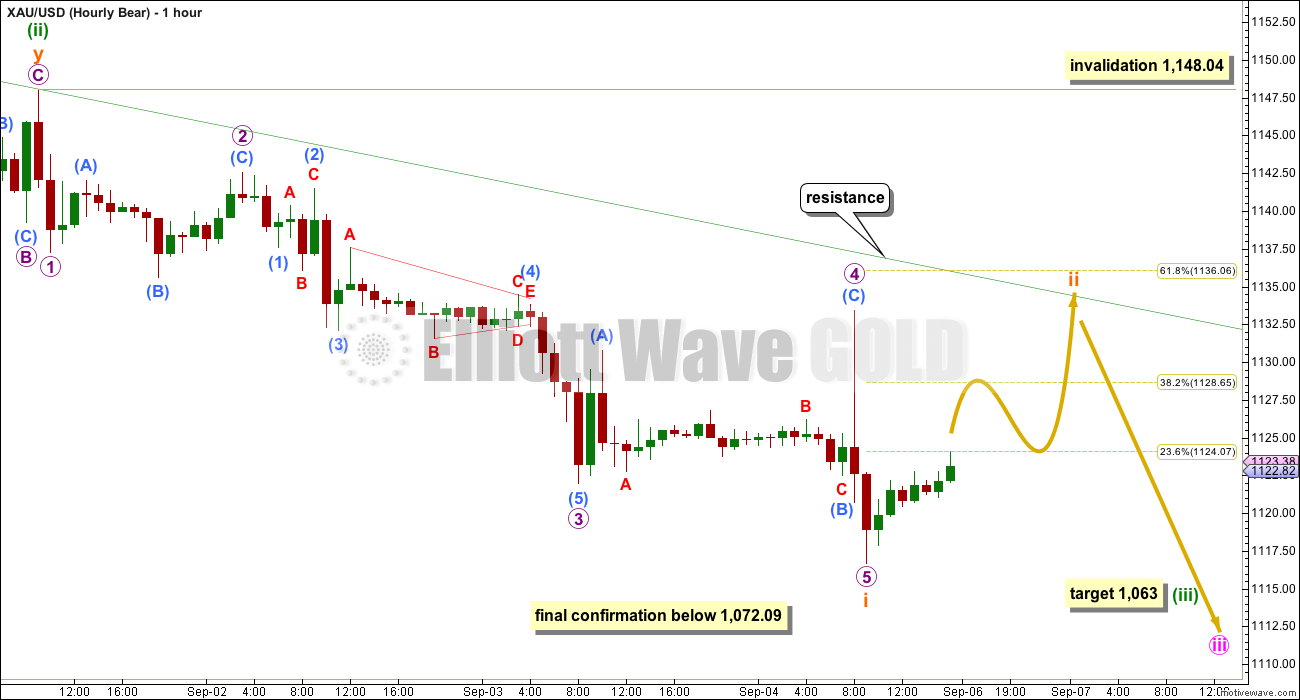
This wave count expects an impulse to be beginning downwards. An impulse subdivides 5-3-5-3-5. So far the first 5 down is complete.
The beginning of an impulse and the whole of a zigzag have exactly the same subdivisions.
On this hourly chart, again, I am looking at another way to see this recent downwards movement which may have just completed a five wave impulse at Friday’s low.
Ratios within subminuette wave i are: there is no Fibonacci ratio between micro waves 1 and 3, and micro wave 5 is 0.72 short of 1.618 the length of micro wave 1. Micro wave 1 is a 0.49 expanded flat and micro wave 4 is a deeper 0.56 zigzag. There is a slight but inadequate alternation in depth, but very good alternation in structure.
There is no Fibonacci ratio between submicro waves (1), (3), and (5) within micro wave 3. But there is perfect alternation in structure and depth between the deep 0.79 expanded flat of submicro wave (2) and the shallow 0.18 triangle of submicro wave (4).
While the Fibonacci ratios for this idea are not quite as good as for the first idea, the alternation is better. On balance I think this second idea may be a little more likely.
Subminuette wave ii may end at either the 0.382 or 0.618 Fibonacci ratio of subminuette wave i. Or it may not end at a Fibonacci ratio. Subminuette wave ii is likely to end if price reaches up to find resistance at the upper edge of the base channel drawn about minuette waves (i) and (ii), which is copied over from the daily chart. A lower degree second wave should not breach a base channel drawn about a first and second wave one or more degrees higher.
Subminuette wave ii may not move beyond the start of suminuette wave i above 1,148.04.
The target for minuette wave (iii) remains the same. At 1,063 it would reach 1.618 the length of minuette wave (i).
TECHNICAL ANALYSIS
Click chart to enlarge. Chart courtesy of StockCharts.com.
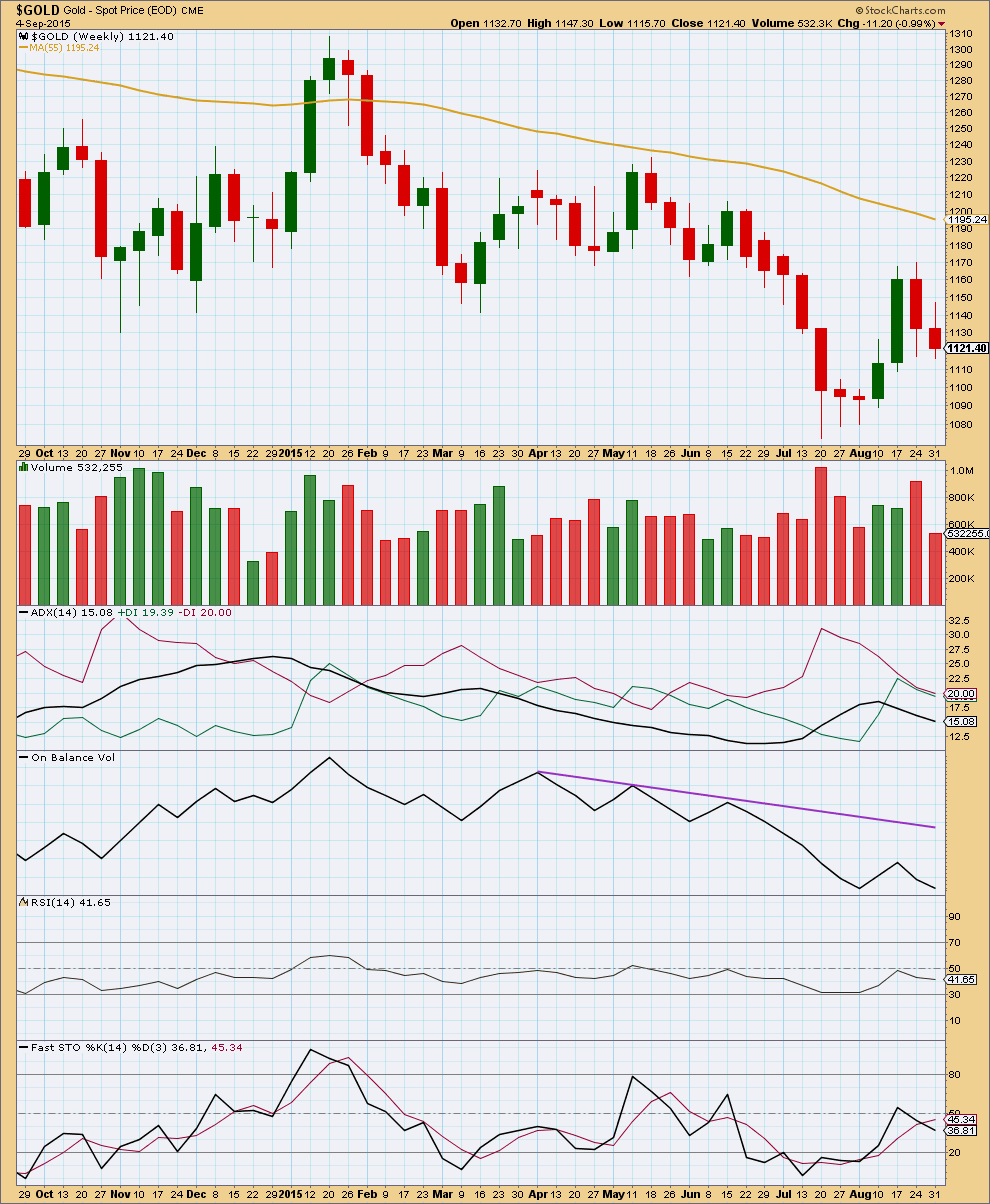
With the daily chart giving conflicting information, maybe a step back to look at the weekly chart can provide a little guidance.
For recent movement, it is clear that the strongest week was a down week as price reached the last swing high at 1,169. This indicates price may break out downwards and that upwards movement was a correction against a prevailing downwards trend which favours the bear wave count.
ADX at the weekly chart level currently indicates no clear trend, so the market is consolidating. ADX is a lagging indicator, and this lack of trend indication may be due to upwards movement being a correction against a downwards trend.
On Balance Volume remains below a trend line which goes back to April, and is now substantially below it. This too is bearish.
Overall the weekly picture is more bearish than bullish.
Volume for this week just ended much lower than the prior downwards week. This week the fall in price was not supported by volume at the weekly chart level. Price did manage to make a new low, but only very slightly at the end of Friday. Some of this week was corrective which may explain lower volume.
Looking back at the last two big falls in price on this weekly chart, the first fall shown here from 20th January to 16th March began with three consecutive weeks of falling price on declining volume which is a perfect illustration of how the market can “fall of its own weight”. This is because a fall in price does not need an increase in sellers, whereas a decrease in buyers will do it. That fall in price was only supported by a rise in volume for the last four weeks to the low.
Looking at the next big fall in price from 18th May to 20th July, the first two weeks had a light and slight decline in volume. It was not until the third week that volume increased, culminating in a volume spike for the final low.
The fall in volume for this week is only a very slight concern. The fact that last week saw a strong increase in volume as price fell is more significant at this stage.
On a monthly chart and this weekly chart, it is clear that Gold has overall been in a bear market since September 2011. Price continues to move lower and continues to remain below the 200 day simple moving average and below trend lines drawn about highs along the way down. There has been no reasonable confirmation yet that this bear market is over. Any bets on an expectation that Gold is now in a bull market are gambles and not well supported by thorough technical analysis. My approach will be to use the blue trend line on the daily Elliott wave charts and the price point of 1,170.19 to confirm a potential change to a bull market.
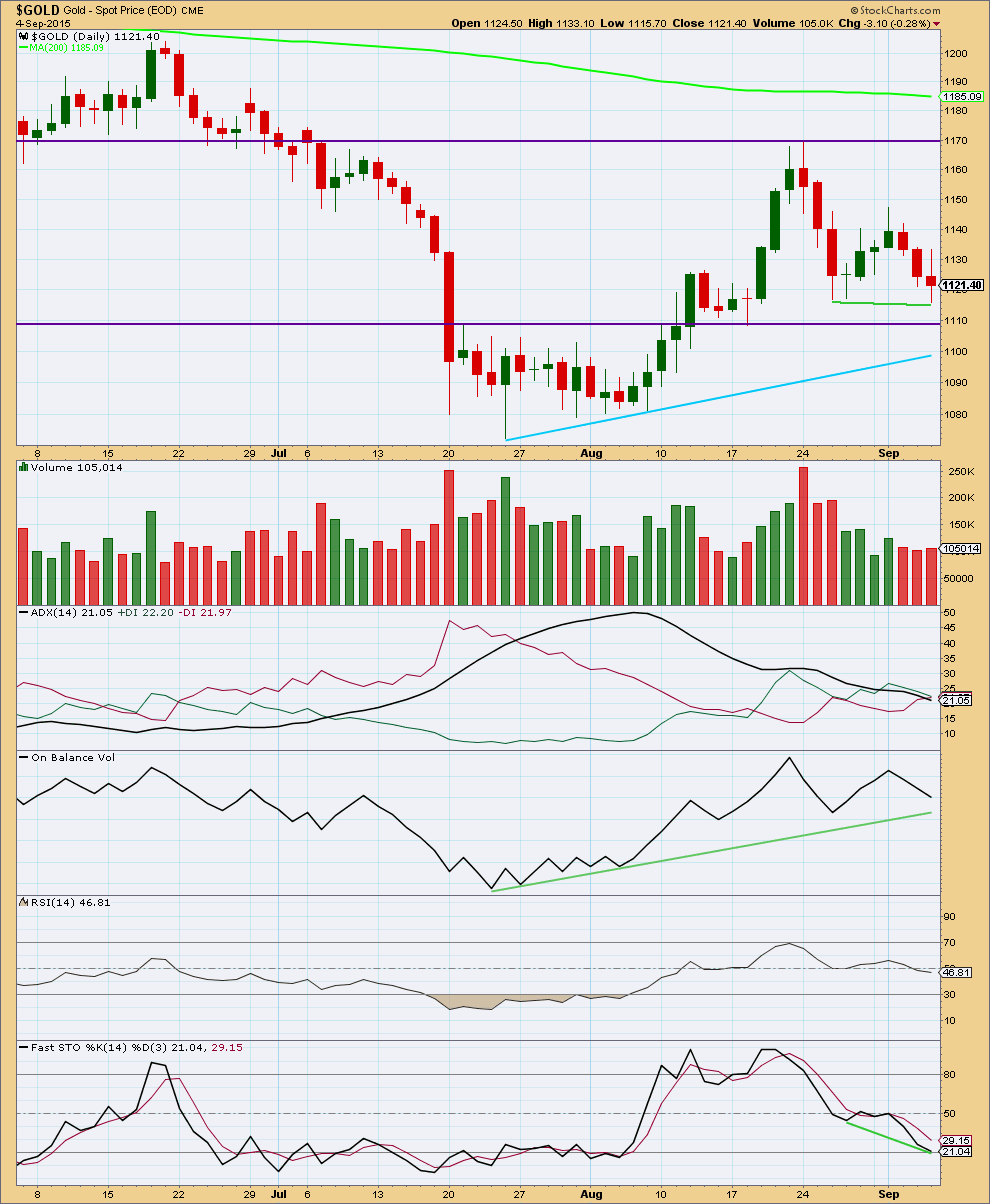
Click chart to enlarge. Chart courtesy of StockCharts.com.
Friday’s red candlestick shows a slight increase in volume. Along with a slight new low, this slightly supports the fall in price. The candlestick has a small real body with a slightly longer upper than lower wick, so overall it is more bearish than bullish.
Overall, from the last high now ten days ago, volume is falling which is more bullish than bearish. The small rise in the middle came on declining volume within this fall in price.
The one thing that is clear from volume is the strongest day most recently was the strong downwards day of 24th August. This may be an indication that Gold should move lower.
ADX continues to indicate the market is not yet in a clear trend while the black ADX line points down.
A shorter held trend line on On Balance Volume has not yet been reached at the daily chart level. When On Balance Volume reaches that line then it may find some support. If it breaks through, then that would be strong bearish indication. OBV is pointing lower today which does provide some support to the fall in price. There is no divergence. OBV agrees with the price direction.
Stochastics no longer shows any bullish divergence; that weak signal has evaporated as weak signals sometimes do. Stochastics has not yet reached oversold territory, so a further fall in price may be expected to be seen at least in the short term until Stochastics reaches oversold territory.
The picture at the daily chart level is mixed and unclear, but very slightly favours the bear wave count over the bull.
This analysis is published about 07:22 p.m. EST.
Direxion Announces Date Extension to October 1st for Reverse Share Splits of Six Leveraged ETFs – September 2, 2015 6:53 PM
http://finance.yahoo.com/news/direxion-announces-date-extension-october-225300302.html
Direxion Investments has announced it will extend the date for executing reverse share splits for six of its leveraged exchange-traded funds (“ETFs”) to October 1, 2015.
Lara: Gold traded below submin wave i at 1115.70.
Would this invalidate the current bear hour wave count? Submin wave ii can’t trade in wave i territory?????
Am I correct?
No. I think we have a flat correction unfolding.
I expect now to see a five wave structure up to 1,128 – 1,129 to complete a second wave flat correction.
And then a third wave would be ready to begin.
The other idea which sees a third wave down already underway still looks less likely. When I can see volume data for today from Stockcharts I’ll have a clearer idea. If volume for today is lower that would support price being in a correction. If volume is higher it would support the early stage of a third wave down.
Excellent.
Weekend Fun with Crazy Oscar. Talks about of gold on Thursday.
Plus he talks about liquidity trap becax of Dodd- Frank legislation.
https://www.youtube.com/watch?list=UUez8uA1o_fDYsrSf4auWSjg&t=232&v=FbMoaG40_40
Have fun!!!!!
IMHO: Whilst upside presently remains restricted to 1128-32, Gold price likely to drop from lower (1123-25)…. With the lower band rising (1103-1099), I wouldn’t go chasing the downside below 1115-10-06 just yet (safety play?). Momentum and ROC are slowing, indicative of an upturn / rally….
Lara excellent report.
What is the target for intermediate (3)? Is it same as 1063?
In next day or so gold will be in 3rd of 3rd of 3rd of 3rd wave. last one being the intermediate (3).
Yes need to confirm price below 1072.
Thanks.
Intermediate (3) has passed equality with (1), and is close to 1.618 X (1) which is at 1,046. The next target would be at 2.618 X (1) at 884, which is below the target for primary 5.
So I’m not providing a target for intermediate (3) because it may not exhibit a Fibonacci ratio to (1). If it does it will be 884. When minor 4 is complete then I can use minor degree to calculate the target for intermediate (3).
Thanks for the great analysis Lara. I started a gold short position today, with Monday as a U.S. Holiday. I’ll be looking for that wave ii on Tuesday.
By the way, started my EW Stockmarket trial yesterday, paid for a few years of subscription already!
Have a great weekend all!
M
Brilliant!