
The Elliott wave structure looks incomplete.
Summary: US Oil remains in a correction. I expect some more upwards movement before it is done.
Changes and additions to last analysis are bold.
MONTHLY ELLIOTT WAVE COUNT

Click chart to enlarge.
This wave count sees US Oil as within a big super cycle wave (II) zigzag. Cycle wave c is highly likely to move at least slightly below the end of cycle wave a at 32.70 to avoid a truncation. Cycle wave c may end when price touches the lower edge of the big teal channel about this zigzag.
Within cycle wave c, primary wave 5 is expected to be extended which is common for commodities.
Within primary wave 5, no second wave correction may move beyond its start above 62.58.
Draw a channel about this unfolding impulse downwards. Draw the first trend line from the highs labelled primary waves 2 and 4 then place a parallel copy on the end of primary wave 3. Next push up the upper trend line slightly to contain all of primary waves 3 and 4. Copy this channel over to the daily chart. The upper edge should provide resistance.
DAILY ELLIOTT WAVE COUNT
Click chart to enlarge.
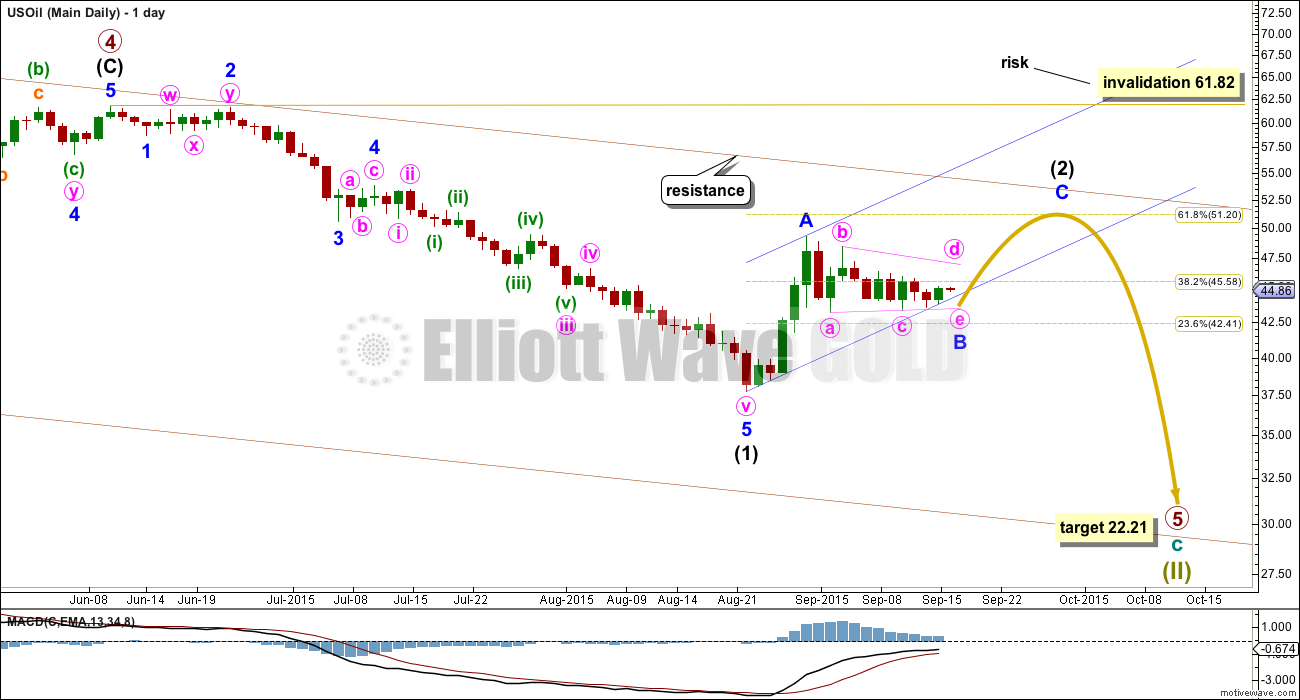
The intermediate degree corrections were brief and shallow within primary wave 3 down. Now, within primary wave 5, this correction for intermediate wave (2) is neither brief nor shallow.
Intermediate wave (2) may end when price reaches up to about the 0.618 Fibonacci ratio of intermediate wave (1) at 51.20.
Sideways movement of the last 11 days looks like a B wave within intermediate wave (2). This may be a regular contracting or barrier triangle forming for minor wave B. It may also morph into a combination for minor wave B. Either way, the structure of minor wave B is incomplete.
When minor wave B is complete, then minor wave C upwards should unfold and is very likely to end at least slightly above the end of minor wave A at 49.32 to avoid a truncation. The breakout of this sideways movement is most likely to be upwards, but it may be a brief false breakout before the downwards trend resumes.
When the end of minor wave B is known, then a target may be calculated for minor wave C. This cannot be done yet.
Intermediate wave (2) is likely to find resistance at the upper edge of the maroon channel copied over from the monthly chart.
At 22.21 primary wave 5 would reach 0.618 the length of primary wave 3.
Intermediate wave (2) may not move beyond the start of intermediate wave (1) above 61.82.
I have drawn a premature corrective channel about the zigzag of intermediate wave (2). Redraw the channel as minor wave B continues sideways. Minor wave C may end midway or at the upper edge of this channel. When the channel is breached by subsequent downwards movement, then it shall provide confirmation that the downwards trend has resumed.
If this analysis is wrong and the breakout of the recent sideways movement is downwards and not upwards, then it may be that intermediate wave (2) was over at the high labelled minor wave A and sideways movement was a series of overlapping first and second waves to start intermediate wave (3) down.
TECHNICAL ANALYSIS
Click chart to enlarge. Chart courtesy of StockCharts.com.
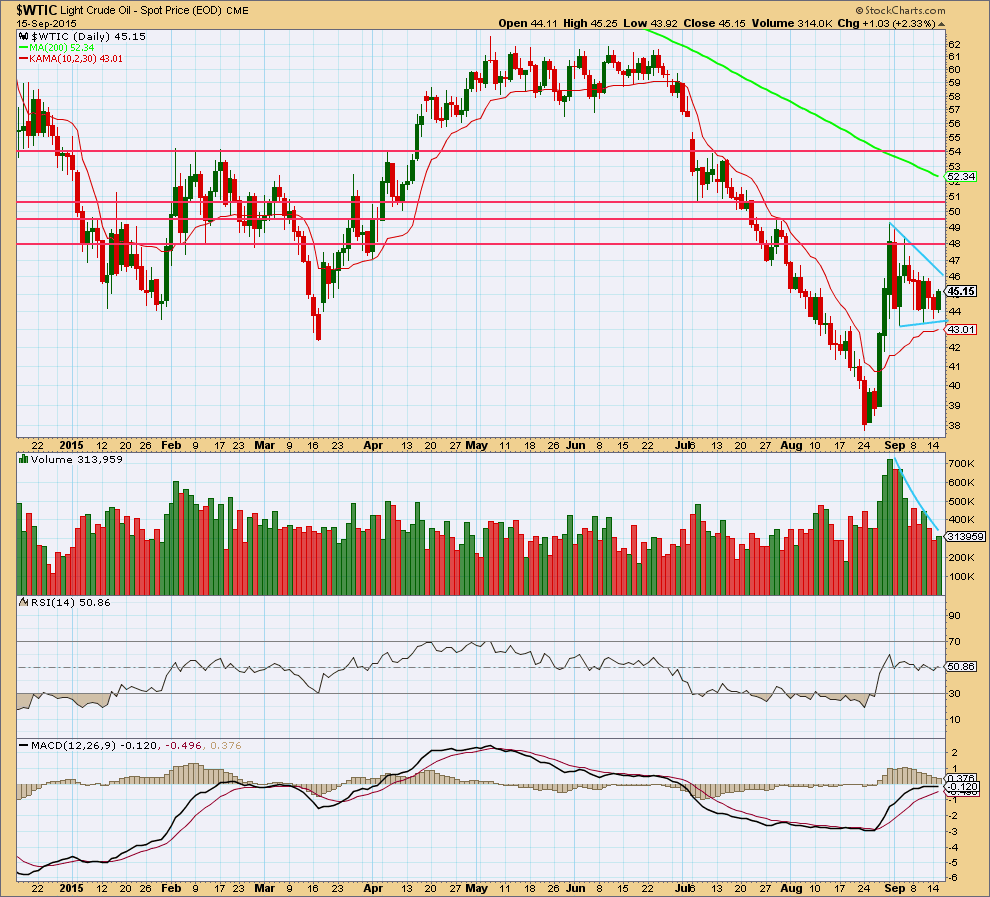
For the last 10 days, as price drifts sideways volume declines. This structure looks like a triangle. The upper slope is steeper than the downwards slope, which may indicate a downwards breakout that is in conflict with the Elliott Wave count.
Price is finding resistance about the horizontal trend line which previously provided some support. If price breaks above the first horizontal line of resistance, then it may find resistance at each subsequent line.
A breakout from this triangle would be indicated by a breach of either of the sloping blue trend lines, up or down, coming on a day with an increase in volume.
ADX is declining indicating the market is consolidating. A range bound system should be used for trading, or traders may choose to wait until a clear trend is evident before entering this market.
This analysis is published about 01:54 a.m. EST.
Lara: In a triangle wave count abcde, does e price point needs to below wave c?
An excellent question.
E needs to end before C. So above 43.38.
On my education page there’s a video explaining triangles; the different types and the rules for each. You may find that helpful to understand them.
Goldman Sees 15 Years of Weak Crude as $20 U.S Oil Looms
September 17, 2015 — 1:20 AM EDT
http://www.bloomberg.com/news/articles/2015-09-17/goldman-sees-15-years-of-weak-crude-as-20-u-s-oil-looms-on-glut
Richard
When US oil was trading at $147 Goldman came out with similar report projecting OIL will go up to $200 soon. That week mark the top of oil.
I would just trade based on Lara’s Elliott wave counts and use these reports as amusement only.
Your Technical indicators, charts, and EW counts are the best for market direction.
Thanks for posting these I like them.
Dear Lara,
Sorry for messing with your chart but do you think this is possible? if the current wave C is equal with wave A then the rule of “wave 4 never enters territory of wave 1” is met too.
Adam
It’s possible, and many things are possible.
I think it would be highly unlikely though because that would see minor waves 2 and 4 grossly disproportionate.
It’s the proportion between the second and fourth waves within an impulse that give it a five wave look. When one of the corrections, either the second or fourth, is much longer in duration than the other then the impulse gets a three wave look to it.
For Oil and Gold (commodities) they often exhibit swift strong fifth waves. And because of this tendency their fourth waves are shallow and brief, pulled by the strong fifth wave. So your idea here for a much longer fourth wave than the second would be highly unusual. It does not have the “right look”.
and no worries on messing with the chart 🙂