
Both Elliott wave counts had a short term target at 1,165 for a little upwards movement for Monday.
Price moved higher, reaching 1,169.15 before turning down for the session.
Summary: The bear wave count must now substantially reduce in probability, so the bull wave count is now more likely. For both I expect some sideways / downwards movement from here. For the bull wave count, the structure should be a fourth wave correction which may not move below 1,153.80, most likely end about 1,157, and last about two to five days. For the bear wave count, a third wave down should begin and a new low below 1,153.80 would provide only a little confidence in this idea. The bear now requires a new low below 1,104.69 for confidence.
New updates to this analysis are in bold.
BULL ELLIOTT WAVE COUNT
Click chart to enlarge.
I will present this bull wave count first because with the bear wave count breaching its trend channel the bull wave count now must increase in probability.
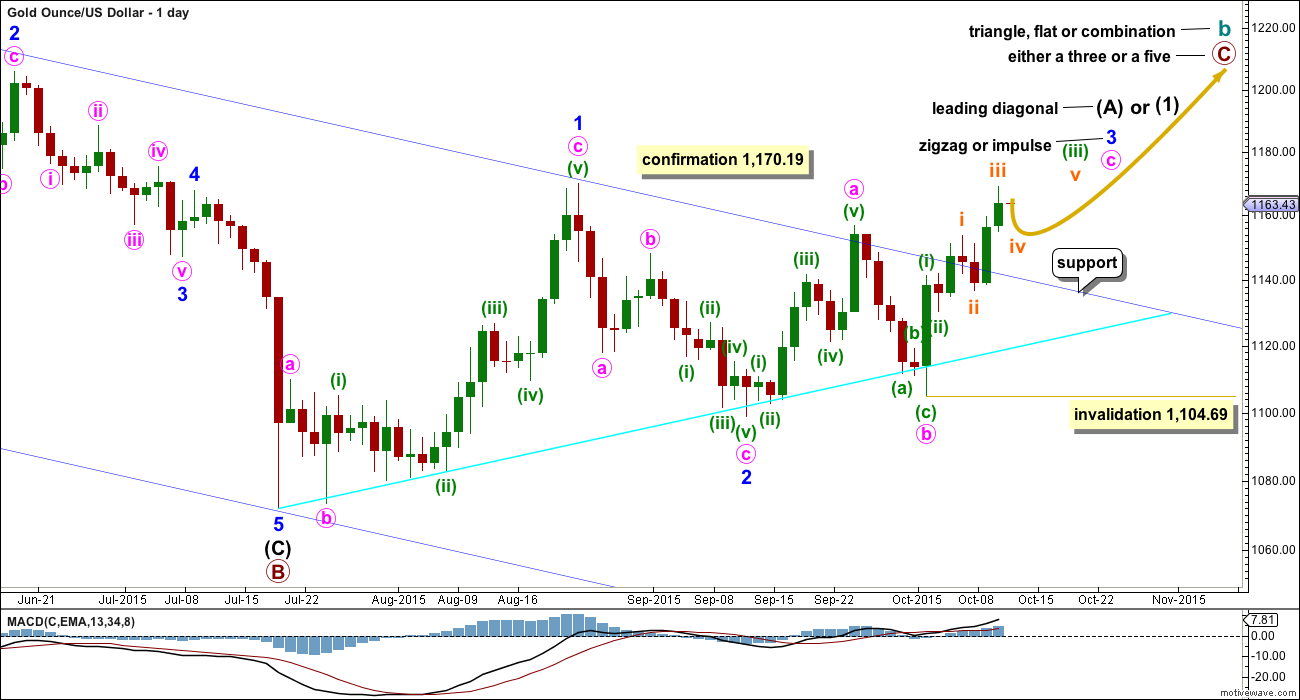
The bull wave count sees cycle wave a complete and cycle wave b underway as either an expanded flat, running triangle or combination. This daily chart works for all three ideas at the weekly chart level. To see the bigger picture on weekly charts click here.
For all three ideas, a five up should unfold at the daily chart level for a movement at primary degree. This is so far incomplete. With the first wave up being a complete zigzag the only structure left now for intermediate wave (1) or (A) would be a leading diagonal. While leading diagonals are not rare they are not very common either. This reduces the probability of this bull wave count.
A leading diagonal requires the second and fourth waves to subdivide as zigzags. The first, third and fifth waves are most commonly zigzags, the but sometimes may appear to be impulses. So far minor wave 1 fits well as a zigzag.
To the upside, a new high above 1,156.83 would invalidate the bear wave count and provide strong confirmation for this bull wave count.
Minor wave 2 can now be seen as a complete zigzag. It is 0.73 the depth of minor wave 1, nicely within the normal range of between 0.66 to 0.81 for a second wave within a diagonal.
Third waves within leading diagonals are most commonly zigzags, but sometimes they may be impulses. Minor wave 3 should show some increase in upwards momentum beyond that seen for minor wave 1. Minor wave 3 must move above the end of minor wave 1 above 1,170.19.
There now looks like a five up on the daily chart within minor wave 3. This may be minute wave a within a zigzag, or it may also be minute wave i within an impulse. It is difficult at this stage to see how minute wave b could continue any lower; it is likely to be over now as labelled. No second wave correction may move beyond the start of its first wave below 1,104.69 within minute wave c.
Click chart to enlarge.
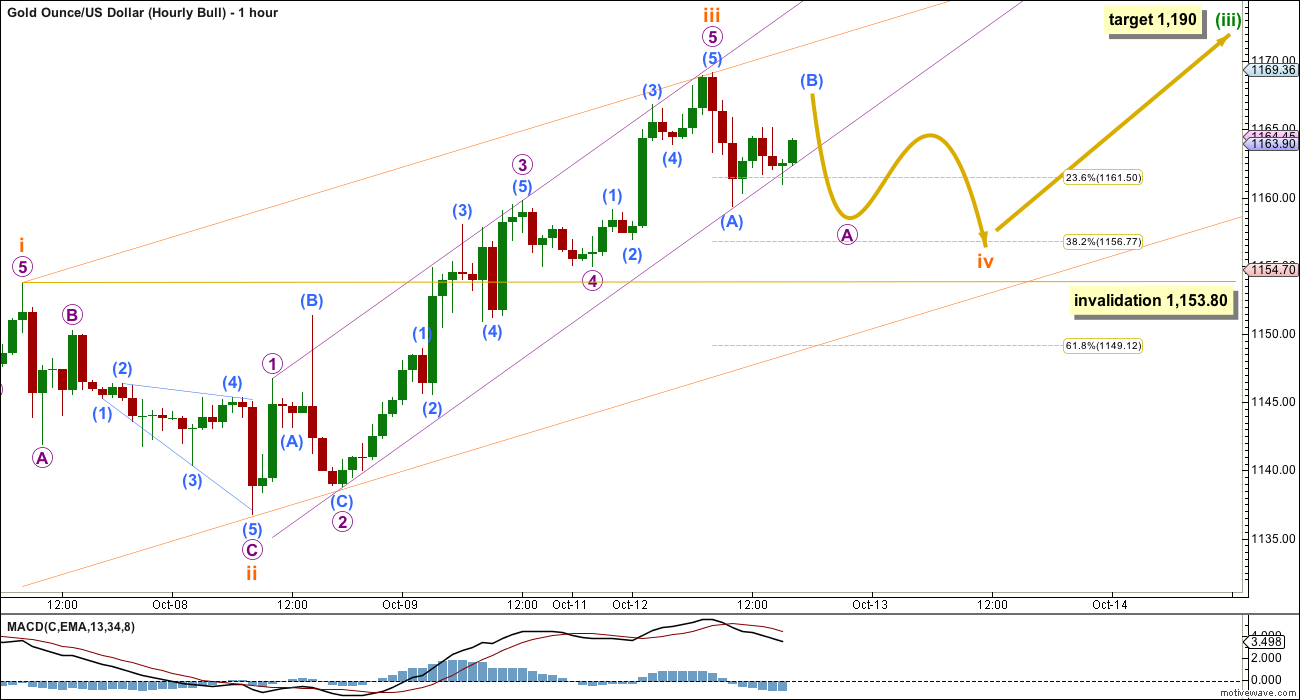
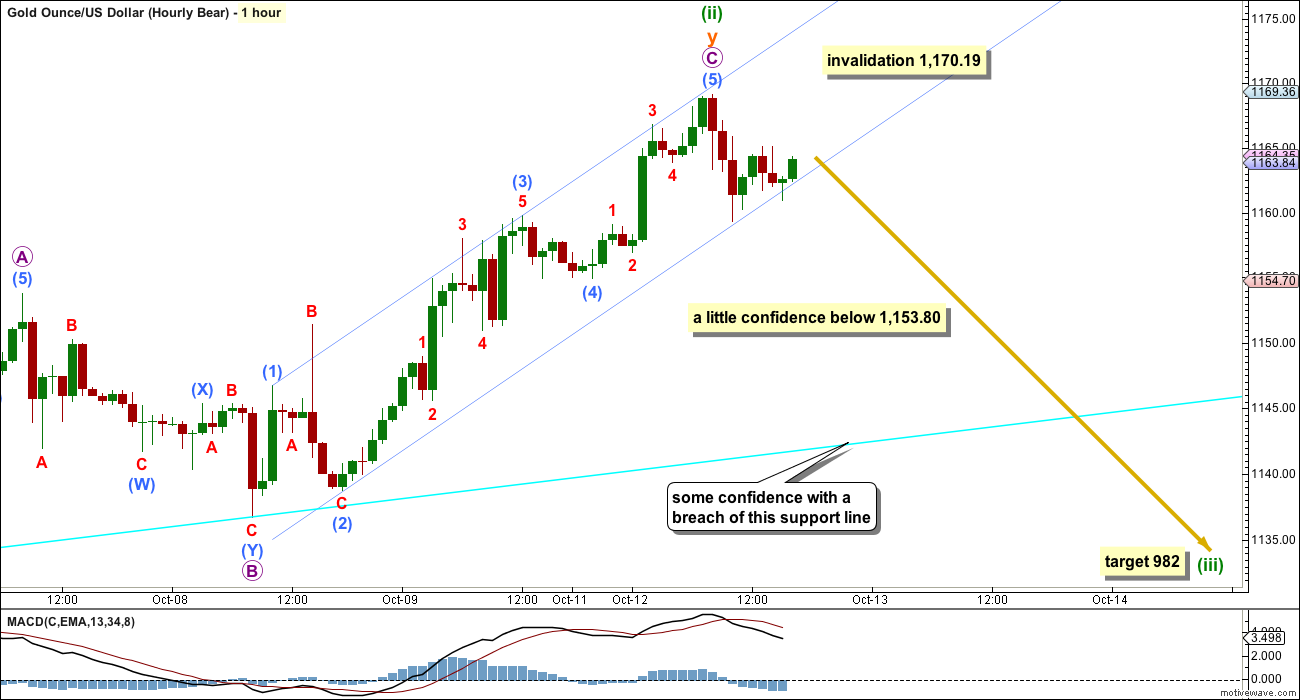
The hourly chart focusses on the middle of minuette wave (iii).
Subminuette wave iii is a complete impulse and shows an increase in upwards momentum beyond that seen for subminuette wave i. There is no Fibonacci ratio between subminuette waves i and iii.
Ratios within subminuette wave iii are: there is no Fibonacci ratio between micro waves 3 and 1, and micro wave 5 is 1.25 longer than 0.618 the length of micro wave 3.
Draw a channel about subminuette wave iii using Elliott’s first technique: draw the first trend line from the highs of micro waves 1 to 3, then place a parallel copy on the low of micro wave 2. So far price is finding support at the lower edge of this channel. It will remain possible that subminuette wave iii is incomplete and its fifth wave may yet move higher while price remains within the channel.
When the small channel about subminuette wave iii is breached by sideways / downwards movement that shall provide indication that subminuette wave iv has begun.
Draw a wider channel about minuette wave (iii) using the same technique (orange lines). Look for subminuette wave iv to find support at the lower edge of that channel, if it gets that far.
Subminuette wave ii was a deep 0.73 zigzag lasting two days (it produced two red daily candlesticks). Given the guideline of alternation subminuette wave iv may be expected to be more shallow and a more time consuming flat, combination or triangle. Subminuette wave iv is likely to end about the 0.382 Fibonacci ratio of submineutte wave iii at 1,157 and may last about two to five days. Subminuette wave iv may not move into subminuette wave i price territory below 1,153.80.
If subminuette wave iv is an expanded flat, running triangle or combination, then it may include a new high above its start at 1,169.15. There is no upper invalidation point for subminuette wave iv for this reason.
BEAR ELLIOTT WAVE COUNT
Click chart to enlarge.
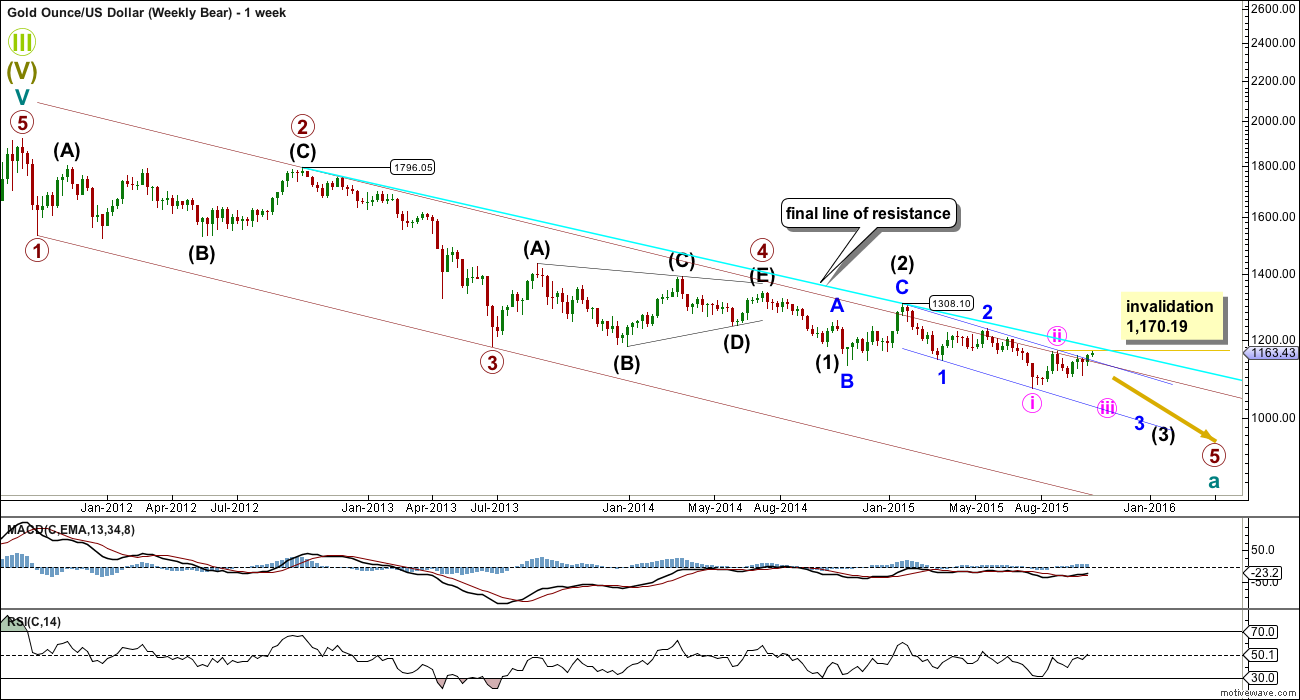
I publish the bear weekly chart today to illustrate the channels which need to be breached, and a final line of resistance which also should really be breached, in order to provide technical confirmation of a big trend change from bear to bull.
The wide maroon channel is drawn about this impulse using Elliott’s first technique: the first trend line is drawn from the ends of primary waves 1 to 3, then a parallel copy is placed in the end of primary wave 2. This channel is now breached two times (so far, the current week is incomplete and may not end in a breach) and overshot once. If this week ends with a breach of this channel, then it may be used to confirm a trend change.
A final line of resistance is added from the highs labelled primary wave 2 at 1,796.05 to intermediate wave (2) at 1,308.10. If that bright aqua blue line is breached, then it would provide full and final technical confirmation of a trend change from bull to bear. I may consider publishing a bear wave count as an addendum (with a low probability) while price remains below that trend line, if the Elliott wave count fits and makes sense.
If price breaks above 1,170.19, then another possibility for the bear would be to see minute wave ii continuing higher. That would see minute wave ii huge in duration though; it would look wrong at the daily chart level.
I have considered an ending diagonal for primary wave 5. It will not fit because the wave up labelled minor wave C of intermediate (2) will not fit as a zigzag (see video of 20th August for an explanation of this problem). I know other Ellioticians have wave counts which see this move as a three, but I do not know how they managed to do that and resolve the problem.
Click chart to enlarge.
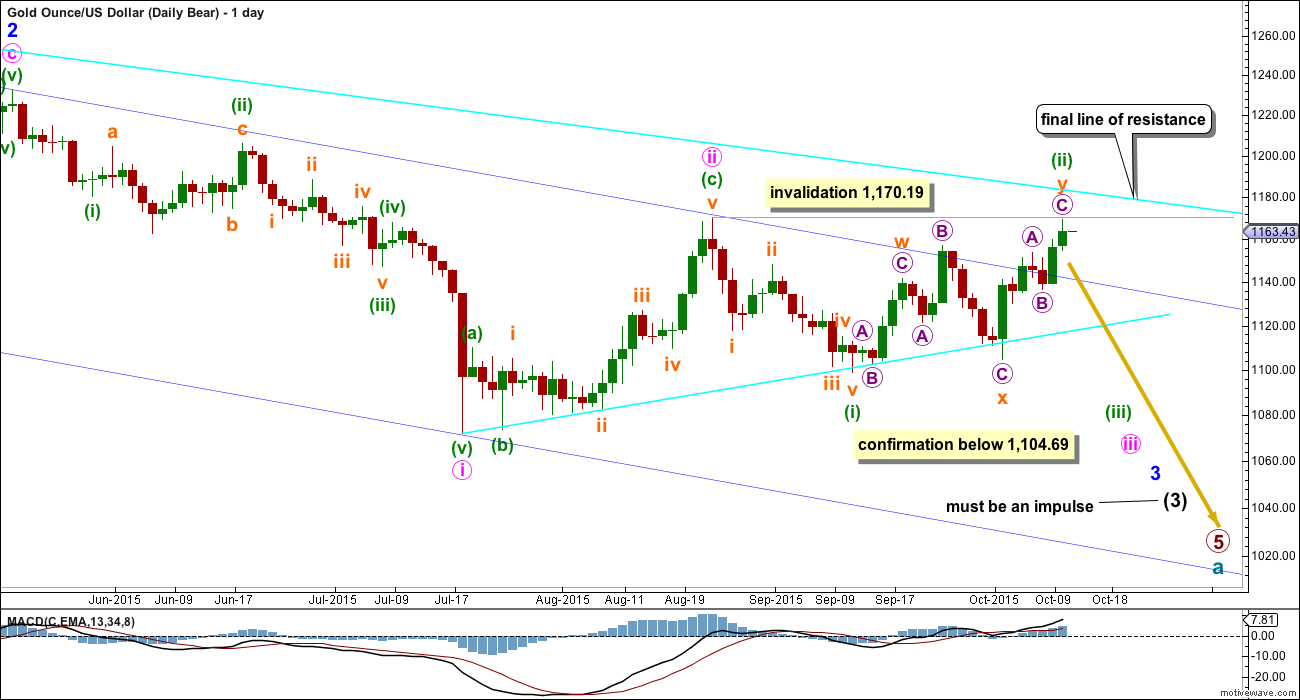
The bright aqua blue line is copied over from the weekly chart. When price gets up there, it should find some resistance. If that line is breached at the daily chart level with one full candlestick above it and not touching it, then that would be full and final invalidation of this or any other bear wave count.
This wave count now sees a series of four overlapping first and second waves: intermediate waves (1) and (2), minor waves 1 and 2, minute waves i and ii, and minuette waves (i) and (ii). Minute wave iii should show a strong increase in downwards momentum beyond that seen for minute wave i. If price moves higher, then it should find very strong resistance at the blue trend line. That line is now breached on the daily chart which substantially reduces the probability of this wave count. Base channels almost always work to show where lower degree corrections find support or resistance, but almost always is not the same as always which means this wave count is still just technically possible. Base channels at this higher degree and higher time frame though really should work better than this. This wave count no longer has the right look.
If minuette wave (ii) continues any higher, then it may not move beyond the start of minuette wave (i) above 1,170.19.
Downwards movement from 1,170.19 will subdivide as a complete five wave impulse on the hourly chart, but on the daily chart it does not have a clear five wave look. Subminuette wave iii has disproportionate second and fourth waves within it giving this movement a three wave look on the daily chart.
Minuette wave (ii) is a double zigzag, with subminuette wave x an expanded flat correction. The subdivisions fit perfectly at the hourly chart level. However, this is a very deep second wave correction and it would be reasonable to expect the strong downwards pull from the middle of a big third wave to force this second wave correction to be more shallow and brief than this. The probability of this wave count is reduced.
Gold has the most textbook looking structures and waves of all the markets I have analysed over the years, probably due to the high volume of this global market. And so I am quite concerned with the look of minuette wave (i). Sometimes Gold has movements which don’t look perfect on the daily chart, but this is uncommon.
Sometimes Gold’s impulse waves start out slowly. There is a good example on this daily chart for minute wave i. When the fifth wave approaches that is when momentum sharply increases, and it often ends on a price shock with a volume spike. This is an even more common tendency for Gold’s third wave impulses. The strongest downwards movement is ahead, and it should be expected to arrive when subminuette wave v within minuette wave (iii) begins.
This bear wave count expects Gold is within a third wave at five wave degrees. Expect any surprises to be to the downside for this wave count. Because of the implications of this potential third wave, although this wave count now has a greatly reduced probability, I still want to publish it as a “just in case” while it remains technically viable (in terms of price). If downwards movement begins to unfold and shows a strong momentum and volume, then this would remain a viable explanation at this stage.
Within minuette wave (iii), subminuette wave ii now shows up very clearly on the daily chart. This was expected, and will give minuette wave (iii) the right look. Minuette wave (iii) may only subdivide as an impulse.
Full and final confirmation of this wave count would come now with a new low below 1,098.85.
I will remove the final target for primary wave 5 at this stage. If it were to reach only equality with primary wave 1 , then this wave count would end about 985. But it has begun with three big overlapping first and second waves, so the target no longer looks low enough. I will calculate a target for primary wave 5 to end at intermediate degree when intermediate waves (3) and (4) are complete. Primary wave 5 may not exhibit a Fibonacci ratio at primary degree.
Click chart to enlarge.
A-B-C of a zigzag and 1-2-3 of an impulse both subdivide 5-3-5, and so for this last upwards movement there is no divergence in how the subdivisions are labelled.
The small blue channel about micro wave C is also drawn in the same way on both hourly charts. It needs to be breached with downwards movement to provide some indication that upwards movement is over for the short term, at least, and the next wave down is underway.
A new low below 1,153.80 would provide small confidence of this bear wave count at this stage, but it now requires a new low below 1,104.69 for reasonable confidence.
TECHNICAL ANALYSIS
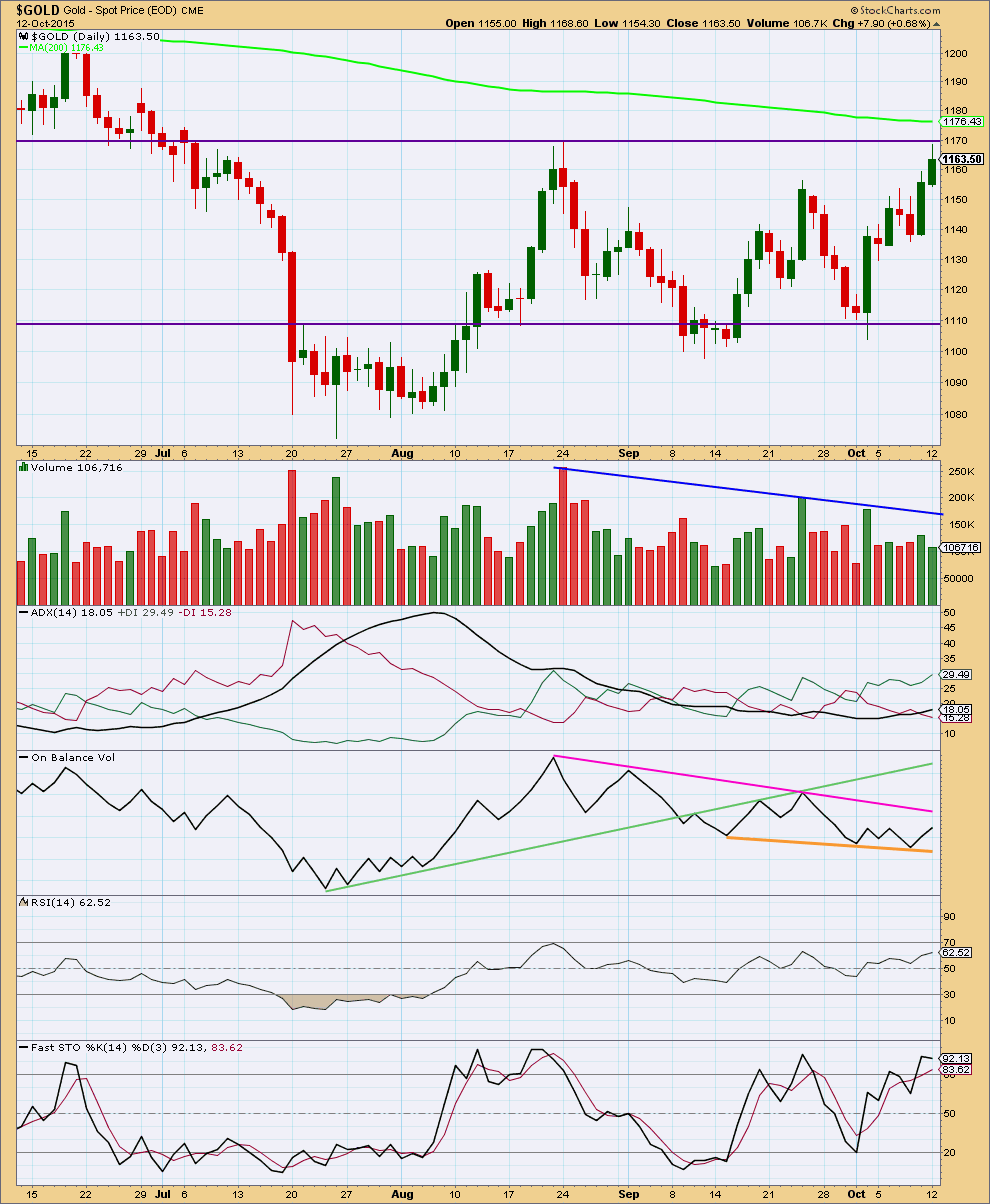
Click chart to enlarge. Chart courtesy of StockCharts.com.
Daily: Monday’s candlestick has a long upper wick which is bearish. Price is finding resistance now at the upper horizontal trend line which is also bearish for the short term. Stochastics is overbought which is also bearish. It would be reasonable to expect at least a small downwards reaction from here.
Price remains range bound between horizontal lines of resistance and support. ADX is starting to indicate the development of a new upwards trend with the black ADX line pointing upwards and the +DX green line above the -DX red line. Although ADX indicates a new trend, price remains within the consolidation band and volume is declining. Volume indicates the consolidation is incomplete. The breakout has not yet occurred. ADX indicates the breakout may be upwards, but volume indicates it may be downwards. The picture is unclear, so it must be left to price as the final determinator.
On Balance Volume has found support at the lower orange trend line and bounced up from there. If it gets up to the longer pink trend line, it may find resistance. This may assist in telling when upwards movement on price may end (short term), if it continues higher today.
While price has made new highs above the last swing high at 1,156 thirteen days ago, RSI is flat. This indicates weakness in this current rise in price and is another indicator which supports a downwards reaction from about here.
This analysis is published about 06:40 p.m. EST.
Expecting retracement, pullback, snap drop,…. should be able to take out 1151…
I’ve spent some time on the five minute chart today looking at the downwards wave of this session.
It will not subdivide well as an impulse. Although it looks like one on the hourly chart, the subdivisions are problematic.
It doesn’t fit neatly as a zigzag either but that is less problematic.
I’m going to have to conclude that it could be either. And with price so close to 1,169.15 at this time it is entirely possible we may see a new high.
However, the candlestick patterns are bearish. Yesterday’s long upper shadow and today’s hanging man are bearish, the hanging man a reversal pattern.
Gdx and oil look very bearish as well
Bought some more dust this morning for a trade. I am getting the sense that assets are rolling over, oil, miners, stocks, silver, and gold coming. I am looking for a nice weak close.
The bull wave count expects still this upwards move should be a third wave. It now sees it as micro 3 within subminuette iii within minuette (iii).
The bear sees a five down and a sharp deep three up…. and on the five min chart it looks like the sharp upwards move is an impulse (I have a cursory count of 13 for it which is impulsive) so it needs waves B and C to complete a zigzag and it cannot make a new high to remain valid. Another VERY deep correction is a great concern for the bear.
Second waves can be deep, and often are deep, and they can correct 100% of the first wave. But these second waves are coming right before a third wave at intermediate degree moves towards the middle, it should have the power to pull them down making them less deep and quicker.
That’s usually how it works. But not always.
Neither wave count has entirely the right look, both have problems. Price must be the ultimate determinator.
Meanwhile… over at US Oil there is a wave count which has been working for a while in a market which is more clearly trending and has been for a while.
While Gold is not offering opportunities with a decent probability and the situation is unclear, it won’t always be like this. And there are other markets we may take advantage of while we wait for Gold to sort itself out.
Thank you Lara,
With Gold and miners so unclear lately, I’ve managed to make a couple nicely profitable short-term trades in DWTI, with your analysis as an aid. If intermediate wave 2 is complete for oil, as you suggest, then there should be a nice trend settling in over the coming weeks to trade in and out of with some confidence.
There’s a strong caveat on my US Oil analysis: the end of intermediate (2) is not yet confirmed.
It absolutely requires a breach of the channel for confirmation.
Expecting it’s over and acting accordingly at this stage is picking a top, not advised.
I agree. I’ve been halfway expecting a possible final trust upward. For the time being it’s quick intra-day trades. And tight stops.
The run was in NUGT from 9:36 at $41.51 to 9:52 at $44.45 up $3 in 16 minutes.
It may still continue up unless gold already had a 5 wave up today.
Any wave counts?
If the bear count is in play, looks like there is now a 5 down on the hourly and this up move could be a wave 2. No new high allowed.
I wish we had a new Bull hourly wave count after it was invalidated.
Next up, wave 3 of 3
I’m long but in my view gold needs to make a very strong move up, like very very soon. If not, I’m going to let myself be stopped out and I’ve set it very tight, because even though the tape seems to remain bullish, and certainly that overnight move seems to confirm that (and saved my you know what), I’d normally look to short the type of chart action I’m seeing now. But I’ll let the market take me out, and won’t jump the gun on the short. Tape remains bullish and that is more importation than what the chart seems to indicate at the moment, which can many times be misleading. Also in the larger timeframes, it looks like a nice cup and handle, but at the same time, we’re stalling at top of the daily bollinger band and this could simply be a throwback to the big breakdown area. If this move is real the daily chart will trump the shorter term chart indications, but this needs to move very strong very soon or I”m gonna bail
I think it will be very strong, looking for +30 by Friday
too late. I got stopped out :(. I wanted immediate results lol. Too risky with that action.
For the bull count, maybe a flat is developing. If so, we’ll go back down toward 1,150 again before going up more.
Hourly bull wave count invalidated below 1,153.80 at 10:36 pm dropped to 1,153.08.
Lara discusses in comment below.
Irrespective of the wave count, prices seem to be contained by the orange channel on the hourly bull chart.
iv moves into i territory on this pullback, ending diagonal possibly?
No, it has to be a third wave for the bull which may only be an impulse.
The only option now for the bull is to move everything within subminuette iii down one degree; the last wave up would be micro 1 and this downwards move would be micro 2.
Now the bull has the problem of lower degree second wave corrections breaching a base channel about a first and second wave one or more degrees higher.
Neither wave count will work with base channels. Which is a problem, but then base channels just don’t always work as they should. Just mostly.
Thanks for the timely update! I think Oil might be foreshadowing….
They are not making this easy. quite a battle. I thinking one more $USD low before it takes off to the upside
I was thinking ending diagonal for the bear count, which would fit with a drop and deep correction for the 1-2 that follows.
Never a dull moment. Gold very weak and already below the hourly bull invalidation of 1,153.80!
Excellent!
If EW count is calling for bull trend than one need to look at how gold bottomed and began it’s bull trend back in 1999 and 2000.
It is a combo chart of gold and HUI.
As gold went up sharply up in 1999 it came down also by 2000. Miners (HUI) did not bottom till 2002.
This is for the history.
Tham-are you out there? Would be very interested to hear you current thoughts on DUST.
“I know other Ellioticians have wave counts which see this move as a three, but I do not know how they managed to do that and resolve the problem.”
Lara, I’m resubscribing today anyway. Somewhere in the middle of this bear market Elliott Wave Principle taught me that the correct answer is always “I don’t know”.
o7
Welcome to EWG. You will love it. Bear markets are always tough to trade. Specially the wave B’s.
Lara will keep us reminding those complex wave b.
I like to read your trading idea and market call.
Thanks in advance.
Ok, here’s what I was working on at 2am last night, inspired by Matt’s posts on the all encompassing trend lines, which I realised I’ve misread. Still, it’s worth some thought.
I feel humbled that something I wrote inspired you.
Lara included the long term trendline on today’s weekly bear chart.
Hi Matt, I’d be interested to hear what you see in this chart
Well, the next line above the current price is where gold will likely turn around. That appears to converge with the long term downtrend line on today’s weekly bear chart. Also, the thick bottom rail could be where this bear market ultimately ends.
I would also add that gold is approaching a long time band of former support/ now resistance in the 1180s. That was support on multiple occasions throughout this bear market. It seems like gold will give that area one final kiss goodbye.
I think your chart is on an arithmetic scale? If so, switch to semi-log.
Higher time frames should always be viewed on a semi-log or log scale.
Exactly.
It’s an exercise in probability. No analyst ever will be able to say with 100% certainty what a market will do next.
The goal is to see what the technical indicators are pointing to, and weigh up the evidence.
Then manage risk in case you’re wrong. Always manage risk.
Excellent, thanks Lara. I bought both dust and JDST in pre market and on today’s close my miner short position is just short of break even. We were so close to $1170 without breaking and the swing in GDX/Gdxj was great to see. Silver also didn’t get a new high.
I added to my position this morning because there are 4 or 5 gaps (depending how you count them) down below on this move in the miners. We are either going to correct down a fill a few or this is the next leg down impulsively. GDX/gdxj technicals on the daily are beginning to roll over.
I am leaning towards bear yet, but I will have to evaluate that again in the coming days as we correct hear.