
After a new high above 1,170.19 was made only two wave counts remained valid and both expected more upwards movement, which is what happened.
The new high strongly favours the bull Elliott wave count.
Summary: The target for upwards movement to be interrupted is 1,198. If the next daily candlestick remains above the final line of resistance, then the bear wave count should be discarded.
New updates to this analysis are in bold.
BULL ELLIOTT WAVE COUNT
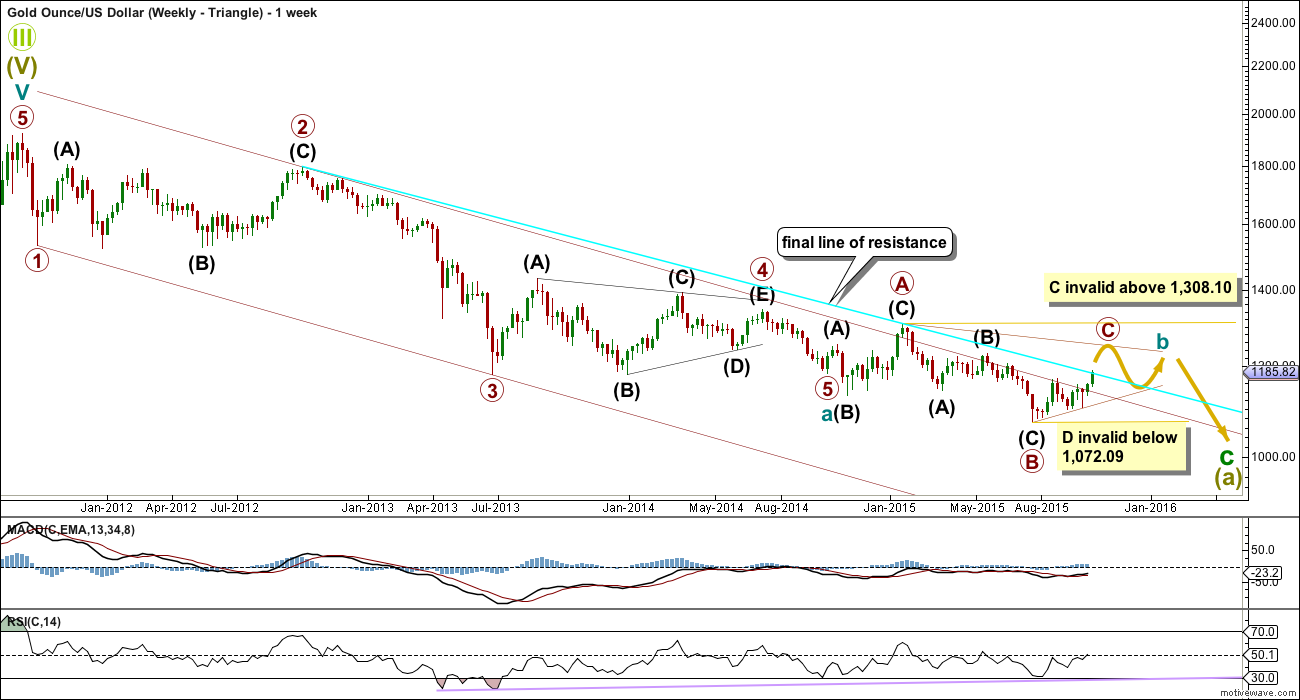
WEEKLY – TRIANGLE
Click chart to enlarge.
Both bull and bear wave counts are identical to the end of primary wave 4. Thereafter, the bear sees primary 5 incomplete, but the bull sees primary 5 as over, so the bull wave count sees cycle wave a as a complete five wave impulse.
Gold often exhibits surprisingly short fifth waves to follow its fourth wave triangles. Here primary wave 5 is 13.85 longer than 0.382 the length of primary wave 1. Primary wave 5 is slightly truncated by 2.66. The truncation is the biggest problem for this bull wave count, but because it follows a fourth wave triangle for a short fifth wave it is entirely possible.
Once a full daily candlestick is above the final line of resistance, which is now drawn on all weekly and daily charts, then a trend change from bear to bull would be highly likely.
I would not see cycle wave a complete at the next low labelled intermediate wave (B) for two reasons: it would be difficult to see primary wave 5 as a five wave impulse, and the wave up labelled intermediate wave (C) will not subdivide as a three and meet all Elliott wave rules. I know other Elliotticians have wave counts which do this, but I cannot see how the violation of the rules has been managed there. To see why intermediate wave (C) will not subdivide as a three, see the explanation in the video of 20th August at 10:28.
If cycle wave a ends with a slightly truncated fifth wave, then cycle wave b begins there. There are 23 possible corrective structures a b wave may unfold as (if all the different kinds of triangles and combinations are counted).
Within cycle wave b, primary wave A subdivides perfectly as an expanded flat, which is a very common structure. Primary wave B subdivides as a zigzag, also a common structure. Primary wave B is 1.89 the length of primary wave A. This is longer than the normal maximum of 1.38, but within allowable convention of 2.
When an A wave subdivides as a three the correction may not be a zigzag. It may be a flat, combination or triangle. This first chart looks at what a triangle would look like. The triangle would be a running contracting or barrier triangle. Within the triangle, primary wave C up must be a single or multiple zigzag. Primary wave C may not move beyond the end of primary wave A above 1,308.10.
If primary wave C is subdividing as a double zigzag, then the first zigzag may be complete (as the zigzag labelled minor wave 1 on the daily chart) and the second zigzag may now be underway. If current upwards movement ends about 1,218, then primary wave C would reach 0.618 the length of primary wave B. One of the five sub waves of a triangle is sometimes close to 0.618 its predecessor. Otherwise primary wave C may end about 1,261 where it would be about 0.8 of primary wave B. In my experience this is a common length for triangle sub waves.
Primary wave D may not move below the end of primary wave B at 1,072.09. But primary wave D has not yet begun, so within primary wave C no second wave nor B wave may move below 1,072.09.
There is strong and persistent divergence between price and RSI at the weekly chart level going back to April 2013. This is a bullish indicator, but it does not tell us exactly where price will find a low.
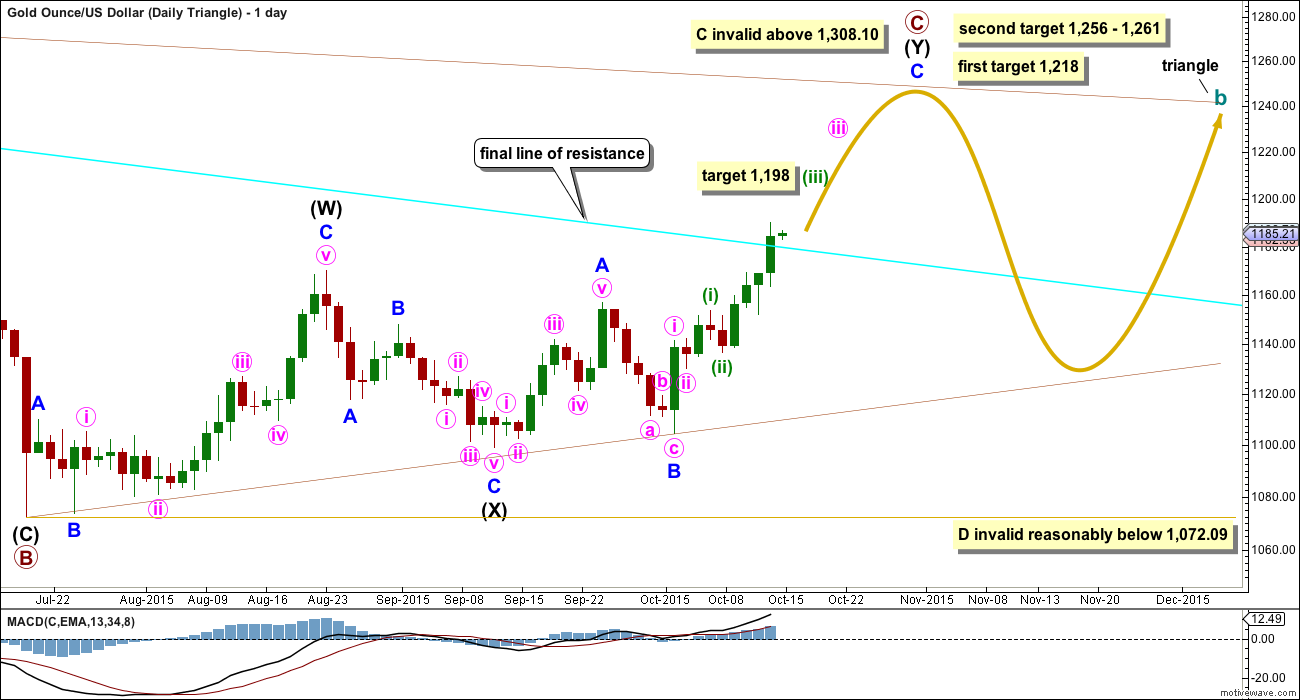
DAILY – TRIANGLE
Click chart to enlarge.
This idea slightly diverges from the other two ideas for cycle wave b as an expanded flat or combination and now at this stage requires its own daily chart.
The expected direction is still exactly the same, and the current upwards structure is still seen as an impulse. The first short term target at 1,198 is also the same. This target is where minuette wave (iii) would reach 2.618 the length of minuette wave (i).
The first target at 1,218 is where primary wave C would reach 0.618 the length of primary wave B. If price gets up to the first target and the structure of minor wave C is a complete five wave impulse, then it may be over there.
The second target at 1,256 is where minor wave C would reach 2.618 the length of minor wave A, and at 1,261 primary wave C would reach 0.8 the length of primary wave A.
For the triangle idea, for cycle wave b, a five wave impulsive structure only needs to complete upwards. The next wave down for primary wave D should be fairly time consuming, lasting about 2 to 6 months. Primary wave D may not move beyond the end of primary wave B at 1,072.09 for a contracting triangle. Alternatively, primary wave D may end about the same level as primary wave B at 1,072.09 for a barrier triangle, as long as the B-D trend line remains essentially flat. In practice this means primary wave D can end slightly below 1,072.09 and this wave count remains valid. This is the only Elliott wave rule which is not black and white.
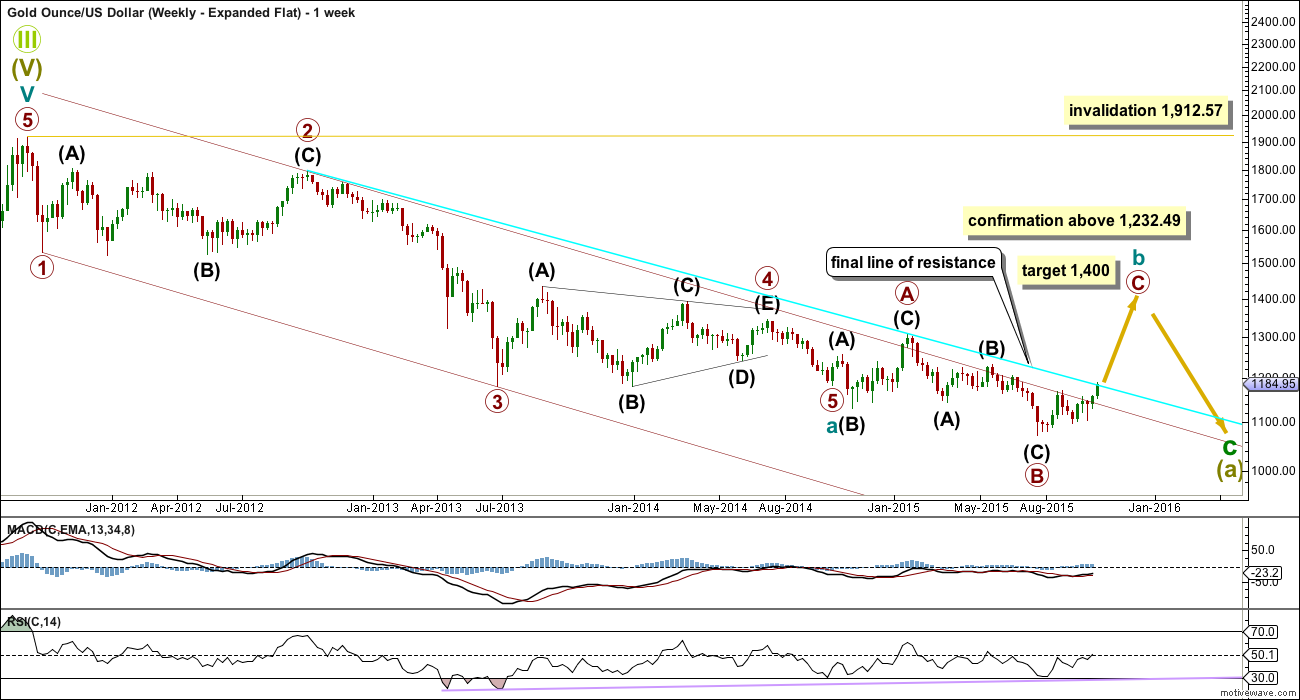
WEEKLY – EXPANDED FLAT
Click chart to enlarge.
Cycle wave b may also be a flat. Because primary wave B is over 110% the length of primary wave A, this would be an expanded flat, which are very common structures.
At 1,400 primary wave C would reach 2.618 the length of primary wave A. Primary wave C may only be a five wave structure, either an impulse (much more likely) or an ending diagonal. Because of the length expected here of primary wave C, the leading diagonal on the daily chart would be only intermediate wave (1) if the diagonal is the more common contracting type.
If the diagonal indicates it will be expanding (if minor wave 3 reaches above 1,197, then it will be longer than minor wave 1, so the diagonal must then be expanding), then I would increase the degree of labelling at the daily chart level for this idea and see an ending expanding diagonal unfolding for primary wave C. At that stage, then this expanded flat idea would also require its own daily chart.
Cycle wave b may not move beyond its start above 1,912.57 because cycle wave a was a five wave structure.
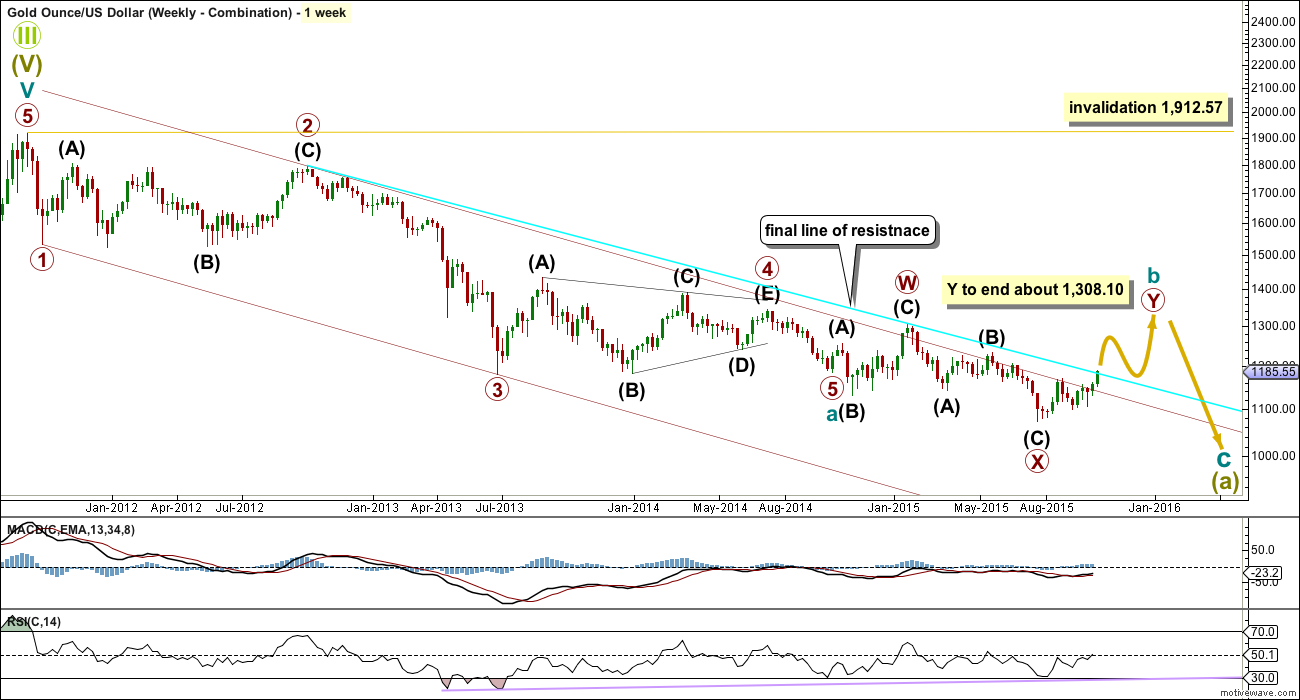
WEEKLY – COMBINATION
Click chart to enlarge.
Combinations are also common structures. In this weekly chart, the first structure in the double was an expanded flat labelled primary wave W. The double is joined by a three, a zigzag in the opposite direction, labelled primary wave X. X waves are most often zigzags and within combinations they may make new price extremes beyond the start of the first structure in the double.
Primary wave Y may be another flat for a double flat (they have the same purpose as double combinations), it may be a zigzag, or it may be a triangle for a double combination.
The purpose of combinations (and multiple flats) is the same as triangles. They take up time, move price sideways, and test our patience. The second structure in the double normally ends close to the same level as the first to achieve the sideways purpose. Primary wave Y would be expected to end about 1,308.10.
A leading diagonal would be unfolding for intermediate wave (A) of a zigzag for primary wave Y, for this idea at the daily chart level. Alternatively, a double zigzag may be unfolding upwards for intermediate wave (A) of a triangle or flat correction for primary wave Y.
Click chart to enlarge.
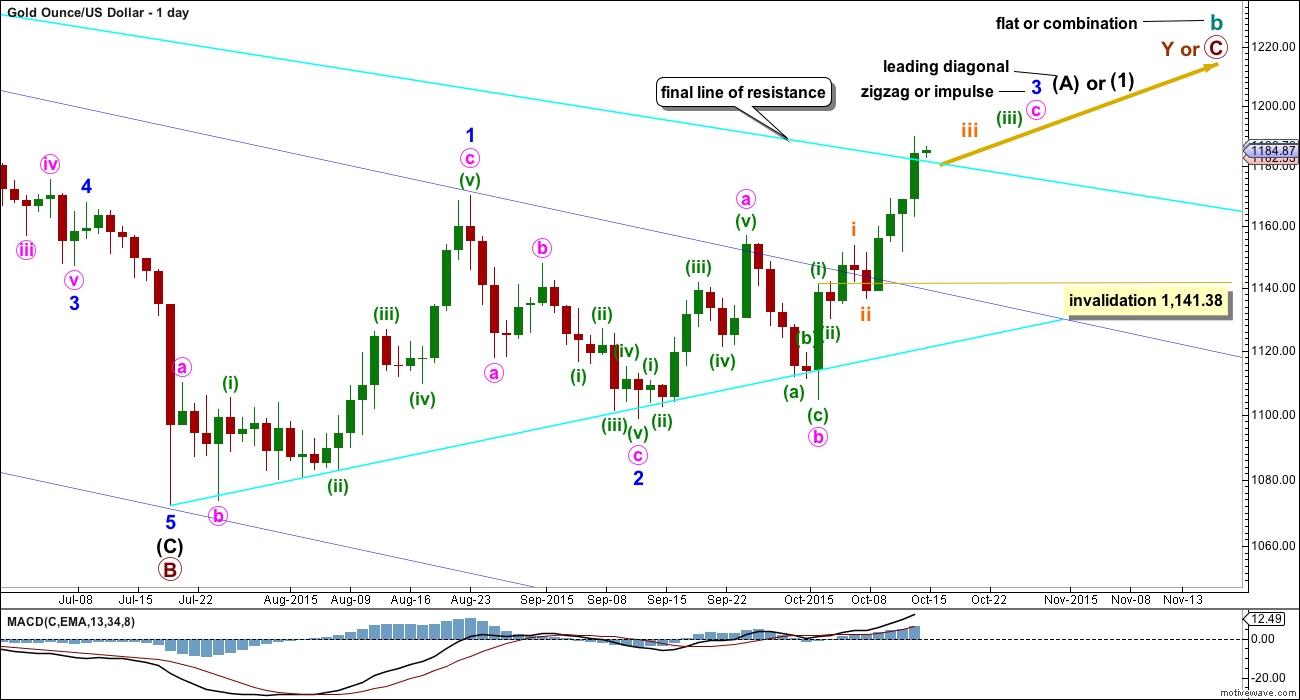
If the next daily session completes a candlestick which remains above and not touching the final bright aqua blue line of resistance, then this bull wave count would be considered confirmed. I would discard any bear wave count at that stage. Simple is best, and trend lines are the most reliable way to confirm trend changes.
This second daily chart will suffice for both the combination and expanded flat ideas.
If cycle wave b is an expanded flat, then primary wave C must be a five wave structure. If the current diagonal unfolds as a contracting diagonal (most common), then it would be intermediate wave (1) of a five wave impulse upwards for primary wave C. If the current leading diagonal unfolds as an expanding diagonal, then the degree of labelling within primary wave C may be moved up one degree because an expanding diagonal may be an ending diagonal for primary wave C in its entirety.
If cycle wave b is a combination, then primary wave Y may subdivide as either a zigzag, flat or triangle. A zigzag would be most likely. The first structure in the double was an expanded flat. If primary wave Y is a zigzag, then the diagonal would be a leading diagonal for a five wave structure for intermediate wave (A).
At 1,197 minor wave 3 will pass equality in length with minor wave 1. Above that point the diagonal must be expanding and not contracting.
A leading diagonal requires the second and fourth waves to subdivide as zigzags. The first, third and fifth waves are most commonly zigzags, but sometimes may appear to be impulses. So far minor wave 1 fits well as a zigzag.
Minor wave 2 can now be seen as a complete zigzag. It is 0.73 the depth of minor wave 1, nicely within the normal range of between 0.66 to 0.81 for a second wave within a diagonal.
Third waves within leading diagonals are most commonly zigzags, but sometimes they may be impulses. Minor wave 3 is now showing some increase in upwards momentum beyond that seen for minor wave 1. Minor wave 3 has moved above the end of minor wave 1 above 1,170.19.
There now looks like a five up on the daily chart within minor wave 3. This may be minute wave a within a zigzag or it may also be minute wave i within an impulse.
Current upwards movement would be minute wave c or minute wave iii. Either way, it must subdivide as an impulse. On the hourly chart so far the structure looks incomplete.
Click chart to enlarge.
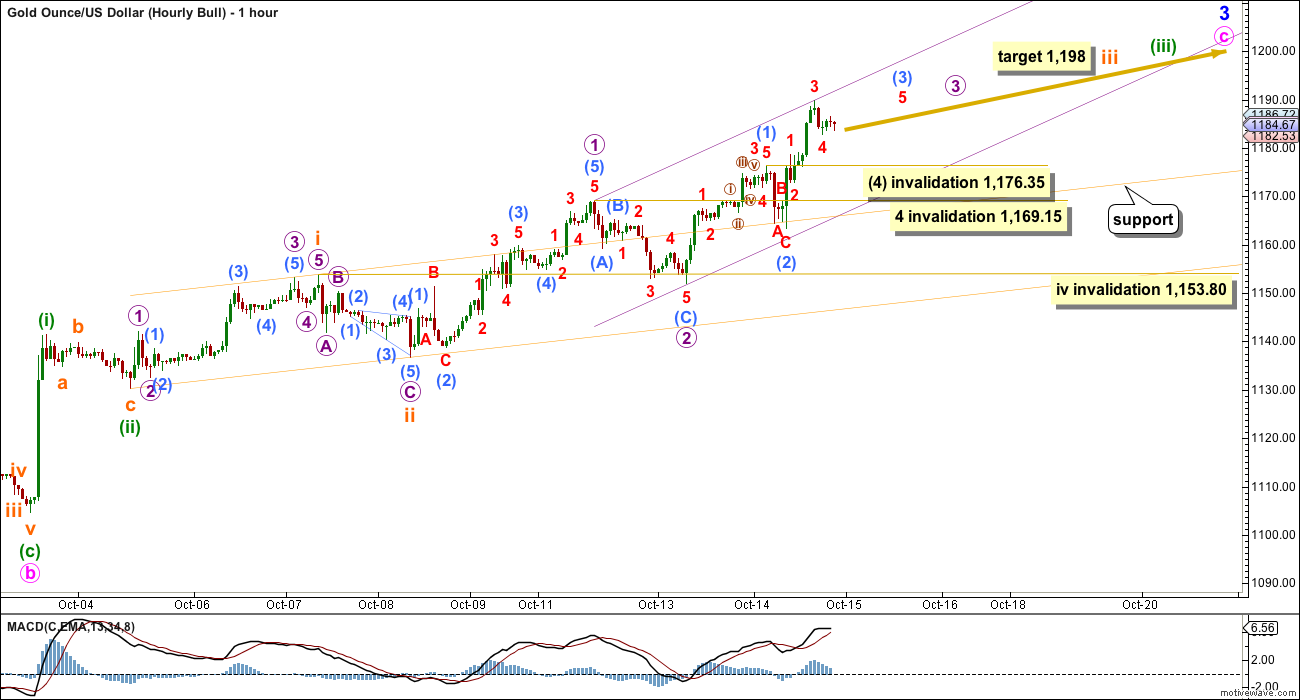
Today the hourly chart will show the entire structure upwards for minute wave c.
For all daily charts, a five wave impulse is unfolding upwards. The hourly chart will focus on identifying when and where it may be complete, and what confirmation will be required to confirm its end.
The first thing to note is there is a lot of overlapping at the start of this movement. Micro wave 2 overlaps into subminuette wave i price territory, so this cannot be subminuette wave iv. Subminuette wave ii overlaps into minuette wave (i) price territory, so that cannot be minuette wave (iv). The conclusion must be that the middle of the third wave of this impulse is incomplete.
When micro wave 3 is complete then a series of three fourth wave corrections would be required to unfold and remain above each accompanying first wave price territory.
For now sub micro wave (3) would be incomplete and needs a fifth wave up to end it. Sub micro wave (4) to follow may not move into sub micro wave (1) price territory below 1,176.35.
Thereafter, sub micro wave (5) should move higher to complete micro wave 3. Micro wave 4 after that may not move into micro wave 1 price territory below 1,169.15.
The next interruption to the trend at the daily chart level (with a red candlestick or doji) may be micro wave 3. It would reach 1.618 the length of micro wave 1 at 1,204. Micro wave 2 does show on the daily chart but not as a red candlestick. Micro wave 4 may or may not show on the daily chart. Either way, this impulse would still have the right look.
The next interruption to the trend at the daily chart level of which I could be more confident would be the end of subminuette wave iii. At 1,198 it would reach 2.618 the length of submineutte wave i. (I know this target is lower than the target for micro wave 3 at 1,204. If micro wave 3 reaches its target, then the target for subminuette iii must be recalculated).
Subminuette wave iv may not move into submineutte wave i price territory below 1,153.80.
The orange channel is a base channel about subminuette waves i an ii. It is providing some support.
The violet channel is an acceleration channel about the middle of this third wave. As price keeps moving higher keep redrawing the channel. Draw the first trend line from the ends of micro wave 1 to the last high, then place a parallel copy on the end of micro wave 2. When micro wave 4 arrives, it may find support at the lower edge of this channel.
Momentum continues to show an increase. I would not expect to see the end of micro wave 3 until MACD shows some divergence with price.
BEAR ELLIOTT WAVE COUNT
Click chart to enlarge.
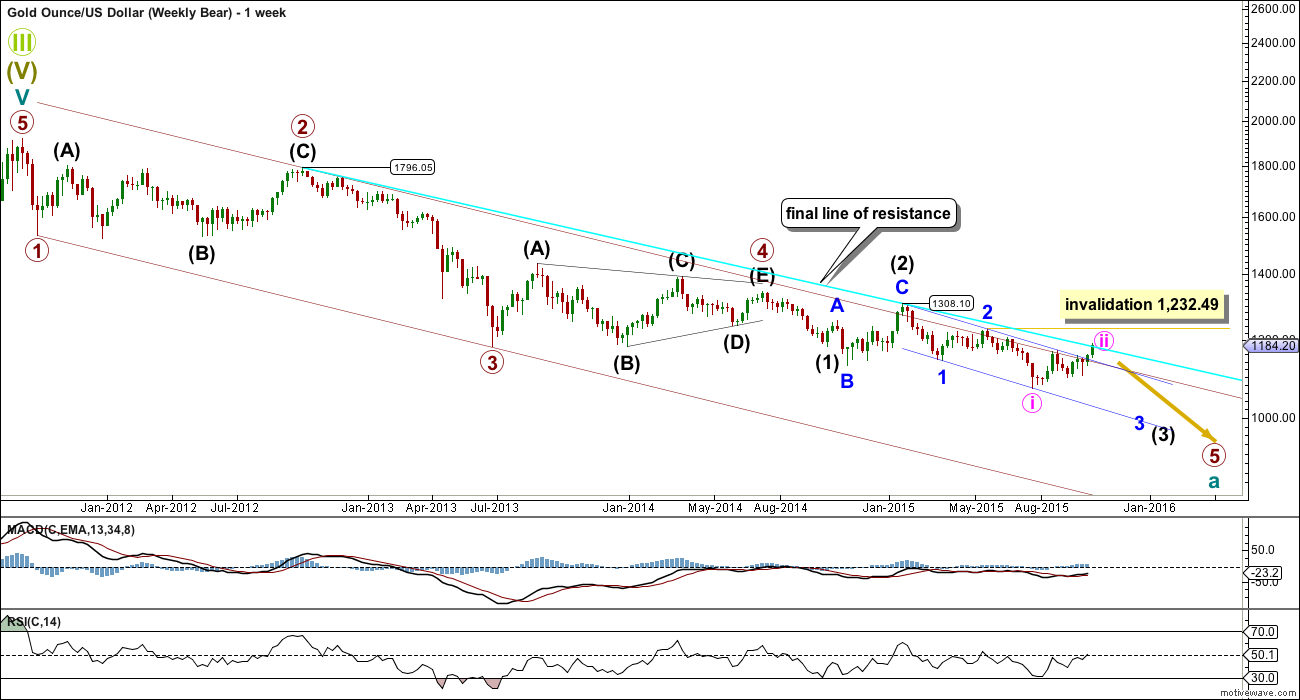
The wide maroon channel is drawn about this impulse using Elliott’s first technique: the first trend line is drawn from the ends of primary waves 1 to 3, then a parallel copy is placed in the end of primary wave 2. This channel is now breached two times (so far, the current week is incomplete and may not end in a breach) and overshot once. If this week ends with a breach of this channel, then it may be used to confirm a trend change.
A final line of resistance is added from the highs labelled primary wave 2 at 1,796.05 to intermediate wave (2) at 1,308.10. If that bright aqua blue line is breached, then it would provide full and final technical confirmation of a trend change from bull to bear.
I have considered an ending diagonal for primary wave 5. It will not fit because the wave up labelled minor wave C of intermediate (2) will not fit as a zigzag.
Click chart to enlarge.
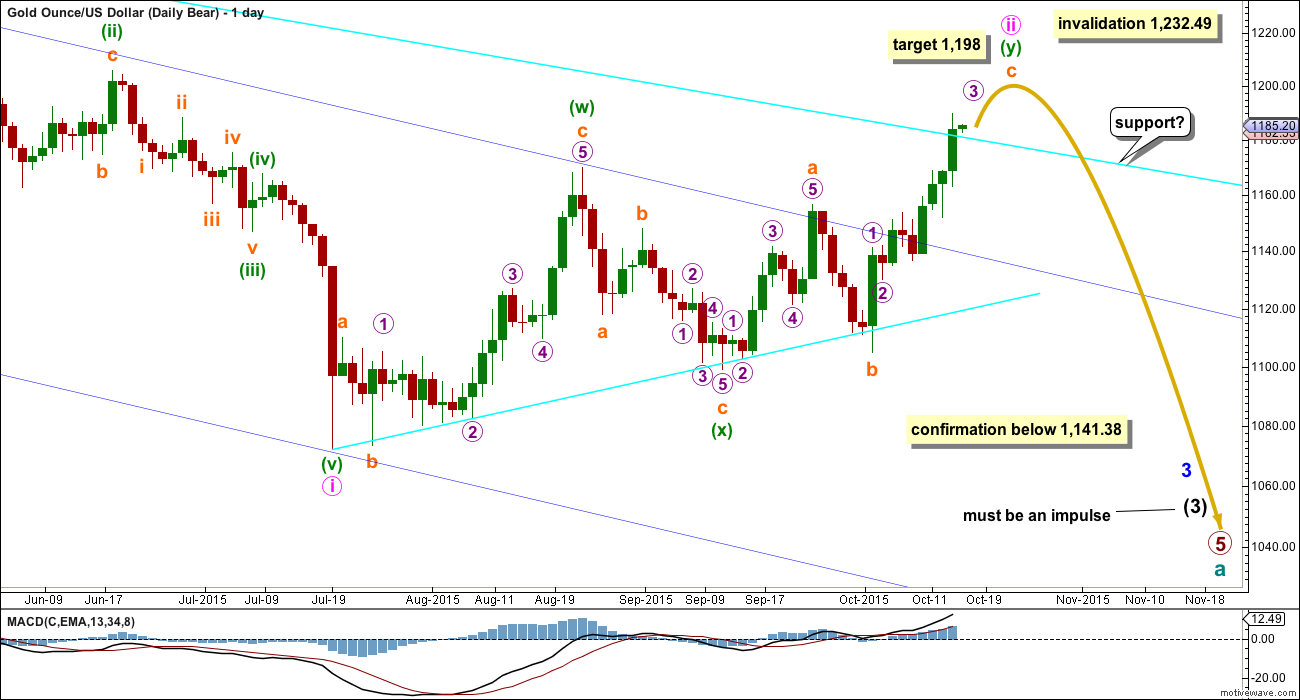
The only option now for a bear wave count is to see minute wave ii continuing higher as a double zigzag.
Minute wave ii has strongly breached the dark blue base channel drawn about minor waves 1 and 2. When a lower degree second wave correction breaches a base channel drawn about a first and second wave one or more degrees higher, then the probability of the wave count reduces, particularly at higher time frames.
Upwards movement is now above the final line of resistance and may now provide some support. Price may throwback to that line.
The structure of upwards movement for the bear wave count is exactly the same as the bull for the short term: a five wave impulse is unfolding upwards and it is incomplete.
Minute wave ii may not move beyond the start of minute wave i above 1,232.49. A new high above that price point would be final price invalidation of any bear wave count. That would fully eliminate the concept that Gold remains in a bear market. No bear wave count should be considered above that point.
TECHNICAL ANALYSIS

Click chart to enlarge. Chart courtesy of StockCharts.com.
Daily: An upwards breakout is indicated by price breaking above the upper horizontal trend line on increased volume. For the last three days, price has moved higher with each day showing an increase in volume. The upwards movement is supported by volume.
ADX is now above 20 and pointing upwards indicating a new trend. The trend is upwards with the +DX line above the -DX line.
On Balance Volume broke above the short pink trend line providing a weak bullish indicator. It is weak because the line is short and tested only twice before. It is still further bullish indication though.
There is no longer divergence between price and RSI. RSI is not yet overbought.There is room for further upwards movement.
The most bearish indication today comes from Stochastics. While price has moved to make new highs, Stochastics is pointing lower and not higher. This provides some bearish divergence. While this divergence indicates a correction at least should unfold soon, it will not tell us exactly where and when that correction should begin. It is an indicator and not definitive. The swing high of 24th of August was reached three days after Stochastics and price began to show divergence.
This analysis is published about 10:28 p.m. EST.
This is what it takes to call a bottom in the gold market – Oct 15, 2015 11:12 a.m. ET
Avi Gilburt
http://www.marketwatch.com/story/this-is-what-it-takes-to-call-a-bottom-in-the-gold-market-2015-10-15?siteid=yhoof2
Some thoughts/questions:
Has anyone noticed that the A and C waves (assuming the end of upward movement), of this 3 wave correction up from the July low, are virtually identical in length?
Also, if you believe in the bull count, do you really think that gold dropped another $100+ below the end of primary 5 and took 40 weeks to do so? Forgive me, but this just doesn’t register.
For the bull count that drop was a B wave. It’s a 1.89 correction of the A wave.
I’ve seen plenty of B waves within expanded flats that are that long.
B waves tend to be time consuming. 26 weeks for a primary degree B wave looks about right to me.
From Martin Armstrong public blog posted 15 October. Interesting that he is somewhat specific as most his blog posts are vague.
“We need gold to close above 1187.50 tomorrow to signal some further upside is possible. We need a daily closing above 1206 to suggest pushing higher. If we can get a weekly closing ABOVE 1210, then we can see a pop up to the key technical resistance at the 1285 area. Caution is ADVISABLE. There is a risk that the further we move up now without breaking out, then there will be a greater risk of a very sharp drop into the Benchmarks. As far as a real change in trend is concerned, not everything is yet lined up to imply such an event looking across the global market landscape. We will let you know if this changes at all. So far, this is nothing unusual.”
I may regret saying this, but I think there is a chance that today marked a major high. Gold may have just completed waves 1 and 2 of a diagonal down.
Have to admit, this may not be conclusive. In the past, these quick up and down spikes have often turned out to be flat corrections. A new high is needed for proof.
Two weeks ago, I reckoned that gold would be on the bull track having undergone a first and second wave from 1072.01. DUST looked toppy at 27.96, and NUGT seemed to have hit bottom at 25.70. I thought that I was in the minority for not being bearish then, and hence my absence from this forum to concentrate on the bull scenario.
I went long NUGT, and have not regretted the run up towards 52 (my target is actually 59.20). The drop in gold price today gave me cold feet and I bailed out, rightly or wrongly. Moreover, my target drop for DUST is 11.53 which was already met yesterday. If DUST falls any much further, the next stop is 11.07/11.10, the previous two lows, giving it a triple bottom. DUST ought to rise from here, provided gold is on the bear track all along, and the past fortnight had been a correction, and a bull trap. Let’s wait till the smoke clears and the bull/bear dichotomy can be resolved one way or the other.
Alan and Matt thanks for sharing your understanding of gold, NUGT and DUST directions.
Those opinions are essential whether agree or not with EW, which is extremely helpful however as Lara says EW should also be augmented with additional technical analysis.
Gold daily gave a buy July 29th then again on September 16th then again on October 5th.
Gold weekly gave a buy August 17th then again September 14th
Gold monthly gave a buy the beginning of October.
Gold today is a Buy at monthly, weekly and daily time frames.
NUGT Daily gave a buy on October 2nd.
NUGT today is a buy right now 1:12 pm at the Monthly, weekly, daily, 195, 78, 39 minute time but a sell at 15, 5, 3 and 1 minute time frames.
NUGT had a bottom at 1:12 pm and turned back up at the smallest time frames.
Alan
Lara wrote this: Subminuette wave iv may not move into submineutte wave i price territory below 1,153.80.
That is in flat and combination portion.
In the chart she has several invalidations?????
Papudi, the invalidation this morning was sub micro wave (4) went below 1,176.35 after sub micro wave (3) completed at 1,191.64 at 8:18 am.
Gold has to first complete subminuette wave iii target at 1,198, only then your subminuette wave iv invalidation below 1,153.80 would apply in the future but not yet.
Thanks
The flat and the combination wave count have been invalidated. Lara stated, and I quote:
“Sub micro wave (4) to follow may not move into sub micro wave (1) price territory below 1,176.35.”
So, the triangle is the only option remaining for the bull. As you guys have already noted, the bear has been given a new lease of life.
Tham thanks for your clarity.
I think the bear count is alive again on good behavior and still can’t be above the final line of resistance for 1 full daily candlestick.
Yes Tham, only the daily triangle and daily bear charts are still valid.
Yes the daily combination and hourly bull charts are also invalidated.
If the next daily session completes a candlestick which remains above and not touching the final bright aqua blue line of resistance, then this bull (combination) wave count would be considered confirmed. No confirmation since gold went below aqua blue line of resistance.
Not quite.
The sideways movement to start Thursdays session is out of proportion to the prior small correction I had labelled minuscule wave 2 within submicro (3).
And so submicro (3) may have already ended at yesterdays high. Thursday may have seen the end of micro waves 3 and likely 4. Unless micro 4 continues sideways as a triangle.
I think the downward spike in Thursdays session was micro wave 4, not submicro (4).
And now I can see the middle of the third wave.
And so it only requires a new high to end subminuette iii and it would be ready for a multi day correction for subminuette iv.
Micro wave 3 may have ended at 1191.64 however the upper target is 1,198 (or maybe higher) unless going below the daily bright blue aqua line of resistance changed things for gold but Lara didn’t mention that.
“The only option now for a bear wave count is to see minute wave ii (at 1,198) continuing higher as a double zigzag.”
Last minute reprieve for the Bear count it lives on again as gold dropped down to 1,174.42 at 8:44 am, which is below the daily bright blue aqua line of resistance at about 1,180 or 1,182 area, which 1 full daily candlestick above it would of ended the bear count.
Yes. That line is not properly breached, only overshot so far.
The bear lives on today. Hanging by a thread.
Gold at 1174.35. Is bear count still alive??? Any EW count pls??
I believe that there was a small 4th wave triangle followed by a short 5th wave up to complete this upward movement.
And, yes, I do believe the bear is alive.
Thanks Lara. Excellent analysis. This site must be the first one to declare gold in bull trend and bottom is in. Price finally told that bottom is in.
To complete cycle wave b will take some few years to end at 1400.
right or wrong, you deserve a round of applause
Thanks!
Wow, that is a significant amount of analysis, thank you Lara for all of the extra work today.
Good luck trading everyone!
Thank you. Now you can see why that took so long.
And it gets worse. The more I did today the more I could see other possibilities require daily charts.
I’m not going to pick a winner for this bull count. I’m going to chart all the possibilities and we can eliminate each one by one.
Short term they’ll all need a five wave impulse up to complete anyway. So no divergence there.
Hi Lara…
I love it when you have multiple scenarios…
and they all say several days of the same direction…
usually makes for 3-5 day gains of 10%+ in either NUGT or DUST…
with a 2% stop the risk reward is almost always 5:1…or better….
then we milk one of those two cows…
Thank you again and again and again Lara…
You’re most welcome Ted 🙂